The GBP/USD pair is currently navigating a critical juncture, trading around the $1.3350 mark as the early European session unfolds. While the British Pound has managed to gather some strength, it remains capped below the significant 100-day moving average, hinting at underlying caution in the market. This delicate balance is occurring amidst a backdrop of shifting economic data, particularly from the US, where cooling labor market figures have weighed on the US Dollar. Traders are now intently focused on deciphering which way the scales will tip, with a keen eye on key technical levels and the implications of upcoming economic releases. The interplay between the Bank of England's policy stance and the Federal Reserve's next moves will be paramount in determining the trajectory of this major currency pair.
- GBP/USD is currently trading near $1.3350, showing mild gains against a softening US Dollar.
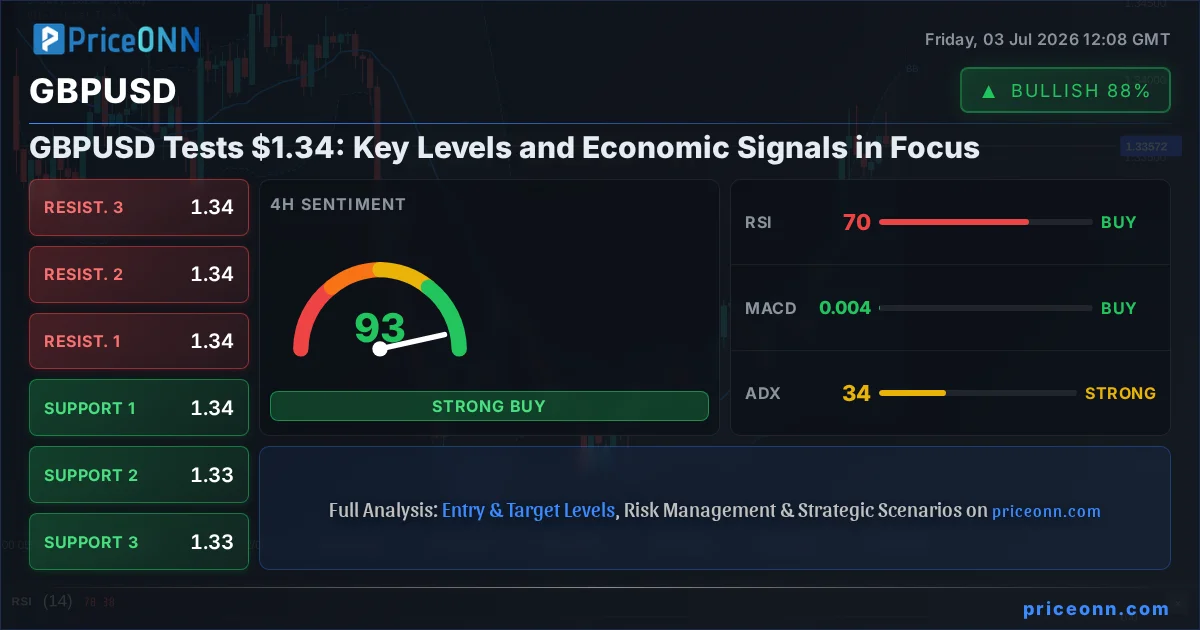
- The 100-day moving average presents a key resistance hurdle, currently capping upward momentum.
- RSI at 57 indicates a neutral but slightly bullish leaning, while the ADX at 29 suggests a strong existing trend, though its direction needs confirmation.
- Upcoming US Non-Farm Payrolls (NFP) data and Bank of England policy considerations are critical factors to watch.
Navigating the $1.34 Confluence Zone
The GBP/USD pair has found itself in a tight trading range, hovering around the $1.3350 level. This price point is more than just a number; it represents a critical confluence of technical and fundamental pressures. For bulls looking to extend the recent upward momentum, breaking decisively above the 100-day moving average is the immediate objective. This average, a key barometer of medium-term trend health, currently acts as a ceiling, capping rallies and suggesting that the market is not yet fully convinced of a sustained upward move. The current price action shows a degree of indecision, with the pair oscillating around this significant technical barrier. The fact that GBP/USD is trading with mild gains, as reported by early European session data, indicates a slight preference for the Sterling, but the broader sentiment will likely be dictated by how price action evolves around this pivotal level.
The broader market sentiment is being influenced by a divergence in economic signals. Cooling labor market data out of the United States has indeed weighed on the US Dollar, providing a tailwind for pairs like GBP/USD. However, this is being countered by the Bank of England's own economic considerations and its own path forward regarding interest rates. The interplay between these two major central banks' policies is crucial. For instance, if US labor market data continues to soften, it could reduce the odds of further aggressive Fed rate hikes, potentially weakening the dollar further. Conversely, any hints from the Bank of England about a prolonged period of interest rate stability or even potential cuts could cap Sterling's upside, even in a weaker dollar environment. This dynamic creates a complex trading environment where both fundamental drivers and technical levels must be meticulously analyzed.
Looking at the technical indicators, the Relative Strength Index (RSI) on the 1-hour chart is sitting at 57, a reading that suggests a neutral but slightly leaning bullish sentiment. It's not yet in overbought territory, which typically begins above 70, but it does indicate that buyers have had some success in driving the price higher over the recent period. However, the Stochastic Oscillator on the same timeframe presents a contrasting signal, with %K at 21.12 and %D at 54.08, indicating a bearish divergence and suggesting that upward momentum might be waning. This divergence between the RSI and Stochastic is a classic sign of caution, implying that while the price may be holding steady or even drifting slightly higher, the underlying strength might be weakening. This is a scenario where traders need to be particularly vigilant, as it can precede a reversal or a period of consolidation.
The Average Directional Index (ADX) on the 1-hour chart stands at 29, which, according to standard interpretations, signals a strong trend. However, the direction of that trend is what needs clarification, especially given the mixed signals from other oscillators. The ADX itself measures trend strength, not direction. When it's above 25, it generally indicates a trending market, which could be either up or down. The fact that it's at 29 suggests that while there is directional movement, it might not be overwhelmingly strong or committed just yet. This aligns with the price action observed around the $1.3350 level and the 100-day moving average, where the market seems to be in a tug-of-war.
The Dollar's Drift and Sterling's Stance
The US Dollar has been under pressure recently, a key factor influencing the GBP/USD's upward bias. Reports indicating a cooling US labor market have indeed tempered expectations for aggressive Federal Reserve rate hikes. This shift in monetary policy outlook reduces the attractiveness of the dollar as a high-yield currency, prompting some investors to seek opportunities elsewhere. The Dollar Index (DXY), which measures the dollar's strength against a basket of major currencies, has seen its 1-hour trend shift to a 'Düşüş' (Downtrend) with a strength of 88%. This is a significant development, as a weaker dollar typically provides a supportive environment for currency pairs like GBP/USD. The DXY is currently trading around 100.77, and a sustained move below this level could exacerbate dollar weakness, offering further room for Sterling to appreciate.
However, the narrative for the British Pound is not solely dependent on dollar weakness. The Bank of England (BoE) is also a critical player in this equation. While the BoE has been on a tightening path, the pace and extent of future rate hikes are subjects of intense debate among economists and traders. Recent economic data from the UK, such as inflation figures and manufacturing output, will heavily influence the BoE's forward guidance. If the UK economy shows signs of significant slowdown or if inflation proves more persistent than anticipated, it could lead to a divergence in policy expectations compared to the Fed, potentially altering the GBP/USD dynamic. For now, the market seems to be pricing in a more dovish stance from the BoE relative to recent hawkish expectations, which is contributing to the Pound's resilience.
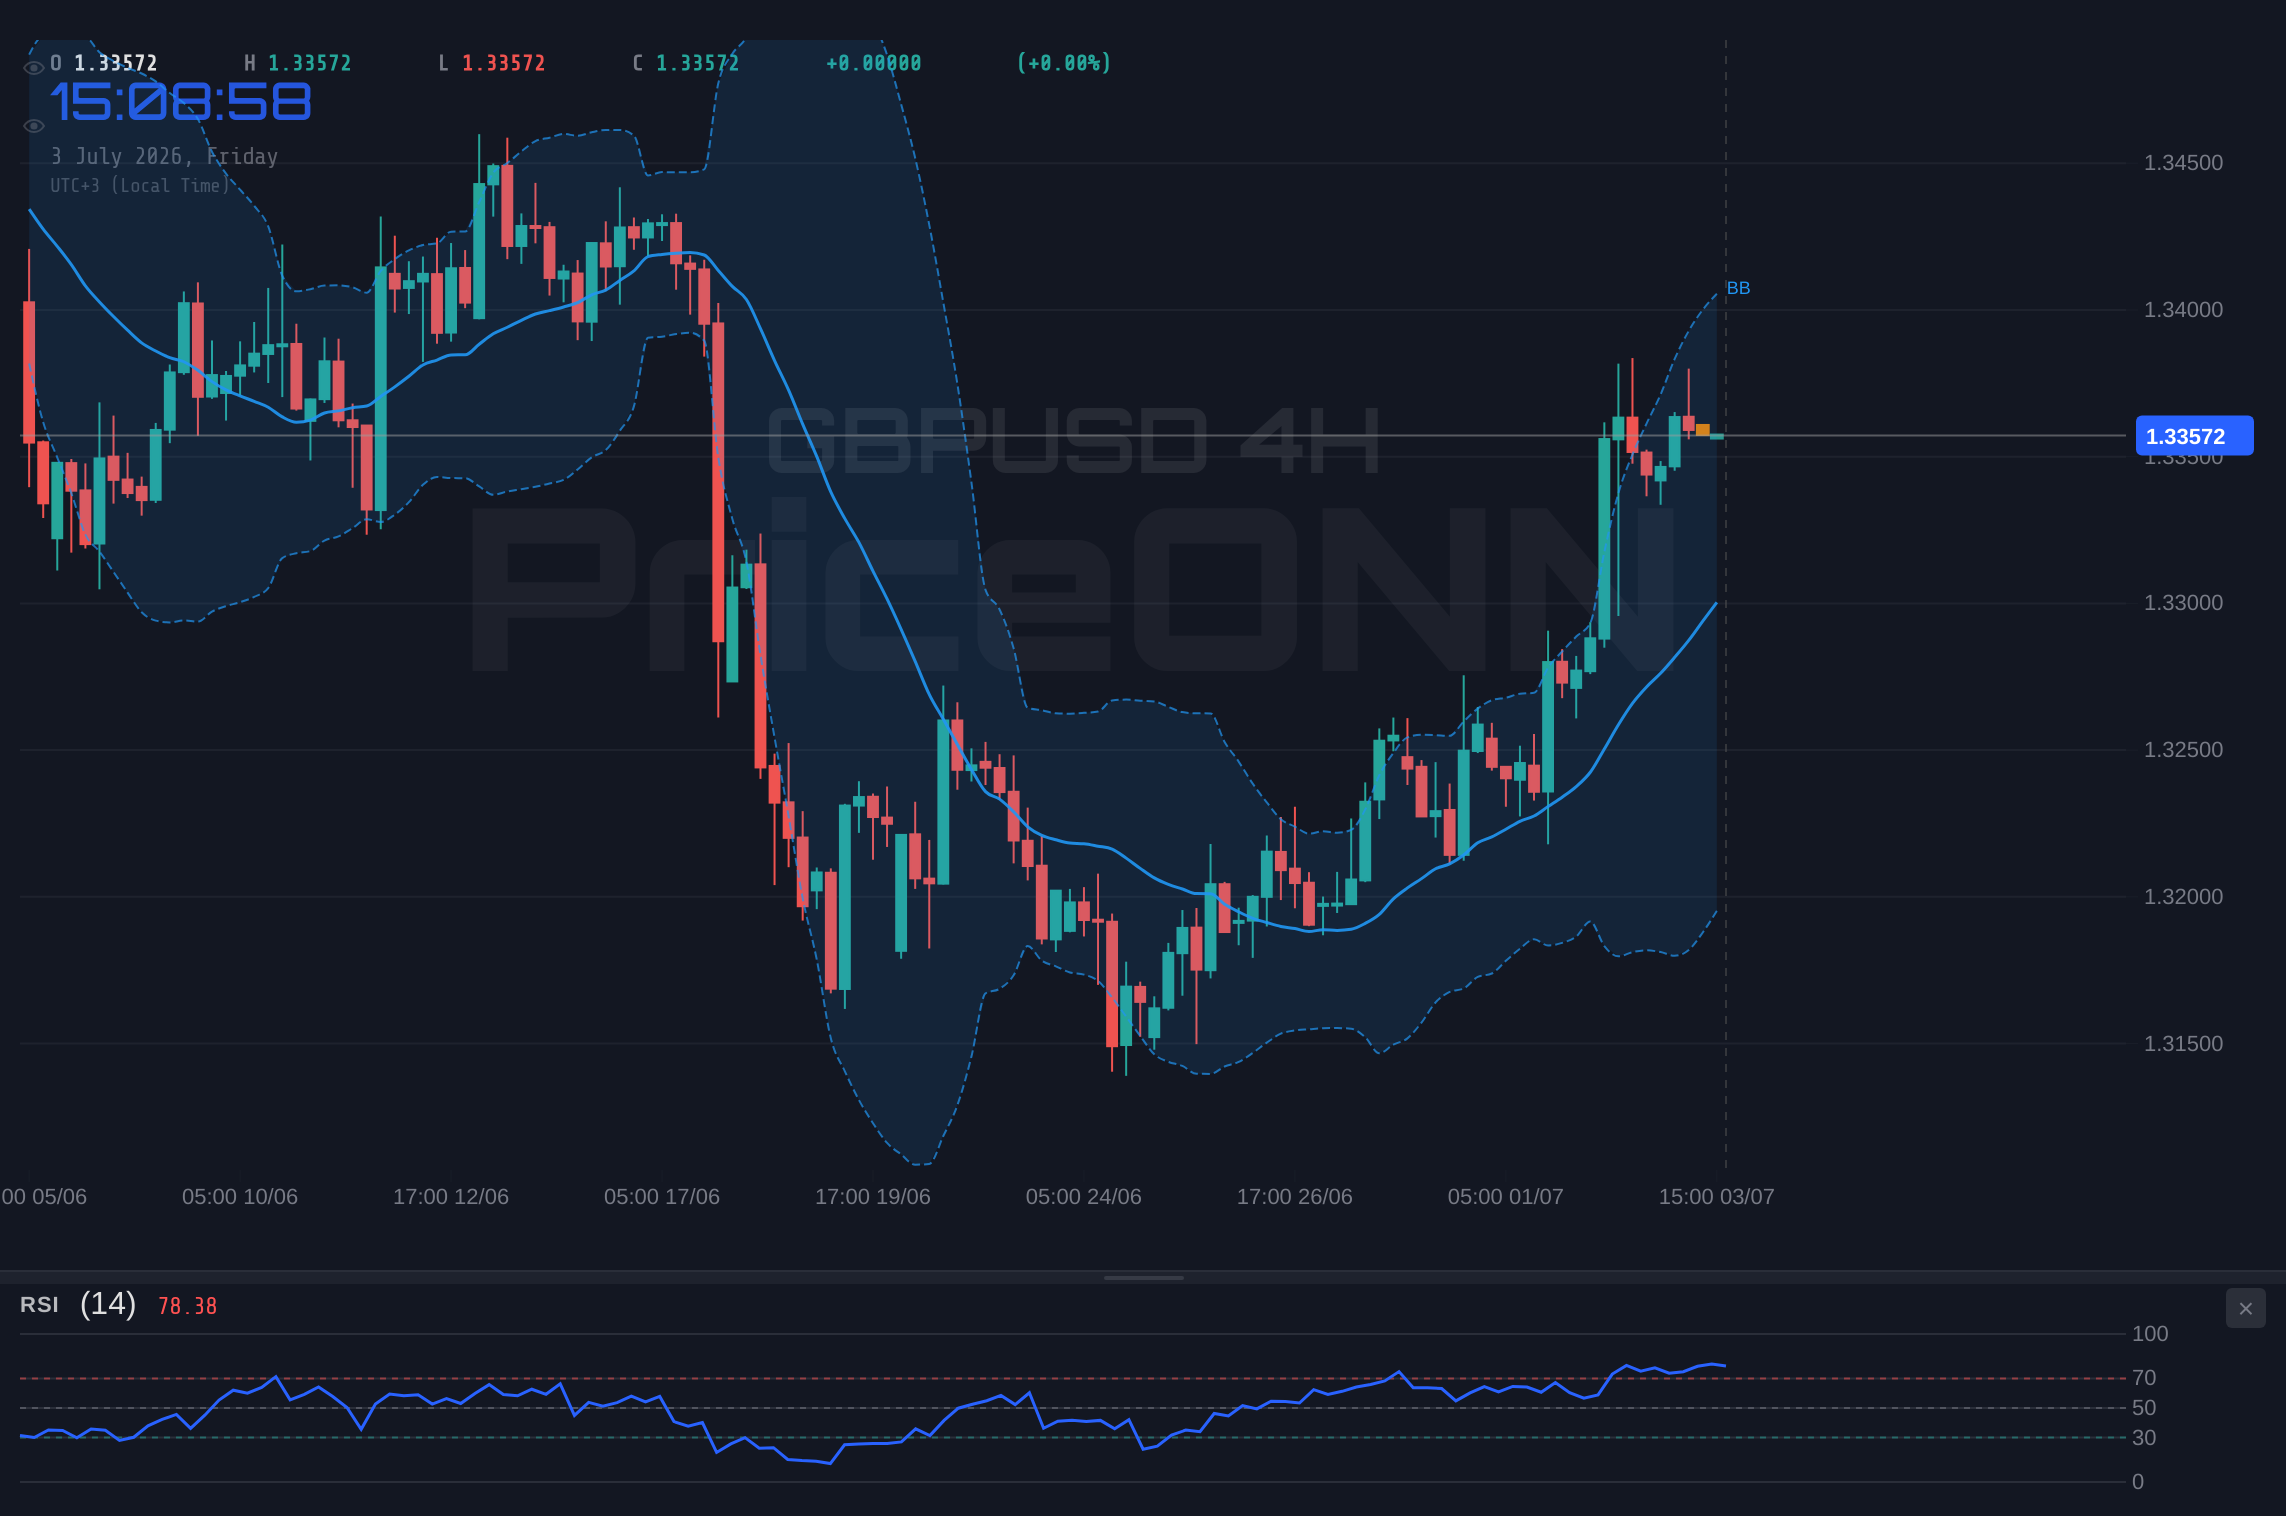
On the 4-hour chart, the picture for GBP/USD is more consistently bullish. The trend is clearly identified as 'Yükseliş' (Uptrend) with a strength of 87%. The RSI(14) at 62.51 is in the neutral zone but clearly trending upwards, indicating that buyers are in control. The MACD indicator on this timeframe shows positive momentum, with the MACD line above its signal line, reinforcing the bullish outlook. The Stochastic Oscillator, however, is flashing a warning sign. With %K at 86.59 and %D at 81.42, it’s firmly in overbought territory, suggesting that the current upward move might be stretched and due for a pause or pullback. This overbought condition, while not an immediate sell signal, warrants caution for aggressive long entries without further confirmation of momentum continuation.
The ADX on the 4-hour chart is at 33.49, confirming a strong uptrend. This suggests that the recent price action is not just random noise but part of a more sustained directional move. However, the combination of a strong uptrend signal from ADX and an overbought Stochastic on the same timeframe creates a scenario of potential exhaustion. It's a common pattern: a strong trend pushes an asset into overbought territory, and then it either consolidates, pulls back, or experiences a sharp reversal. The key for traders is to identify the confirmation signals for each of these outcomes. For instance, a break below the 4-hour middle Bollinger Band would signal a weakening of the uptrend, while a sustained hold above the upper band, coupled with positive MACD momentum, would suggest continuation.
The Daily Chart's Ambiguous Signal
Shifting focus to the daily timeframe for GBP/USD presents a more ambiguous picture, reflecting the broader market's indecision. The trend is labeled as 'Nötr' (Neutral) with a power of 50%, indicating a lack of clear directional conviction over the longer term. The RSI(14) at 47.04 is in the neutral zone and shows a slight downtrend, suggesting that the bears might have a slight edge on this longer timeframe. This contrasts sharply with the shorter timeframes, highlighting the importance of multi-timeframe analysis. The MACD on the daily chart, however, still shows positive momentum with the MACD line above its signal line, which could be interpreted as a lagging indicator still reflecting the recent upward push. This conflict between the RSI and MACD on the daily chart is a classic example of why traders should not rely on a single indicator or timeframe.
The Bollinger Bands on the daily chart are positioned above the middle band, indicating a generally bullish inclination in price placement, but the overall trend strength on this timeframe is questionable. The Stochastic Oscillator on the daily chart, with %K at 63 and %D at 29.72, presents a bullish signal as %K is above %D, suggesting potential for further upside. Yet, the ADX at 40.35 indicates a strong downtrend. This is a significant contradiction: a strong downtrend according to ADX, but bullish signals from Stochastic and MACD momentum. This divergence suggests that the market is in a period of transition or consolidation, where established trends might be losing steam, and new ones have yet to firmly take hold. The key levels to watch on the daily chart are the support at 4054.87 and the resistance at 4167.91 for XAUUSD, and for GBP/USD, the key levels are 1.32753 (Support 1) and 1.33981 (Resistance 1).
The immediate support for GBP/USD on the 1-hour chart is located at 1.33406, followed by 1.33353 and 1.33309. These levels represent areas where buying interest could emerge, potentially halting or reversing a downward move. On the resistance side, the 1-hour chart highlights key levels at 1.33503, 1.33547, and 1.33600. A decisive break and hold above these resistance levels would be necessary to confirm a bullish continuation and potentially target higher ground. The current price action, dancing around the 1.3350 mark, means that these short-term levels are crucial for intraday traders. The battle between buyers and sellers at these precise price points will dictate the immediate direction of the pair.
The 4-hour chart provides slightly more room, with support identified at 1.14346, 1.14238, and 1.14184 for EUR/USD, and resistance at 1.14508, 1.14562, and 1.14670. For GBP/USD, the 4-hour support levels are 1.33507, 1.33380, and 1.33307, while resistance is seen at 1.33707, 1.33780, and 1.33907. These mid-term levels offer a broader perspective on potential turning points. A move towards the 4-hour resistance, for example, would require overcoming the psychological 1.3400 level and then challenging the higher bands. Conversely, a failure to hold the 4-hour support could signal a deeper retracement, potentially testing the daily support levels.
Bearish Scenario: Dollar Strength Returns
35% ProbabilityNeutral Scenario: Range-Bound Consolidation
40% ProbabilityBullish Scenario: Breakout Above Resistance
25% ProbabilityThe Road Ahead: Data Dependency and Strategic Patience
The coming days for GBP/USD will likely be dominated by economic data releases, particularly the US Non-Farm Payrolls (NFP) report. This crucial employment data point has the potential to significantly sway market sentiment regarding the Federal Reserve's monetary policy path. Stronger-than-expected NFP figures could reignite expectations of further Fed tightening, bolstering the US Dollar and potentially pushing GBP/USD lower. Conversely, a weaker report might reinforce the view that the Fed is nearing the end of its hiking cycle, further weakening the dollar and providing support for Sterling. Traders will be dissecting not just the headline NFP number but also average hourly earnings and the unemployment rate for a comprehensive understanding of the US labor market's health.
Beyond US data, attention will remain on the Bank of England's communications and any incoming UK economic indicators. The market is constantly recalibrating its expectations for BoE rate decisions based on inflation trends, wage growth, and overall economic performance. Any surprises in UK inflation or GDP figures could lead to significant volatility in the Pound. The correlation with the DXY will also be a key theme to monitor. As the DXY currently shows a downtrend on the 1-hour chart, this has been a supportive factor for GBP/USD. However, if market sentiment shifts towards risk aversion or if US data prompts a reassessment of Fed policy, the DXY could rebound, putting pressure back on Sterling.
From a technical perspective, the $1.3350 to $1.3370 zone remains a critical battleground. A decisive break and sustained hold above this resistance could open the door for a move towards the 1.3398 daily resistance level, and potentially challenge the 1.3450 psychological mark. On the downside, a failure to hold the current levels could see a retest of the 1.3330 support, with a break below that potentially leading to a move towards the 1.3275 level, a significant support identified on the daily chart. The ADX on the daily chart at 40.35 indicates a strong downtrend, which contradicts the bullish signals from the Stochastic and MACD on the same timeframe, highlighting a market in flux.
The 1-hour chart's RSI at 57 and Stochastic's bearish divergence is a signal for caution. While the overall trend on the 4-hour chart is bullish (ADX 33.49), the overbought Stochastic on that same timeframe suggests that the current rally might be losing steam. This presents a classic dilemma: chase the trend higher, or wait for a pullback to a more favorable entry point? Patience, as always in trading, is key. Waiting for confirmation of a clear breakout above resistance or a bounce from a well-defined support level, especially after crucial economic data, will be crucial for managing risk effectively. The market is offering signals, but it is up to the trader to interpret them within the broader context and execute with discipline.
Frequently Asked Questions: GBPUSD Analysis
What happens if GBP/USD breaks decisively above the 1.3370 resistance level?
A sustained break above 1.3370, especially if accompanied by strong US economic data suggesting a less hawkish Fed, could target the next resistance at 1.3398. This would signal further upside potential towards the 1.3450 psychological level, confirming a bullish continuation.
Should I consider buying GBP/USD at current levels around $1.3350 given the mixed signals?
Buying at current levels requires caution due to conflicting signals like the Stochastic's bearish divergence on the 1-hour chart. A more prudent approach might be to wait for confirmation, such as a clear break above 1.3370 or a bounce from the 1.3330 support level, especially after the NFP data release.
Is the RSI at 57 a sell signal for GBP/USD right now?
An RSI of 57 is considered neutral, leaning slightly bullish, and is not typically a sell signal on its own. It indicates that the bulls have had some recent success but are not yet in full control. A sell signal would usually be considered closer to or above 70, or in conjunction with bearish divergence on other indicators.
How will the upcoming US NFP data impact GBP/USD this week?
Stronger-than-expected NFP data could boost the US Dollar, potentially pushing GBP/USD lower towards support levels like 1.3330 or 1.3300. Conversely, weaker data might weaken the dollar, allowing GBP/USD to test resistance levels like 1.3370 and potentially 1.3398.
| Indicator | Value | Signal | Interpretation |
|---|---|---|---|
| RSI (14) | 57.00 | Neutral | Slightly bullish leaning, not overbought. |
| MACD Histogram | -0.00194 | Bearish | Negative momentum, below signal line. |
| Stochastic (%K/%D) | 21.12 / 54.08 | Bearish | Bearish divergence, potential weakness. |
| ADX | 29.00 | Bullish | Strong trend, direction needs confirmation. |
| Bollinger Bands | Middle Band | Watch | Price below middle band on 1H, above on 4H. |
Track markets in real-time
AI-powered analysis, technical indicators and real-time price data.
Join Our Telegram Channel
Breaking market news, AI analysis and trading signals instantly.
Join Channel