ETHUSD today analysis reveals a critical juncture for the second-largest cryptocurrency, currently trading at precisely $1,604.90. After a notable 2.06% gain on the day, bringing the price from a low of $1550.85 to a high of $1628.87, Ethereum now faces immediate resistance just above its current level. The $1,608.31 mark is proving to be a significant hurdle, and how ETHUSD navigates this zone in the coming hours and days will likely dictate its short-to-medium term trajectory. This price action is unfolding against a backdrop of shifting macroeconomic winds, with the US Dollar Index (DXY) showing strength and equity markets presenting a mixed picture, creating a complex environment for risk assets like cryptocurrencies.
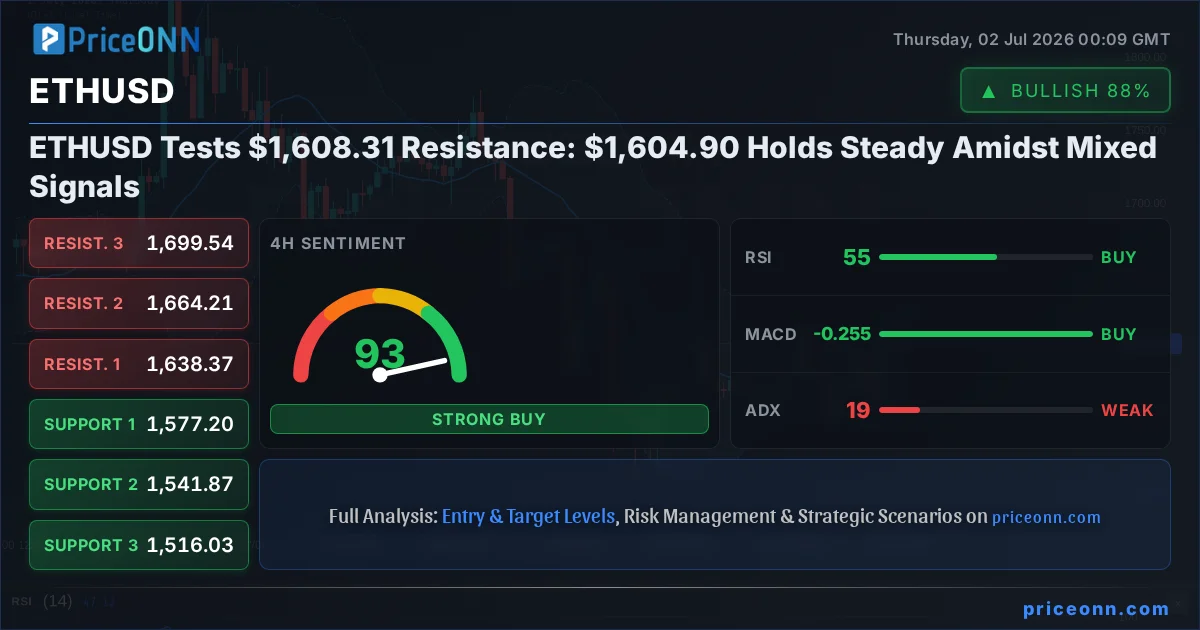
- ETHUSD is currently trading at $1,604.90, with immediate resistance at $1,608.31.
- Key support for ETHUSD is identified at $1,601.88 on the 1-hour chart, with further levels at $1585.34.
- The RSI(14) on the 1-hour chart is at 55, indicating neutral momentum with a slight upward bias, while the 1D RSI sits at 39.73, suggesting a downtrend is still dominant on the daily timeframe.
- Macroeconomic correlations are intensifying, with the DXY strengthening to 101.42, potentially capping crypto gains.
The Bull's Roadmap: Navigating Towards Higher Ground
For bulls to regain control, ETHUSD needs to decisively break and hold above the $1,608.31 resistance. This isn't just a random number; it represents a confluence of short-term resistance levels and a psychological barrier. If buyers can muster enough strength to push ETHUSD through this mark, the next immediate target would be the $1,610.80 level, as indicated by the 1-hour timeframe data. A sustained move above this could then open the door for a test of the $1,636.26 resistance, a significant level on the 4-hour chart. This upward trajectory would be supported by a clear shift in momentum indicators, with the MACD histogram turning more positive and the Stochastic oscillator moving out of its cautionary zone. The ADX on the 1-hour chart, currently at 24.88, suggests that if a breakout occurs, the trend could gain significant strength, potentially pushing prices towards the $1,652.80 and even the $1,661.72 levels within the 1-hour timeframe. This scenario hinges on broader market sentiment turning risk-on, potentially driven by positive economic data or dovish signals from central banks, which would likely see the DXY ease off its current 101.42 level.
The 4-hour chart presents a slightly more optimistic picture for the bulls, with a general 'AL' (Buy) signal and ADX at 18.78, indicating a weaker trend that could be easily swayed by positive momentum. If ETHUSD can consolidate above $1,608.31 and then clear $1,620, the path towards the $1,638.37 resistance on the 4-hour chart becomes more probable. A successful breach here would signal a more robust shift, potentially aiming for the $1,664.21 and $1,699.54 levels in the medium term. This bullish case is further bolstered by the Stochastic oscillator showing a buy signal (%K > %D) on the 4-hour chart, contrasting with the short-term cautionary signal. However, the overall strength of the trend on the 1-day chart remains firmly in the 'Düşüş' (Down) category with a strength of 96%, and an ADX of 31.02, meaning any upward move needs to overcome significant bearish structural headwinds. The RSI(14) on the daily chart at 39.73 also indicates substantial room for improvement before entering overbought territory, but also highlights the distance from oversold conditions that might signal a bottom.
The immediate $1,608.31 resistance is the first major hurdle. A failure to break this level could see a swift reversal, validating the bearish trend on the daily chart. Traders should be wary of false breakouts, especially given the mixed signals across different timeframes.
Where Bears Take Control: The Risk of a Downside Reversal
Conversely, if ETHUSD fails to break above $1,608.31, the bears have a clear path to reassert dominance. The immediate support level to watch on the 1-hour chart is $1,601.88. A break below this level would invalidate the short-term bullish setup and likely trigger a move towards the $1,585.34 support. This bearish scenario is strongly supported by the daily chart's technicals. The 1D RSI at 39.73 suggests further downside potential, and the MACD on the daily timeframe remains in negative momentum territory, with the histogram below the signal line. The ADX on the daily chart at 31.02 confirms a strong downward trend is in play. If $1,585.34 fails, the next significant downside target would be the $1,541.15 level, as per the 1-day data, followed by $1,508.24. This downside continuation would be exacerbated by a strengthening US Dollar Index, currently at 101.42, and a general risk-off sentiment in global markets. The recent news that the US Dollar Index (DXY) strengthened above 101.00 on Fed rate hike bets is a significant headwind for ETHUSD, as a stronger dollar typically correlates with decreased appetite for risk assets.
The 1-hour Stochastic oscillator, currently showing a K=53.49, D=75.77, is already signaling a potential downturn, and a break below $1,601.88 would likely confirm this. The negative momentum on the 1-hour MACD further supports this bearish outlook. While the 4-hour chart offers some conflicting signals with a buy signal and a weaker ADX, the overwhelming bearish trend on the daily timeframe cannot be ignored. The price action of ETHUSD is currently being influenced by broader macroeconomic trends; the cooling inflation in Europe, leading to receding ECB hike bets and a prevailing bearish vibe for EUR/USD near 1.1410, suggests a global trend towards tighter monetary policy or at least less aggressive easing expectations, which tends to pressure risk assets. Furthermore, the Australian Dollar's underperformance against the US dollar, attributed to rallying US Treasury yields prompting a risk-off mood, paints a picture of cautious market participants favoring safe-haven assets over riskier ones. This environment makes a sustained ETHUSD rally challenging without a significant shift in global risk sentiment or a clear catalyst.
The Waiting Game: Consolidation and Uncertainty
Between the clear bullish breakout scenario and the bearish reversal, lies the possibility of consolidation. ETHUSD currently sits at $1,604.90, precariously balanced between the $1,601.88 support and the $1,608.31 resistance. In this scenario, price action might become choppy, with limited directional conviction. This would likely be characterized by fluctuating RSI values around the 50 level on the 1-hour chart, and MACD histograms hovering near zero, indicating a lack of sustained momentum in either direction. The Stochastic oscillator might oscillate between oversold and overbought territory without strong confirmation. The ADX values across timeframes (24.88 on 1H, 18.78 on 4H, 31.02 on 1D) show a mixed picture: strong trend on the daily, weaker on intraday, suggesting a tug-of-war. Such a period of consolidation could be driven by traders awaiting clearer signals from macroeconomic data, such as the upcoming Non-Farm Payrolls (NFP) report, which is a key focus for Silver traders according to some reports, and could set the tone for broader market movements. Until then, ETHUSD might remain range-bound, with volatility potentially increasing around significant news events but failing to establish a sustained trend.
The market sentiment analysis also plays a crucial role here. If institutional investors remain on the sidelines, awaiting confirmation of either a continued uptrend or a significant downtrend, liquidity could dry up, leading to wider price swings within a defined range. The NASDAQ Composite recently finished its second quarter with strong performance, but the narrative is shifting towards needing 'permission from Goldilocks NFP', suggesting that even tech stocks, often correlated with crypto, are in a holding pattern. This cautious approach by major market participants could translate into ETHUSD trading sideways, testing the $1,601.88 support multiple times while failing to decisively break the $1,608.31 resistance. The key to breaking out of this range-bound environment would likely be a significant catalyst, either positive or negative, that provides a clear directional bias and sufficient volume to overcome the current indecision. Without such a catalyst, expect ETHUSD to chop sideways, potentially frustrating short-term traders but offering opportunities for those patient enough to wait for a clearer setup.
The current price action around $1,604.90 reflects a market waiting for direction. Key economic events, particularly US employment figures, are anticipated to provide the necessary catalyst to break this consolidation.
The Most Likely Scenario and What I'm Watching
Considering the multi-timeframe analysis, the most probable scenario in the short-to-medium term appears to be a continuation of the bearish trend established on the daily chart, albeit with potential for intraday bounces or consolidation. The daily timeframe is the most dominant, and its signals - RSI at 39.73, negative MACD momentum, and a strong ADX of 31.02 - strongly suggest that any upward moves are likely to be met with selling pressure, especially as ETHUSD approaches resistance levels like $1,608.31. While the 1-hour and 4-hour charts show some bullish inclinations, these are often short-lived counter-trend moves within a larger downtrend. The probability for a sustained bullish breakout above $1,630 in the immediate short-term (next 24-48 hours) is relatively low, perhaps in the 25-30% range, given the macro headwinds and the daily trend's strength. A consolidation phase between $1,585.34 and $1,620 seems more likely, with a 40-50% probability, until a significant catalyst emerges. The bearish scenario, involving a break below $1,601.88 and a move towards $1,585.34, carries a 25-30% probability in the immediate term, but this probability increases significantly if key support levels fail.
Bearish Re-Test: Downside Momentum Builds
30% ProbabilityRange-Bound Chop: Waiting for Clarity
50% ProbabilityBullish Breakout: Short-Term Relief Rally
20% ProbabilityWhat I'm watching closely this week are several key factors. Firstly, the US Non-Farm Payrolls (NFP) report scheduled for Friday is paramount. This data point will heavily influence Fed policy expectations and, consequently, the DXY and risk assets like ETHUSD. A significantly stronger-than-expected NFP could solidify rate hike bets, boost the dollar, and pressure ETHUSD. Conversely, a weak NFP might signal economic slowdown, potentially leading to a dovish pivot from the Fed and a risk-on rally. Secondly, I'm monitoring ETHUSD's price action around the $1,608.31 resistance and $1,601.88 support levels. A decisive break with confirmation on increased volume will be crucial. Finally, I'll be keeping an eye on the broader crypto market sentiment and any significant shifts in institutional flows, as these can often override technical signals in the short term. The correlation with Bitcoin, currently trading around $59,946, will also be important to track.
Frequently Asked Questions: ETHUSD Analysis
What happens if ETHUSD breaks decisively above the $1,608.31 resistance level?
If ETHUSD breaks and holds above $1,608.31 with strong volume, it could trigger a short-term relief rally. The immediate target would be $1,610.80, followed by $1,636.26, as indicated by the 1-hour and 4-hour charts. This scenario is less probable in the immediate term (20%) due to the dominant daily downtrend.
Should I consider buying ETHUSD at current levels around $1,604.90 given the RSI at 55 on 1H and 39.73 on 1D?
Buying at current levels carries risk due to conflicting signals. The 1-hour RSI at 55 suggests neutral momentum, but the daily RSI at 39.73 indicates a prevailing downtrend. A more prudent approach would be to wait for a confirmed break above $1,608.31 or a retest of support near $1,601.88 with signs of bullish reversal, increasing the probability of success.
Is the current ETHUSD MACD signal a sell signal on the 1-hour chart?
The 1-hour MACD shows negative momentum with the histogram below the signal line, which can be interpreted as a short-term sell signal. However, this conflicts with the overall 'AL' (Buy) signal on the 4-hour chart. Traders should look for confirmation from price action, such as a break below $1,601.88, before acting on this intraday signal.
How will the upcoming US Non-Farm Payrolls (NFP) report affect ETHUSD this week?
The NFP report is a critical catalyst. A strong NFP could boost the DXY to 101.50+, pressuring ETHUSD towards $1,585.34. Conversely, a weak NFP might prompt a risk-on rally, potentially pushing ETHUSD towards $1,636.26, especially if it leads to revised Fed rate expectations.
Technical Outlook Summary
| Indicator | Value | Signal | Interpretation |
|---|---|---|---|
| RSI (14) | 39.73 (1D) | Bearish | Daily downtrend; room to fall. |
| MACD Histogram | -ve (1D) | Bearish | Negative momentum persists on daily. |
| Stochastic | 22.98 / 22.31 (1D) | Bullish (Potential Oversold Bounce) | Daily %K > %D, but still in lower territory. |
| ADX | 31.02 (1D) | Strong Trend | Confirms strong daily downtrend. |
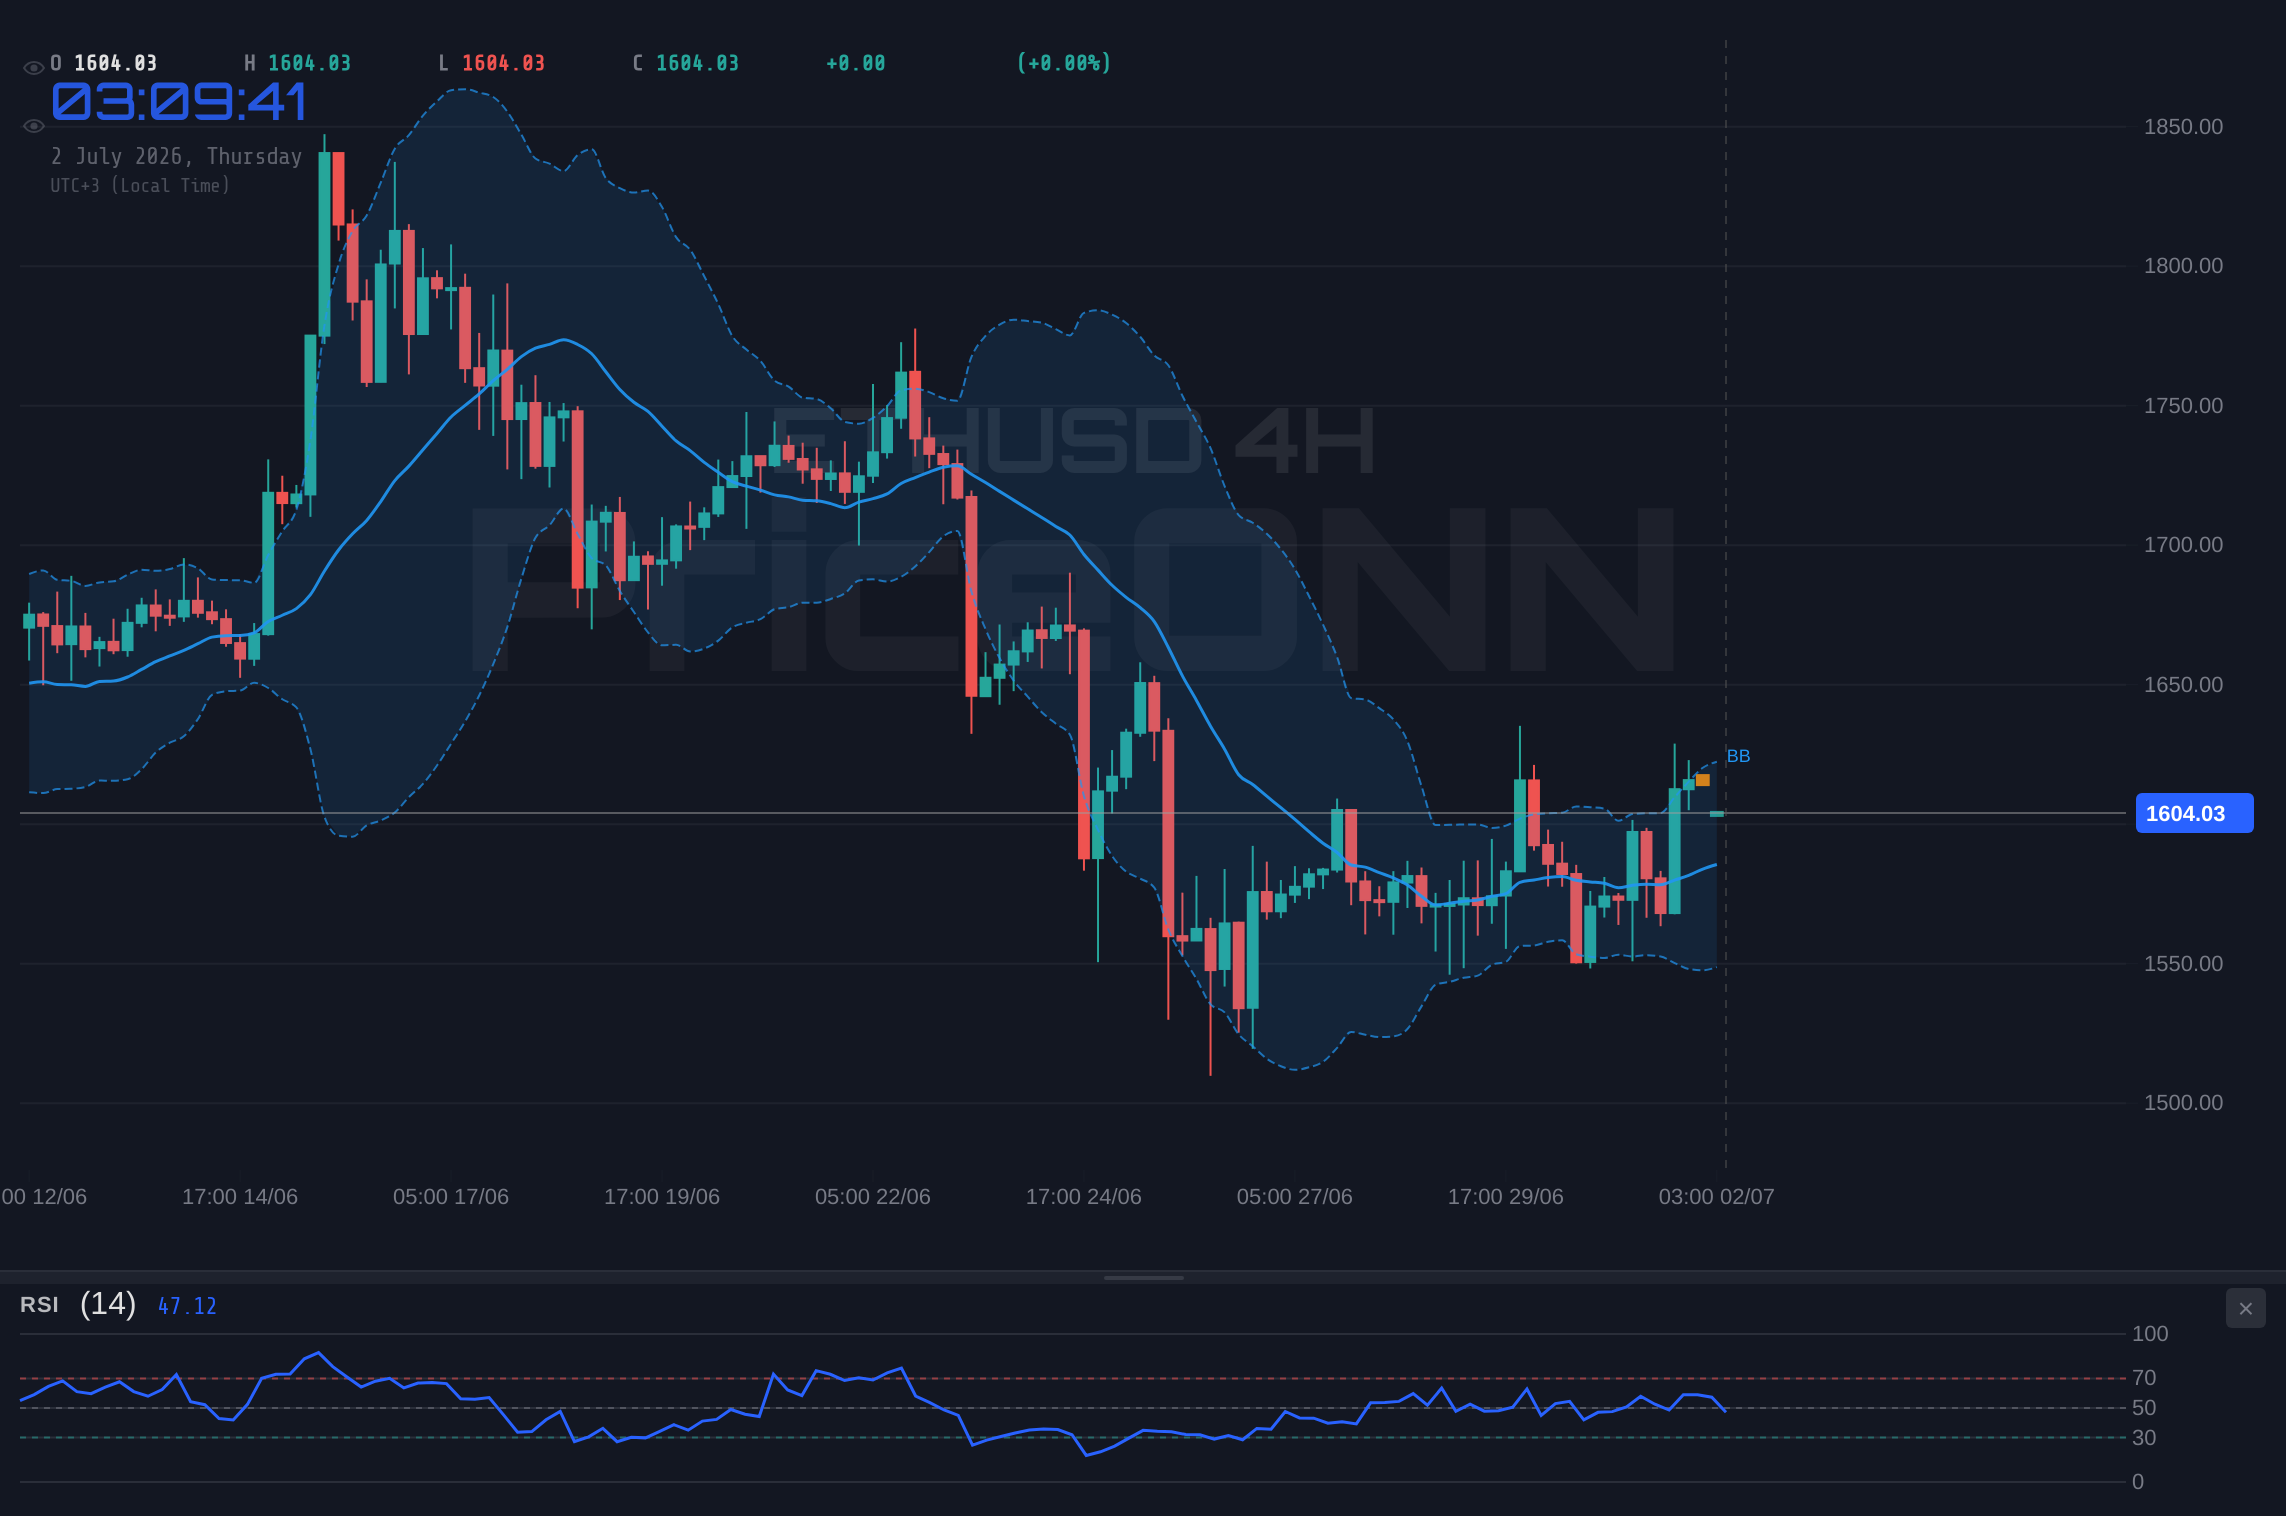
| Bollinger | Middle Band (1D) | Bearish | Price below middle band on daily. |
Key Levels
Track markets in real-time
AI-powered analysis, technical indicators and real-time price data.
Join Our Telegram Channel
Breaking market news, AI analysis and trading signals instantly.
Join Channel