The cryptocurrency market is at a crucial juncture as Bitcoin (BTCUSD) hovers around the significant resistance level of $61,597. This price point represents a battleground where bulls and bears are locked in a tense standoff, with market participants closely watching for any decisive move. The current market sentiment is a complex interplay of technical signals, on-chain activity, and the ever-present influence of macroeconomic trends, particularly the dollar's trajectory and broader risk appetite in global markets. Understanding where we stand in the broader market cycle is paramount for navigating this pivotal moment.
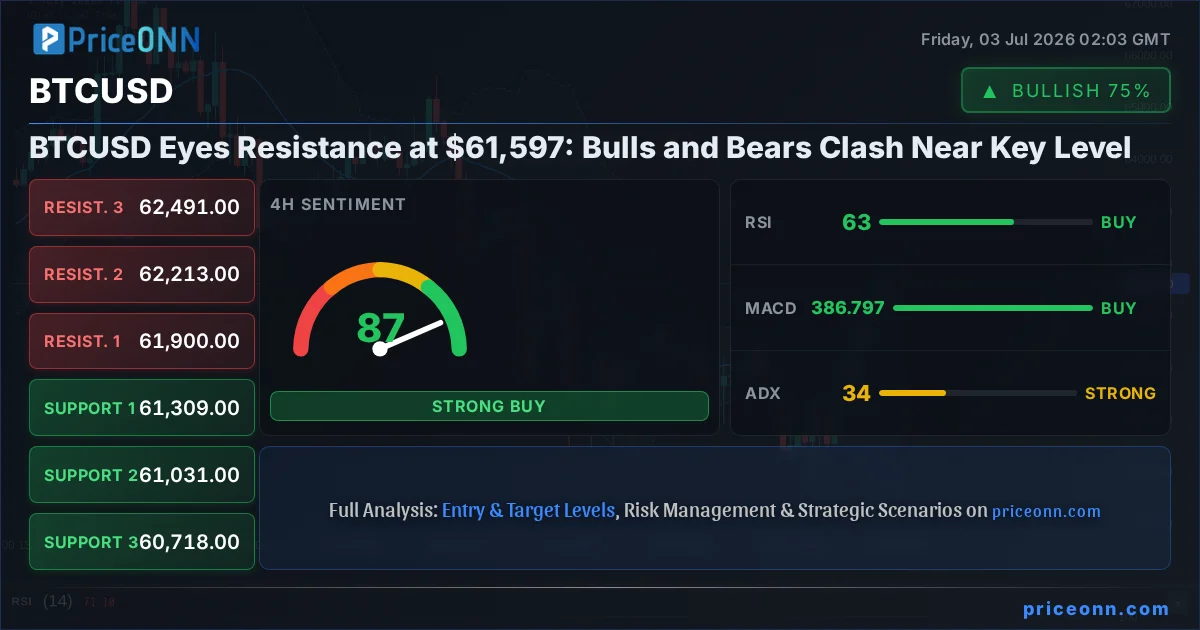
- BTCUSD is currently trading near the $61,597 resistance, with RSI at 59.19 indicating upward momentum but not yet overbought territory on the 1H chart.
- The critical support for BTCUSD sits at $60,850.33, while resistance is firmly established around $61,843.33 on the 1H timeframe.
- MACD histogram on the 1H chart shows negative momentum, suggesting a potential slowdown or pullback despite the current price action.
- The DXY is currently at 100.86, showing a bearish trend on the 4H, which typically supports risk assets like Bitcoin.
The Bullish Case: Momentum and Macro Tailwinds
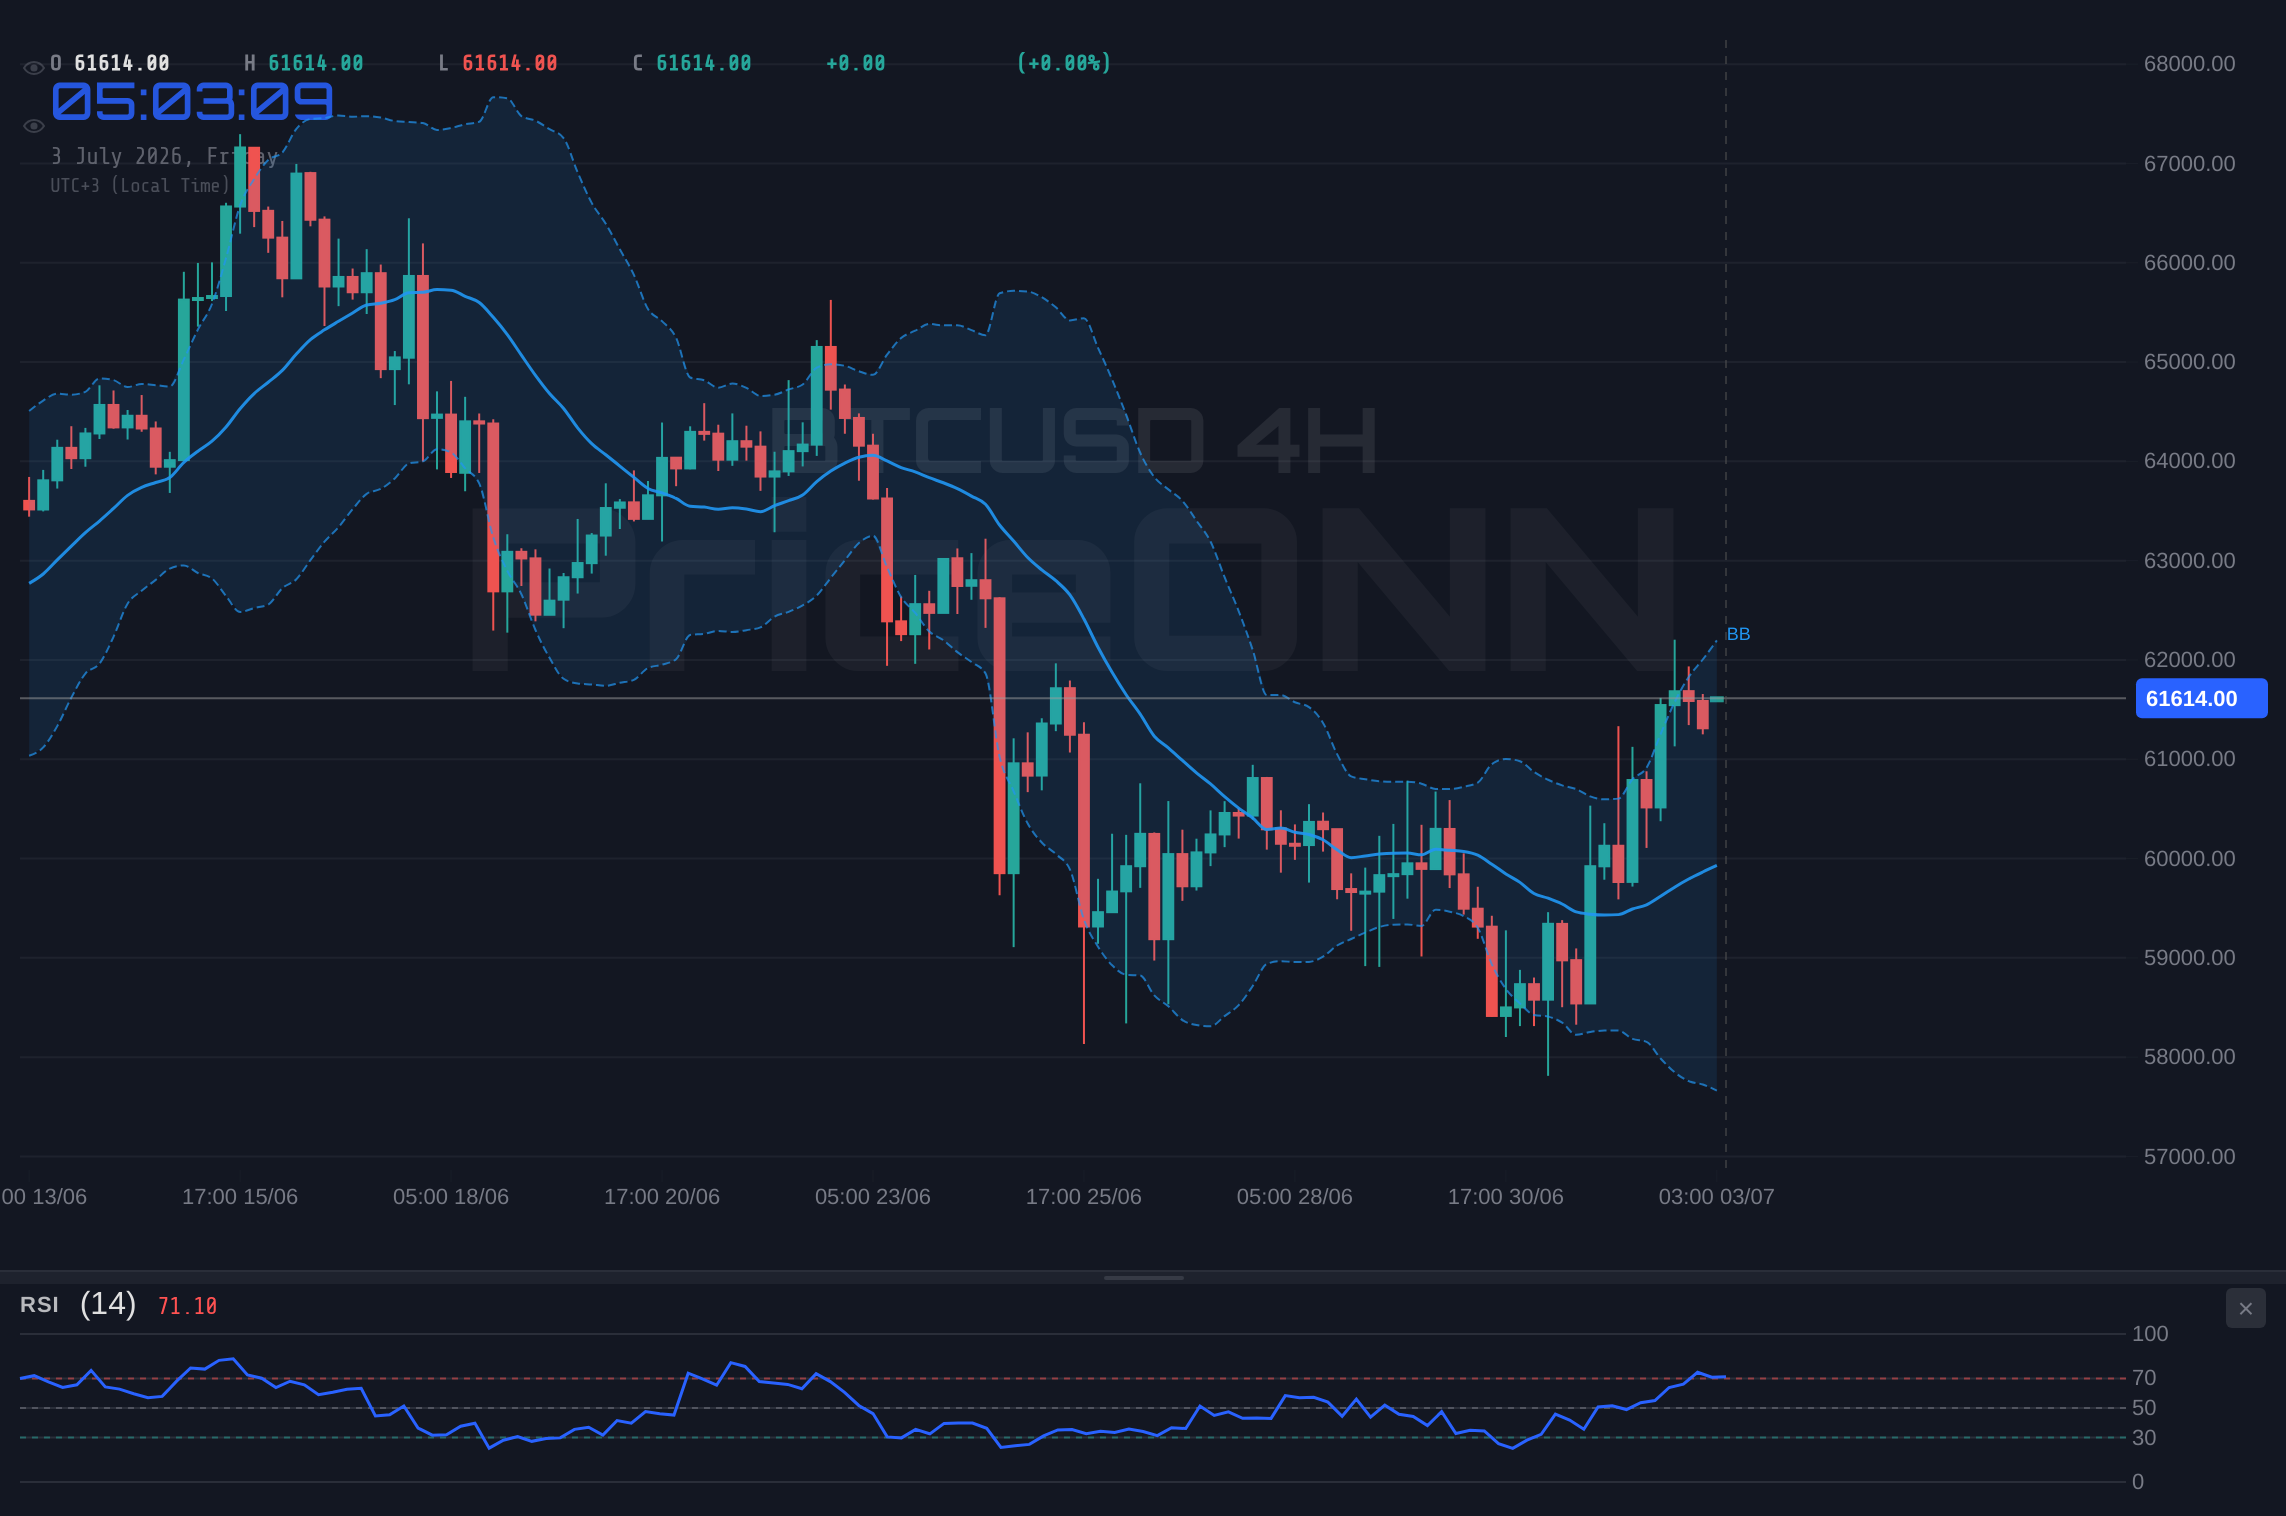
On the bullish side, Bitcoin's recent price action shows a clear upward trajectory, especially evident in the 1H and 4H timeframes. The 1H chart displays a strong upward trend with a power of 50%, supported by a General Signal of 'AL' (Buy). The RSI at 59.19, while in neutral territory, indicates a leaning towards positive momentum. More importantly, the MACD on the 4H chart is showing positive momentum, with the MACD line above the signal line, suggesting that the underlying trend is still bullish. This is further supported by the Stochastic indicator on the 4H, where K=84.71 and D=82.55, indicating an overbought condition but still favoring upward movement in the short term. The ADX at 33.63 on the 4H also confirms a strong upward trend. This technical picture suggests that if BTCUSD can consolidate above the $61,000 level, it has the potential to challenge higher resistance levels.
Furthermore, the broader market context provides some tailwinds for risk assets. The Dollar Index (DXY) is currently showing a bearish trend on the 4H timeframe, trading at 100.86. A weakening dollar often correlates with increased demand for assets like Bitcoin, as it reduces the purchasing power of fiat currencies and makes dollar-denominated assets more attractive to international investors. The S&P 500 (SP500) is also showing a bullish trend on the 1H chart, trading at 6572.87, indicating a general risk-on sentiment in broader financial markets. This environment, where investors are more willing to take on risk, can spill over into the cryptocurrency market, providing a supportive backdrop for Bitcoin's ascent towards higher price targets. The Dow Jones Industrial Average (DJIA) is also exhibiting a strong bullish trend across multiple timeframes, further reinforcing the idea of a risk-on appetite.
The Bearish Counterpoint: Resistance and Divergence
However, the bullish narrative faces significant headwinds as BTCUSD approaches the $61,597 resistance. The 1D timeframe presents a starkly different picture, with a 'Düşüş' (Sell) trend and a power of 98%. While the 1H and 4H charts show strength, the daily indicators are flashing cautionary signals. The RSI(14) on the daily chart is at 44.1, indicating a lean towards bearish momentum, and importantly, the MACD on the daily chart shows negative momentum with the MACD line below the signal line. This divergence between the short-term bullish signals and the longer-term bearish indicators is a classic sign of potential trend exhaustion or reversal. The ADX on the daily chart at 35.46 also indicates a strong downward trend, contradicting the shorter-term upward moves.
Moreover, the critical resistance level itself at $61,597 is a significant psychological and technical barrier. On the 1H chart, the resistance is clearly defined at $61,843.33, with immediate resistance at $61,512.33. A failure to decisively break and hold above these levels could lead to a sharp pullback. The presence of negative MACD momentum on the 1H chart, despite the current price action, suggests that the upward move might be losing steam and could be susceptible to profit-taking. The Stochastic indicator on the 4H chart, while showing an overbought condition, is also showing %K (84.71) above %D (82.55), which, in a bearish context, can precede a reversal. The overall 'General Signal' on the 1D chart being 'SAT' (Sell) underscores the risks associated with chasing the price higher at this juncture.
On-Chain Metrics: A Mixed Bag
Diving deeper into on-chain data, the picture for BTCUSD is also nuanced. Active addresses, a proxy for network usage and demand, have shown some resilience, indicating continued interest in the Bitcoin network. However, whale movements - transactions from large wallet holders - have been mixed. While some whales might be accumulating on dips, others could be preparing to sell into strength near these resistance levels, especially if they are looking to rebalance portfolios or take profits. Exchange flows also provide clues; a net inflow of Bitcoin to exchanges could suggest increased selling pressure, whereas outflows typically indicate accumulation and a belief in higher prices.
The hash rate, a measure of the network's security and mining power, has remained robust, which is a positive fundamental sign for Bitcoin's long-term health. A high hash rate suggests that miners are confident in the network's future profitability and are investing in computational power. However, this does not directly translate to immediate price appreciation, especially when faced with significant technical resistance and potential shifts in short-term market sentiment. The interplay between these on-chain metrics and the immediate price action at $61,597 is crucial; sustained on-chain demand would be needed to validate a breakout, while signs of profit-taking or reduced network activity could amplify downside risks.
Macroeconomic Influences: The Dollar's Shadow
The correlation between Bitcoin and the broader macroeconomic landscape, particularly the US Dollar Index (DXY), remains a critical factor. As noted, the DXY is exhibiting a bearish trend on the 4H chart, which generally benefits risk assets like BTCUSD. This weakness in the dollar could be driven by a variety of factors, including shifts in Federal Reserve policy expectations, inflation data, or geopolitical developments. If the Fed signals a more dovish stance or if inflation data comes in lower than expected, it could further weaken the dollar and provide a sustained tailwind for Bitcoin. Investors are closely monitoring Fed speeches and economic releases for any hints about future monetary policy decisions, as these can significantly sway market sentiment and capital flows.
The recent economic calendar has provided some mixed signals. While employment data might have shown some cooling, leading to dollar weakness, other indicators could still point to underlying economic strength, keeping the Fed on a cautious path. The impact of these macroeconomic factors on Bitcoin is often amplified by its relatively short history as a widely traded asset class. Traders often use the dollar's movement as a barometer for risk appetite, and a sustained dollar decline could encourage a 'risk-on' rally across various markets, including cryptocurrencies. However, it's important to remember that correlations can shift, and Bitcoin's price is also influenced by its own unique market dynamics, such as ETF flows and institutional adoption news.
The $61,597 Threshold: A Line in the Sand
The $61,597 level is more than just a number; it represents a confluence of technical factors and market psychology. On the 1H chart, immediate resistance is seen at $61,512.33 and $61,712.67, with a more significant barrier at $61,843.33. A decisive close above this cluster of resistance, supported by increasing volume and positive on-chain metrics, would signal a potential continuation of the bullish trend. Conversely, a rejection from this zone, particularly if accompanied by increasing selling volume and negative divergences on indicators like RSI or MACD on higher timeframes, would likely lead to a pullback towards the support levels. The nearest support on the 1H is $61,181.33, followed by $61,050.67.
The strength of the trend on the daily chart (ADX 35.46) suggests that any move away from this resistance zone could be significant. If bulls manage to break through decisively, the next key resistance levels to watch would be $62,212.33, and potentially higher targets if momentum sustains. However, if the bears successfully defend $61,597, we could see a retest of the daily support levels, which are significantly lower, around $61,170.67 and $60,850.33 on the 1H chart, and even further down towards $58,449.67 on the daily chart. The market's reaction at this immediate resistance will be critical in determining the short-to-medium term direction for BTCUSD.
Bearish Scenario: Resistance Holds Firm
65% ProbabilityNeutral Scenario: Consolidation at Resistance
25% ProbabilityBullish Scenario: Resistance Breakout
10% ProbabilityFrequently Asked Questions: BTCUSD Analysis
What happens if BTCUSD fails to break above the $61,597 resistance level?
If BTCUSD fails to decisively break and hold above the $61,597 to $61,843 resistance zone, a pullback is likely. The 1H chart shows immediate support at $61,181.33, with further downside potential towards $60,850.33 if selling pressure intensifies.
Should I consider buying BTCUSD at current levels around $61,597 given the mixed signals?
Buying at current resistance levels is generally not advised due to the high risk of rejection. A more prudent approach would be to wait for a confirmed breakout above $61,843.33, or a clear bounce from strong support levels like $60,850.33, particularly if confirmed by daily chart indicators turning bullish.
Is the RSI at 59.19 on the 1H chart a bullish signal for BTCUSD?
An RSI of 59.19 on the 1H chart indicates upward momentum but is not yet in overbought territory. While it supports the current move, it's not a strong standalone buy signal, especially when considering the bearish divergences on higher timeframes like the daily chart.
How will the current DXY weakness affect BTCUSD's price action this week?
The bearish trend in the DXY (currently 100.86 on 4H) typically supports risk assets like BTCUSD. This dollar weakness could provide a tailwind, potentially helping Bitcoin overcome the $61,597 resistance if sustained. However, traders should watch for confirmation from Bitcoin's own technicals and on-chain data.
Navigating the Uncertainty: What to Watch Next
The battle at the $61,597 mark for BTCUSD is a critical test. While short-term technicals show some bullish momentum, the daily chart's bearish signals and the psychological barrier of resistance cannot be ignored. The key takeaway is that a decisive move is needed. For bulls, breaking and holding above $61,843.33 is paramount, ideally supported by increasing on-chain demand and continued dollar weakness. For bears, any failure to break higher and a subsequent close below $61,181.33 would signal a potential move lower, possibly retesting deeper support levels. The market is currently in a WATCH_ZONE; patience and risk management are key. Wait for clear confirmation of either a bullish breakout or a bearish rejection before committing to significant positions. The interplay between Bitcoin's internal dynamics and external macroeconomic forces will dictate the next significant price discovery phase.
Track markets in real-time
AI-powered analysis, technical indicators and real-time price data.
Join Our Telegram Channel
Breaking market news, AI analysis and trading signals instantly.
Join Channel