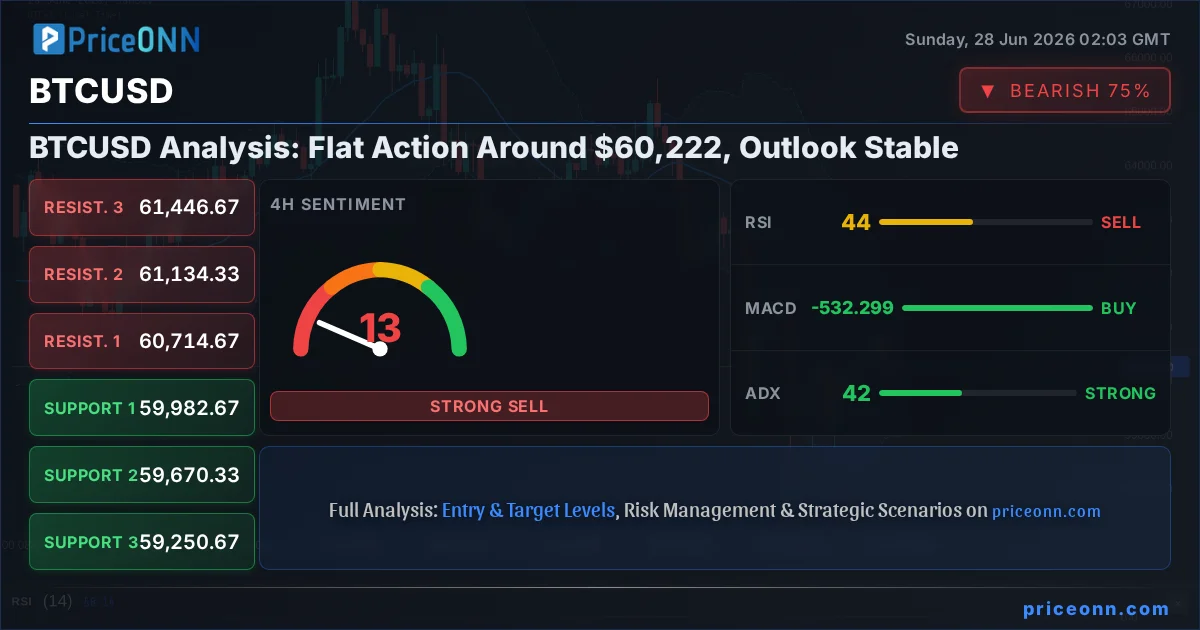
The cryptocurrency market is in a peculiar state of equilibrium, with Bitcoin (BTCUSD) currently hovering around the $60,222 mark. This price point, while seemingly stable, belies a complex interplay of technical signals and underlying market sentiment. For weeks, BTCUSD has been consolidating, failing to muster the conviction for a decisive move in either direction. This 'flat action' isn't necessarily a sign of weakness, but rather a period of digestion and indecision, where both bulls and bears seem hesitant to commit significant capital. The current price action around $60,222 is a critical juncture, a battleground where short-term traders might be looking for quick wins while longer-term investors assess the broader macroeconomic landscape and on-chain metrics for clues about the next major trend. Understanding this delicate balance is paramount for navigating the current market conditions, as any sustained move away from this consolidation zone could signal the beginning of a new market phase.
- BTCUSD's RSI at 48.19 on the 1H chart signals neutral momentum, but a slight downward trend is present, indicating potential for further consolidation or a minor dip.
- Critical support for BTCUSD sits at $59,670.67, a level that has acted as a floor multiple times this week and requires close observation for any potential breakdown.
- The MACD histogram on the 1H chart shows negative momentum, suggesting that downward pressure is currently outweighing upward momentum, though the trend strength is weak (ADX 11.48).
- Fed rate expectations, influenced by recent stable labor market data and cooling inflation reports, are indirectly impacting BTCUSD through their effect on the DXY and broader risk appetite.
Navigating the Consolidation Zone: BTCUSD at $60,222
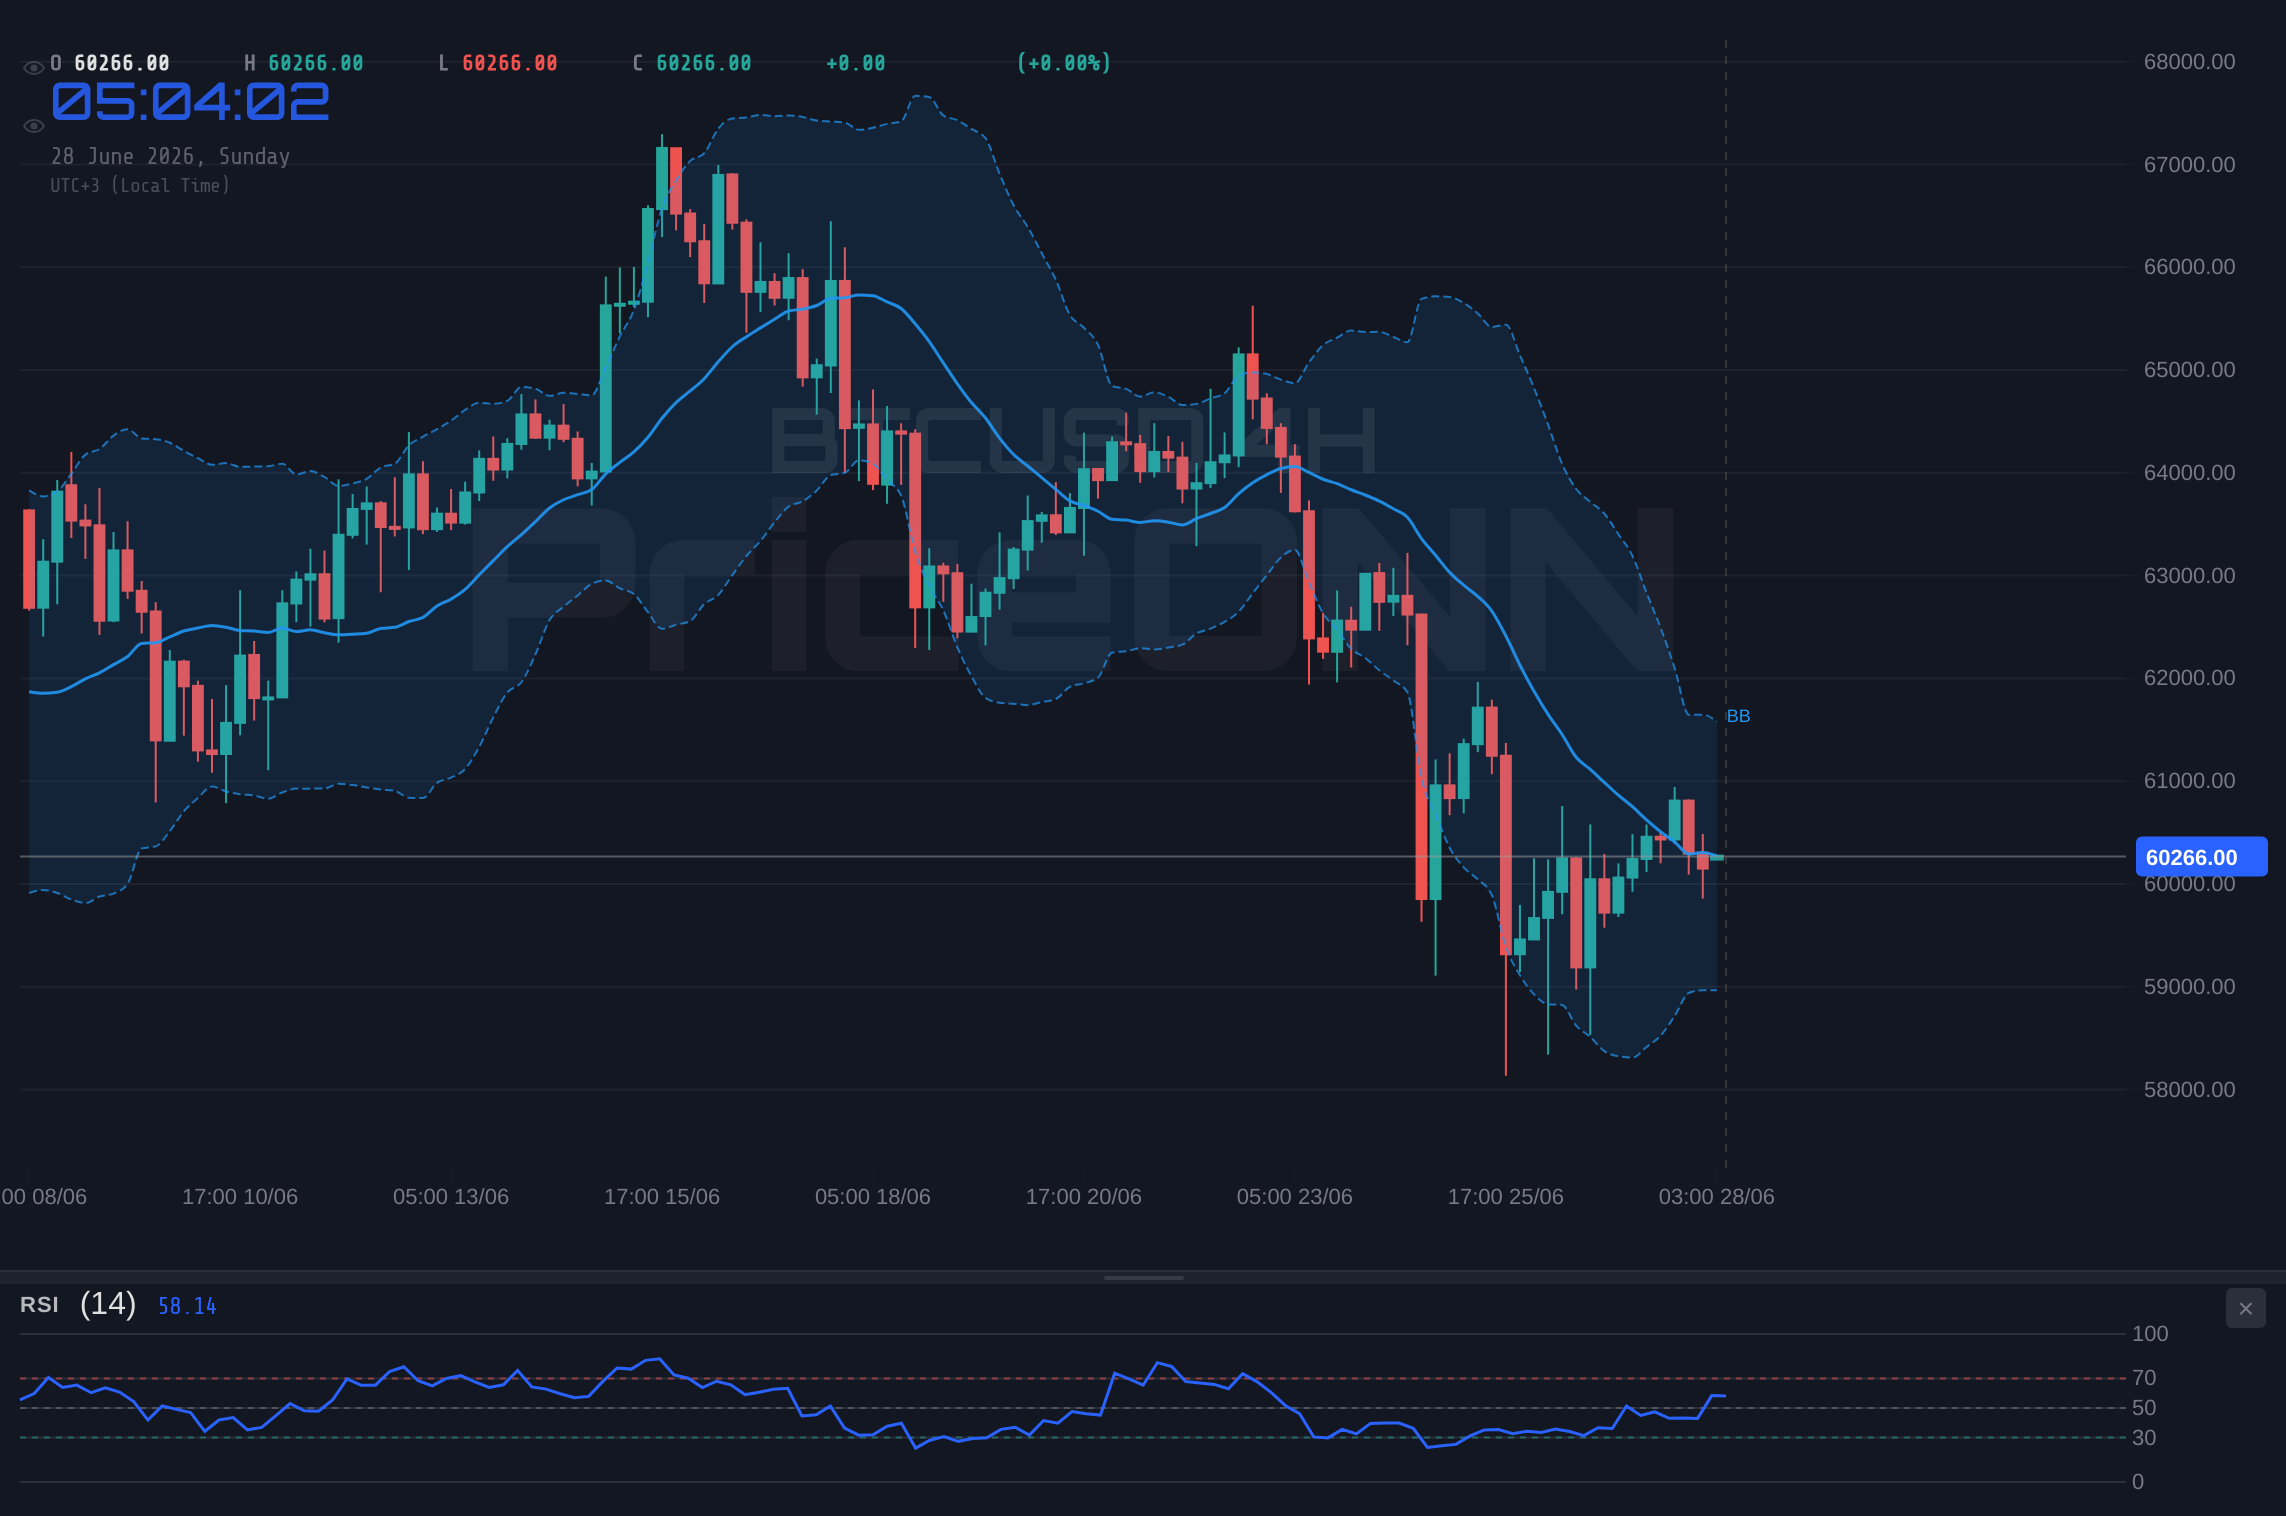
The $60,222 level for Bitcoin is more than just a number; it represents a significant psychological and technical barrier that has dictated market sentiment for the past few weeks. This period of consolidation, characterized by a lack of decisive price action, is a common phenomenon in financial markets after periods of significant volatility. Following the sharp rallies and subsequent pullbacks, traders and investors often take a pause, reassessing their positions and waiting for clearer signals. The current price range, roughly between $59,670.67 (support) and $60,398.67 (resistance) on the 1-hour chart, highlights this indecision. The market is effectively stuck in a tug-of-war, with neither the bulls nor the bears able to establish a firm grip. This equilibrium, however, is inherently unstable. When a prolonged period of consolidation occurs, the eventual breakout tends to be more forceful, as pent-up energy is released. The question on everyone's mind is: which direction will that breakout favor?
From a multi-timeframe perspective, the picture becomes even more nuanced. While the 1-hour chart shows a neutral trend with weak momentum (ADX at 11.48), the 4-hour chart presents a more challenging scenario. Here, the trend is also neutral, but the ADX at 41.69 indicates a stronger underlying trend, albeit one that is currently lacking clear direction. The RSI(14) on the 4-hour chart sits at 43.69, leaning towards oversold territory and suggesting that sellers might be getting exhausted, but not yet signaling a clear buying opportunity. The Stochastic Oscillator, with %K at 79.22 and %D at 78.94, is in overbought territory, hinting at a potential pullback or at least a pause in upward momentum, even as the overall signal leans bullish. This divergence across timeframes is typical during consolidation phases and underscores the need for a patient, data-driven approach. Scalpers might look for short-term plays within the range, while swing traders and longer-term investors will be waiting for a clear break above resistance or a decisive drop below support to confirm the next directional bias.
Technical Indicators: A Mixed Bag of Signals
Delving deeper into the technical indicators, the narrative of indecision becomes clearer. On the 1-hour chart, the Relative Strength Index (RSI) at 48.19 is firmly in neutral territory, neither indicating overbought nor oversold conditions, but showing a slight downward inclination. This suggests a mild bearish bias in the very short term, a sentiment echoed by the negative momentum on the Moving Average Convergence Divergence (MACD) histogram. However, the MACD line remains above its signal line, indicating that while momentum is softening, there isn't a strong selling signal yet. The Bollinger Bands are trading below the middle band, which typically suggests a bearish bias or a period of low volatility preceding a move. The Stochastic Oscillator, with %K at 27.69 and %D at 24.04, is moving out of oversold territory and showing a potential bullish crossover, which contradicts the RSI and MACD signals. This conflict between indicators is precisely why the market is struggling to find direction. The Average Directional Index (ADX) at 11.48 confirms the lack of a strong trend on this timeframe, suggesting that any moves might be short-lived unless a significant catalyst emerges.
Shifting to the 4-hour timeframe, the indicators offer a slightly different perspective, though still leaning towards caution. The RSI(14) at 43.69 is still in neutral territory but trending downwards, reinforcing the idea that sellers are still present. The MACD, however, shows positive momentum on this timeframe, with the MACD line above its signal line, indicating a potential shift towards bullishness or at least a stabilization. This is a significant divergence from the 1-hour chart. The Stochastic Oscillator is in overbought territory (%K: 79.22, %D: 78.94), suggesting a potential reversal or at least a pause, but the fact that %K is still above %D indicates that the upward pressure, however slight, is still dominant in the short term. The ADX at 41.69 on the 4-hour chart is notably higher than on the 1-hour, indicating a stronger underlying trend, even if it's not clearly defined in terms of direction. This suggests that when a breakout does occur, it might be more significant. The Bollinger Bands are trading below the middle band, which typically indicates bearish pressure, but in a consolidation phase, it can also signal that the price is coiling before a potential move.
The daily chart paints an even more subdued picture, dominated by the extended consolidation. The RSI(14) at 33.27 is approaching oversold territory, a level that historically has preceded periods of price recovery for Bitcoin. This is a more encouraging sign for long-term holders, suggesting that the selling pressure might be waning. The MACD on the daily chart is negative, with the MACD line below its signal line, confirming the bearish momentum that has characterized the broader trend over recent weeks. However, the histogram is narrowing, which could indicate that the bearish momentum is losing steam. The Stochastic Oscillator (%K: 21.68, %D: 24.62) is also in oversold territory, reinforcing the RSI's suggestion of potential buyer interest emerging at these lower levels. The ADX at 33.99 still indicates a strong trend, but its directionality is less clear on this longer timeframe, suggesting that the dominant trend might be shifting or consolidating. The Bollinger Bands are below the middle band, a classic bearish signal, but in the context of an oversold RSI and Stochastic, it might represent an opportunity for a rebound rather than a continuation of the downtrend.
The Macroeconomic Undercurrent: DXY, Rates, and Risk Appetite
While Bitcoin often trades with a degree of independence, its price action is undeniably influenced by the broader macroeconomic environment. The US Dollar Index (DXY), a key barometer of global risk appetite, is currently trading at 101.34, showing a slight dip on the 1-hour and 4-hour charts, but maintaining a strong upward trend on the daily timeframe (ADX 40.81). A strengthening dollar typically exerts downward pressure on risk assets like Bitcoin, as it makes dollar-denominated assets more expensive for holders of other currencies and can signal a 'risk-off' sentiment in global markets. The recent stable labor market conditions and cooling inflation figures, as indicated by the latest economic reports, are leading to fading expectations of further Federal Reserve rate hikes. This uncertainty about the Fed's next move creates a mixed signal for the DXY. While a pause in rate hikes might eventually benefit risk assets, the current strength of the dollar, driven by global uncertainty and higher yields compared to other major economies, continues to be a headwind for BTCUSD. The correlation between BTCUSD and the DXY, while not always perfect, is a critical factor to monitor. A sustained move lower in the DXY, especially if accompanied by a clear dovish pivot from the Fed, could provide a significant tailwind for Bitcoin.
The bond market, particularly US Treasury yields, also plays a crucial role. While specific yield data isn't provided in the live feed, the general expectation of a Fed pause suggests that yields might have peaked or are nearing their peak. Lower or stable yields can make riskier assets like Bitcoin relatively more attractive by reducing the opportunity cost of holding them. Conversely, if inflation proves more persistent than expected and forces the Fed to maintain a hawkish stance, yields could rise, putting pressure on Bitcoin. The current market seems to be pricing in a 'soft landing' scenario, where inflation cools without triggering a severe recession, which would be conducive to risk assets. However, any data that deviates from this expectation could trigger significant market volatility. The correlation between Bitcoin and tech stocks, particularly the Nasdaq 100 (currently showing a strong downtrend on the 4H and 1D charts), also provides insight. A continued sell-off in equities, driven by macroeconomic concerns or sector-specific issues (like the AI boom potentially losing power, as noted in recent news), could spill over into the crypto market, increasing selling pressure on BTCUSD.
Energy prices, like Brent crude oil (currently in a strong downtrend on the 4H and 1D charts), serve as another inflation barometer. Declining oil prices can ease inflationary pressures, supporting the narrative of a Fed pause and potentially benefiting risk assets. However, geopolitical tensions in energy-producing regions could quickly reverse this trend, reigniting inflation fears and prompting a flight to safety, which would likely hurt BTCUSD. The current downward pressure on oil prices suggests that global demand might be softening or that supply-side concerns are temporarily abating. This adds another layer to the complex macroeconomic puzzle that influences Bitcoin's price. For traders, monitoring these correlated assets - the DXY, Treasury yields (implicitly), equity indices, and oil prices - provides a more holistic view of the market forces at play, helping to contextualize BTCUSD's price action beyond its own technical indicators.
Correlation Analysis: The Interconnectedness of Markets
The price of Bitcoin does not exist in a vacuum. Its movements are increasingly intertwined with traditional financial markets, making a comprehensive correlation analysis essential for any serious trader. Currently, the US Dollar Index (DXY) is a primary focus. With the DXY showing signs of a potential pullback on shorter timeframes (1H, 4H) but maintaining a strong uptrend on the daily, its influence is mixed but significant. A rising DXY at 101.34 generally correlates negatively with BTCUSD, suggesting that as the dollar strengthens, Bitcoin tends to face headwinds. Traders are closely watching if the DXY can sustain its daily uptrend or if the shorter-term weakness signals a broader reversal, which could offer a reprieve for risk assets. The strength of the dollar is often a reflection of global economic health and monetary policy expectations, making it a crucial indicator for Bitcoin's potential trajectory.
Equity markets present another vital correlation. The S&P 500 (SP500) is showing a mixed picture, with a strong uptrend on the 1H chart (RSI 70.95, signaling overbought conditions) but a bearish trend on the daily chart (RSI 45.35). The Nasdaq 100, heavily weighted towards tech, is exhibiting a more pronounced downtrend, especially on the 4H and 1D charts, with RSI values in the mid-30s. This divergence between the S&P 500's short-term strength and the Nasdaq's longer-term weakness suggests underlying fragility in the tech sector, which has historically been a strong driver for Bitcoin's rallies. If the Nasdaq's downtrend accelerates, it's highly probable that BTCUSD will experience increased selling pressure, despite its own technical indicators potentially flashing buy signals on shorter timeframes. This inverse correlation highlights the sensitivity of Bitcoin to broader market sentiment and risk appetite, particularly within the growth-oriented tech sector.
Energy prices, specifically Brent crude, offer insights into inflation expectations and geopolitical stability. Brent's downtrend on the 4H and 1D charts, with RSI in the high 30s and Stochastic in oversold territory, suggests that energy markets are not currently signaling rampant inflation or acute geopolitical supply shocks. This can be interpreted as a neutral to slightly positive factor for risk assets like Bitcoin, as it reduces the immediate pressure on central banks to aggressively combat inflation through rate hikes. However, the geopolitical landscape remains volatile, and any sudden escalation in global conflicts could quickly reverse this trend, leading to a surge in oil prices, a spike in inflation fears, and a subsequent flight to safety, potentially impacting BTCUSD negatively. The current subdued energy price environment, therefore, provides a degree of stability, but remains a wildcard that could quickly shift market dynamics. The interplay between these major asset classes - currencies, equities, and commodities - provides the essential backdrop against which Bitcoin's price action must be interpreted.
Historical Parallels: Consolidation Patterns in Bitcoin's Past
Bitcoin's price history is punctuated by periods of intense volatility followed by extended consolidation phases. These sideways markets, while often frustrating for traders seeking quick profits, are crucial for market health. They allow the market to absorb previous gains, re-evaluate fundamental value, and set the stage for the next significant move. Looking back at previous cycles, periods of consolidation around major psychological levels have often preceded substantial rallies. For instance, after the 2021 bull run peaked, Bitcoin entered a prolonged bear market and consolidation phase that lasted for much of 2022 and early 2023. During this time, price action often became range-bound, with sharp rallies being sold into and sharp drops being bought. The current consolidation around $60,222 bears some resemblance to these historical patterns, albeit on a shorter timescale and within a potentially different macroeconomic context.
One notable historical parallel can be drawn to the consolidation phase Bitcoin experienced in late 2020 and early 2021, before its record-breaking surge. After breaking above the previous all-time high of around $20,000, BTCUSD spent several weeks consolidating in a tight range before eventually breaking out to new highs. This period of price discovery and consolidation allowed institutional interest to build and validated the upward move. Similarly, after the 2017 bull run, Bitcoin entered a protracted bear market, but within that bear market, there were several periods of sideways trading that eventually gave way to short-lived rallies. The key difference now is the presence of Bitcoin ETFs, which have introduced a new dynamic of institutional demand and liquidity that was absent in previous cycles. This could potentially shorten consolidation periods or lead to different patterns of price discovery.
The current ADX values across multiple timeframes (11.48 on 1H, 41.69 on 4H, 33.99 on 1D) paint a picture of transition. A low ADX indicates a lack of trend, while a high ADX signifies a strong trend. The variation suggests that short-term momentum is weak, but longer-term forces are at play. Historically, periods of low ADX have often been followed by periods of high ADX as a new trend emerges. The challenge for traders is to identify the precursors to these trend shifts. For example, divergences in RSI or Stochastic oscillators, as seen on the daily chart (RSI 33.27, Stochastic oversold), have often preceded significant trend reversals or the end of consolidation phases. By studying these historical patterns, we can better interpret the current market structure and anticipate potential future movements, understanding that consolidation is not a sign of stagnation but often a necessary precursor to the next phase of price discovery.
Trading Strategies for Different Time Horizons
The current market environment, characterized by consolidation around $60,222, calls for distinct strategies depending on a trader's time horizon and risk tolerance. For **scalpers**, the strategy revolves around exploiting the tight trading range. They would look to buy near the lower bound of the range (around $59,670.67) and sell near the upper bound (around $60,398.67), using the 1-hour chart indicators for short-term signals. The key is extremely tight risk management, with stop-losses placed just outside the range to avoid being caught in a breakout. The weak ADX on the 1-hour chart (11.48) supports this range-trading approach, as it suggests that trends are not yet established, making short-term reversals more likely within the defined boundaries.
For **swing traders**, patience is the primary virtue. They would typically wait for a clear breakout from the consolidation range. A confirmed break and close above the resistance at $60,398.67, especially with increasing volume and positive momentum on the 4-hour chart (MACD positive, ADX strengthening), could signal an entry for a bullish position targeting higher levels. Conversely, a decisive breakdown below the support at $59,670.67, confirmed by a strong bearish close on the 4-hour chart and increasing selling pressure across indicators, would suggest a shorting opportunity. The higher ADX on the 4-hour chart (41.69) indicates that once a trend does establish itself, it may be more robust, making it suitable for swing trades. They would closely monitor the daily chart for confirmation, as a daily close outside the range provides a stronger signal.
Long-term investors, particularly those focused on accumulating BTCUSD, might view the current consolidation as an opportunity to dollar-cost average (DCA) or add to existing positions, especially given the daily chart's oversold RSI (33.27) and Stochastic (K: 21.68, D: 24.62). The historical precedent of consolidation preceding major bull runs, combined with ongoing institutional adoption (evidenced by ETF flows, though not detailed in this data), could make current levels attractive for a long-term hold. They would be less concerned with short-term fluctuations and more focused on the broader adoption trends, regulatory developments, and the halving cycle's long-term impact. For them, the $60,222 level is less a trading range and more a potential accumulation zone before the next major upward cycle. Risk management for long-term investors involves ensuring their overall portfolio allocation is sound and avoiding emotional decisions based on short-term price swings.
The Path Forward: What to Watch Next Week
As we look towards the next trading week, the key focus remains on whether BTCUSD can break out of its current consolidation range around $60,222. The immediate support level to watch is $59,670.67. A failure to hold this level on the 4-hour or daily chart could trigger a cascade of selling, potentially leading to a test of the next support at $59,250.67. On the upside, the resistance at $60,398.67 is the first hurdle. A decisive close above this level, ideally confirmed by increasing volume and sustained momentum on the 4-hour chart, would open the door for a move towards the next resistance at $60,714.67. The overall trend on the daily chart still leans bearish (ADX 33.99), but the oversold conditions on RSI and Stochastic suggest that the downtrend may be losing steam, making a bullish reversal a distinct possibility.
Macroeconomic data releases will be crucial catalysts. Any significant surprises in upcoming labor market reports or inflation figures could sway Federal Reserve policy expectations, impacting the DXY and global risk appetite. Traders should pay close attention to any shifts in Fed Fund Futures pricing, which reflect market expectations for interest rates. Geopolitical developments also remain a wildcard; any escalation of tensions could lead to a flight to safety, potentially benefiting the dollar and hurting Bitcoin. For crypto-specific news, monitoring on-chain metrics such as active addresses, whale movements, and exchange flows will be vital. A significant increase in whale accumulation or a surge in active addresses could signal growing conviction among long-term holders, potentially preceding a bullish breakout. Conversely, large outflows to exchanges could indicate preparations for selling.
The interplay between these technical levels, macroeconomic factors, and on-chain activity will ultimately dictate Bitcoin's direction. The current 'flat action' around $60,222 presents both challenges and opportunities. For short-term traders, the range offers potential for quick profits if managed carefully. For longer-term investors, it might represent a valuable accumulation zone. The key takeaway is that patience and discipline are required. Waiting for a clear signal - either a confirmed breakout above resistance or a decisive breakdown below support - will be crucial for aligning trades with the prevailing market momentum. The market is currently balanced on a knife's edge, and the coming week's price action will likely determine whether Bitcoin embarks on a new upward trajectory or succumbs to renewed selling pressure.
Bearish Scenario: The Consolidation Breakdown
45% ProbabilityNeutral Scenario: Range Continuation
35% ProbabilityBullish Scenario: The Breakout
20% ProbabilityFrequently Asked Questions: BTCUSD Analysis
What happens if BTCUSD breaks below the $59,670.67 support level?
A confirmed break below $59,670.67 on the daily chart would invalidate the current consolidation and likely trigger further downside. The immediate target would be the next support at $59,250.67, with a potential extension towards $58,454.67 if selling pressure intensifies.
Should I buy BTCUSD at current levels around $60,222 given the oversold RSI on the daily chart?
While the daily RSI at 33.27 suggests oversold conditions, indicating potential for a bounce, it's not a standalone buy signal. Consider waiting for confirmation, such as a bullish MACD crossover on the 4H chart or a clear break above $60,398.67 resistance, before entering a long position to manage risk effectively.
Is the MACD histogram showing negative momentum at -0.20 a strong sell signal for BTCUSD?
The negative MACD histogram on the 1H chart (-0.20) indicates that bearish momentum is currently present, but the weak ADX (11.48) suggests the trend is not strong. This means it's more of a caution signal than a definitive sell signal; look for confirmation from other indicators or price action before acting.
How might the stable labor market data affect BTCUSD's outlook this week?
Stable labor data could reinforce expectations of a Federal Reserve pause on interest rate hikes. This might weaken the DXY (currently at 101.34) and increase risk appetite, potentially providing a tailwind for BTCUSD if it breaks above its current resistance levels.
| Indicator | Value | Signal | Interpretation |
|---|---|---|---|
| RSI (14) | 48.19 | Neutral | Slight downward trend on 1H, oversold on 1D |
| MACD Histogram | -0.20 | Bearish | Negative momentum on 1H, losing steam |
| Stochastic | K:27.69, D:24.04 | Bullish | Moving out of oversold on 1H |
| ADX | 11.48 | Weak Trend | Lack of strong directional momentum on 1H |
| Bollinger Bands | Middle Band | Watch | Price below middle band on 1H, indicating consolidation |
Track markets in real-time
AI-powered analysis, technical indicators and real-time price data.
Join Our Telegram Channel
Breaking market news, AI analysis and trading signals instantly.
Join Channel