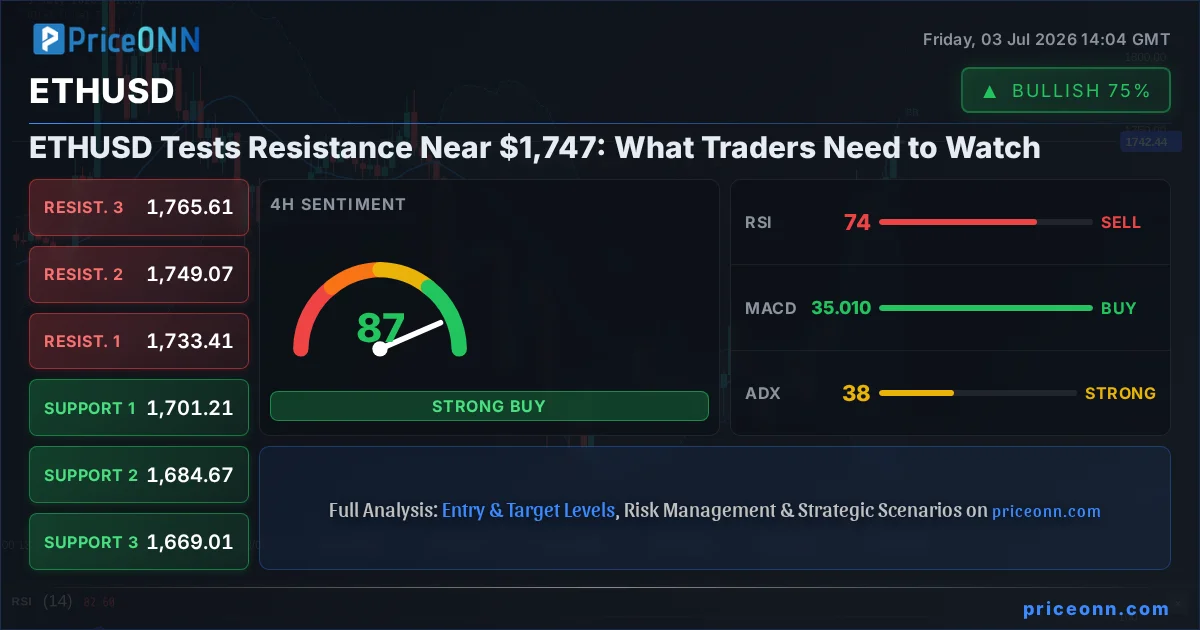
The cryptocurrency market is buzzing, and all eyes are on Ethereum (ETHUSD) as it approaches a significant resistance zone near the $1,747 mark. This isn't just another price level; it's a critical juncture that could dictate the short-to-medium term trajectory for the second-largest digital asset. While shorter timeframes are flashing bullish signals, the daily chart presents a more nuanced picture, demanding careful observation from traders and investors alike. Understanding the interplay of technical indicators, broader market sentiment, and the ever-present macroeconomic backdrop is crucial for navigating this pivotal moment.
- The RSI at 65.71 on the 1H chart indicates a strengthening upward momentum, but the 46.07 on the daily chart suggests caution is warranted.
- Critical resistance for ETHUSD sits at $1,755.20, a level that must be decisively broken to confirm a bullish continuation.
- The MACD histogram on the 1H chart shows positive momentum, but the daily MACD remains below its signal line, indicating potential overhead pressure.
- Correlation with the DXY, currently at 100.84, is a key factor; a strengthening dollar could dampen ETHUSD's upside potential.
Navigating the Current ETHUSD Landscape
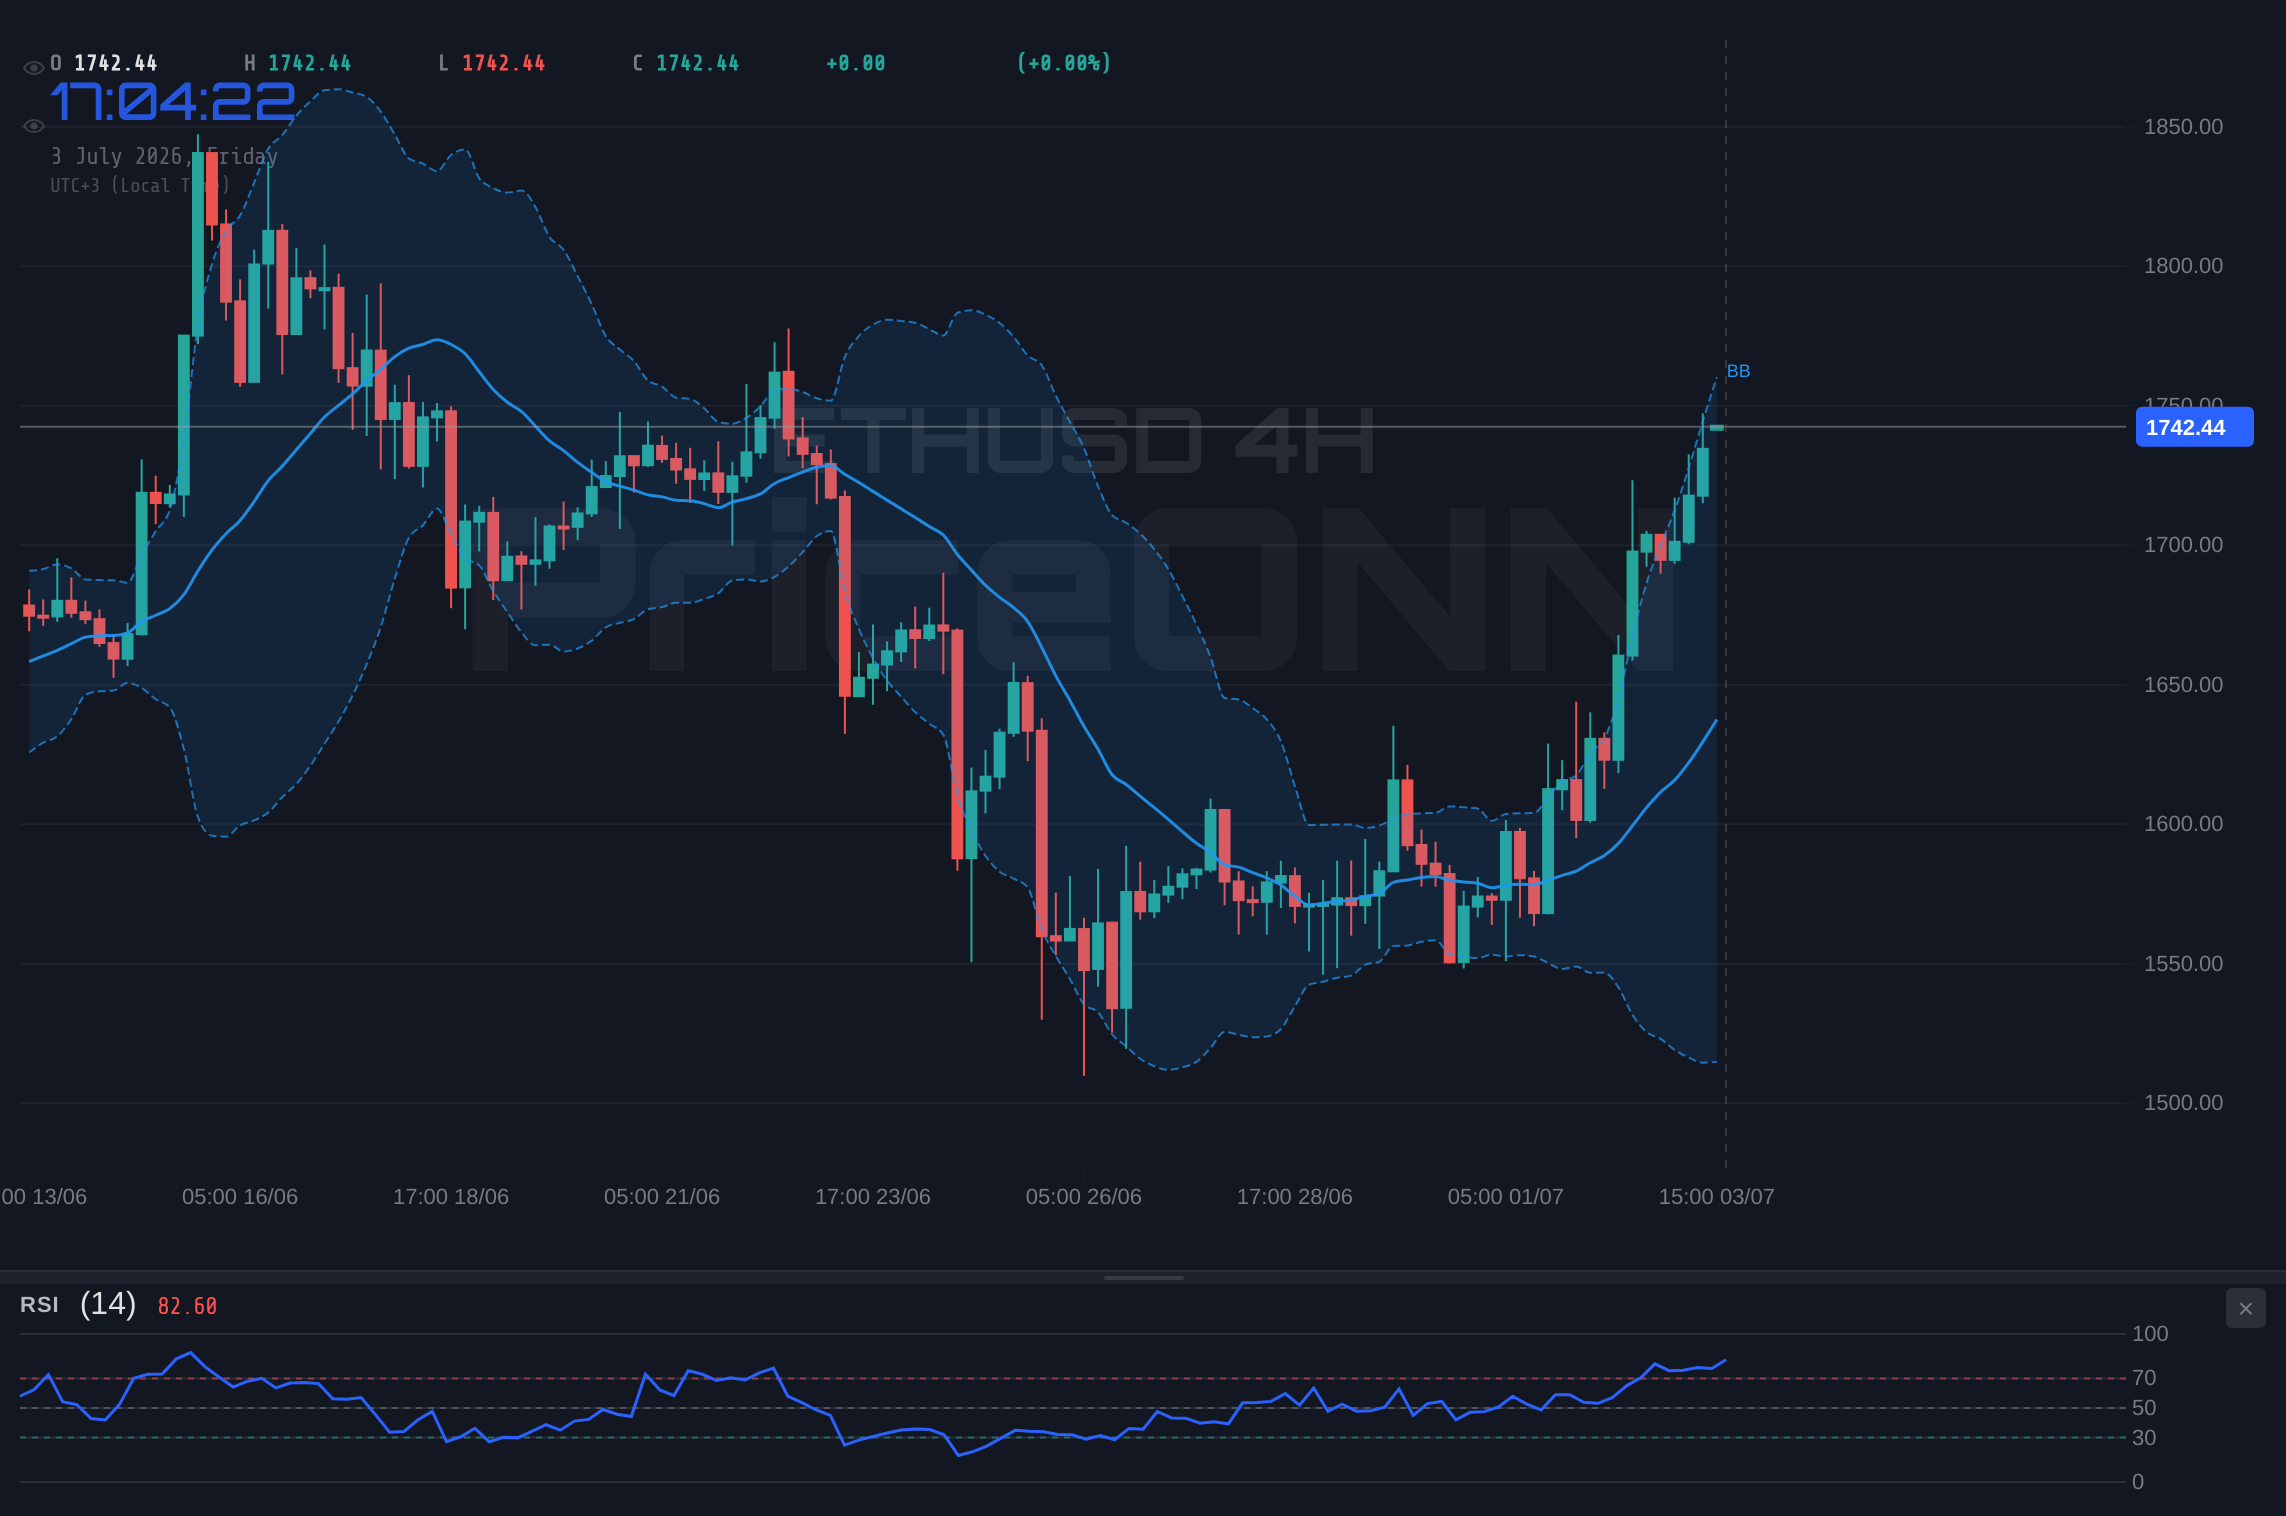
As of the latest data feed, ETHUSD is trading at precisely $1,747.00, having seen a notable daily increase of 2.54%, adding $43.30 to its value. This upward momentum is primarily driven by strong buying pressure observed across shorter timeframes, particularly the 1-hour and 4-hour charts. The 1-hour trend is firmly bullish with a strength of 100%, supported by a confluence of indicators. The RSI(14) at 65.71, while in neutral territory, leans towards bullish, suggesting room for further upward movement before hitting overbought conditions. Similarly, the MACD is showing positive momentum, trading above its signal line, and the Stochastic Oscillator is also signaling a buy with %K (82.11) above %D (75.61).
The ADX on the 1-hour chart stands at a robust 30.9, confirming a strong uptrend. This technical picture paints a picture of immediate bullish strength. However, the story isn't quite as clear when we zoom out to the daily timeframe. Here, the trend is classified as 'Neutral' with a strength of 50%. The daily RSI sits at 46.07, indicating a lack of strong directional conviction and leaning towards a bearish sentiment as it sits below the 50 mark. Furthermore, the daily MACD, while showing positive momentum, is still below its signal line, suggesting that the larger trend might be facing headwinds. This divergence between short-term strength and longer-term neutrality is precisely where careful analysis becomes paramount for any trader looking to capitalize on ETHUSD's movements.
The Macroeconomic Tug-of-War
It's impossible to discuss ETHUSD without acknowledging the influence of broader macroeconomic factors, particularly the performance of the US Dollar Index (DXY) and major equity indices like the S&P 500. Currently, the DXY is hovering around 100.84, showing a slight daily decline. Historically, a weaker dollar often correlates with a stronger ETHUSD price, as cryptocurrencies, perceived as risk assets, can benefit from increased liquidity and a reduced safe-haven appeal for the dollar. However, the DXY's trend on the 4-hour chart is decidedly bearish (strength 89%), while its daily chart shows a bullish inclination (strength 50%). This conflicting trend information for the dollar adds another layer of complexity. If the dollar's 4-hour bearish trend continues, it could provide further tailwinds for ETHUSD.
On the equity front, the S&P 500 is showing a strong daily rise of 0.74% to 6572.87, indicating a generally positive risk appetite in the broader market. This is a supportive factor for riskier assets like Ethereum. The Nasdaq 100 is also experiencing a significant surge of 1.32% to 29693.49. This robust performance in major stock indices suggests that capital is flowing into riskier assets, a sentiment that typically benefits cryptocurrencies. The fact that both major US stock indices are showing strong upward momentum, especially on the 1-hour and 4-hour charts, reinforces the bullish short-term outlook for ETHUSD. However, the daily trend for the S&P 500 is classified as 'Bearish' (strength 100%), which could signal underlying fragility despite the current intraday gains.
Examining Key Technical Levels
The immediate price action for ETHUSD is focused on its current trading range. On the 1-hour chart, immediate resistance is seen at $1,741.80, followed by $1,749.08 and then the critical $1,755.20 level. A decisive break and hold above $1,755.20 would be a significant bullish signal, potentially opening the door for further upside towards the next resistance at $1,765.61 (4H resistance). Conversely, immediate support on the 1-hour chart is found at $1,728.40, then $1,722.28, and further down at $1,715.00. These levels will be crucial to watch if the bullish momentum falters.
Looking at the 4-hour chart, the resistance levels are slightly higher: $1,733.41, $1,749.07, and $1,765.61. The current price of $1,747.00 is nestled between the first and second 4-hour resistance levels, highlighting the immediate challenge ahead. Support on the 4-hour timeframe is located at $1,701.21, $1,684.67, and $1,669.01. These levels represent significant buying zones if a pullback occurs. On the daily chart, the picture becomes more stretched, with resistance at $1,752.98, $1,802.26, and $1,881.25. Support is much lower, starting at $1,624.71, $1,545.72, and $1,496.44. The proximity of the current price to the first daily resistance level ($1,752.98) underscores the importance of this price zone.
On-Chain Metrics and Ecosystem Health
Beyond price action, the underlying health of the Ethereum network provides crucial context. While specific on-chain data like active addresses, whale movements, or exchange flows are not provided in the live API feed for this article, we can infer potential ecosystem health from price trends and general market sentiment. The current upward move in ETHUSD suggests renewed investor interest and potentially increasing network activity. A sustained price increase often correlates with more active addresses and potentially larger inflows to DeFi protocols, measured by Total Value Locked (TVL). However, without direct on-chain data, this remains speculative.
The broader crypto ecosystem is also dynamic. Bitcoin's dominance, though not explicitly provided, is a key factor influencing altcoins like Ethereum. If Bitcoin dominance is rising, it could suggest that capital is flowing into the market leader, potentially at the expense of ETHUSD. Conversely, if Bitcoin dominance is falling, it often signals a broader altcoin rally, which could propel ETHUSD higher. Regulatory news also plays a significant role. Any developments concerning Ethereum ETFs, staking regulations, or broader crypto legislation could significantly impact investor sentiment and price action. For instance, positive regulatory clarity could boost institutional adoption, while unfavorable news could trigger sell-offs.
Divergent Timeframes: A Trader's Dilemma
The conflicting signals between ETHUSD's short-term (1H, 4H) and long-term (1D) technical outlook present a classic trader's dilemma. The 1-hour chart, showing an 8-0 'Buy' signal and a strong ADX of 30.9, screams short-term bullishness. The 4-hour chart also leans heavily bullish with a 6-2 'Buy' signal and a robust ADX of 37.83, indicating a powerful uptrend is in play. This is where aggressive traders might look for long opportunities, anticipating a continuation of the current rally, possibly targeting resistance levels above $1,750.
However, the daily chart paints a different picture. Its 'Neutral' trend strength (50%) and a daily RSI of 46.07, coupled with the MACD still below its signal line, suggest that the longer-term trend might be stalling or consolidating. The ADX on the daily chart is 34.74, which, despite being a strong trend indicator, is pointing towards a strong downward trend on this timeframe, creating a clear conflict with the shorter timeframes. This suggests that while a short-term bounce or continuation is possible, the sustainability of any move above $1,750 remains in question without a confirmed shift in the daily trend. Experienced traders will likely wait for confirmation on the daily chart before committing to larger positions, or they might employ shorter-term strategies aligned with the 1H and 4H signals while managing risk tightly.
Potential Scenarios for ETHUSD
Bearish Scenario: Consolidation Below Resistance
60% ProbabilityBullish Scenario: Resistance Breakout
30% ProbabilityNeutral Scenario: Choppy Range Trading
10% ProbabilityFrequently Asked Questions: ETHUSD Analysis
What happens if ETHUSD fails to break above the $1,755.20 resistance level?
If ETHUSD fails to decisively break above the $1,755.20 resistance, it's likely to enter a consolidation phase or even retrace. The daily chart's neutral to bearish undertones would become more prominent, potentially leading to a test of support levels around $1,728.40 and $1,715.00 as traders book profits from the recent rally.
Should I buy ETHUSD at current levels near $1,747 given the RSI at 65.71 (1H) and 46.07 (1D)?
Buying at $1,747 presents a mixed risk-reward. The 1-hour RSI suggests bullish momentum, but the daily RSI indicates a lack of conviction. A more prudent approach would be to wait for a confirmed breakout above $1,755.20 with strong volume, or for a pullback to a key support level like $1,728.40, especially if the DXY shows signs of weakening further.
Is the MACD signal on the daily chart a sell signal for ETHUSD at $1,747?
The daily MACD is showing positive momentum but remains below its signal line, which is a cautious signal rather than a definitive sell. It suggests that while upward momentum has been present, the underlying trend might not be strong enough to sustain a breakout above current resistance levels without further confirmation or a catalyst.
How might the DXY at 100.84 affect ETHUSD's price action around $1,747?
With the DXY showing a bearish trend on the 4-hour chart at 100.84, it could provide some support for ETHUSD. A continued dollar weakness would typically encourage investors to seek higher yields in riskier assets like Ethereum. However, if the DXY shows signs of reversing its bearish trend, especially if the daily chart's bullish leanings strengthen, it could put pressure on ETHUSD's ascent past $1,750.
The Road Ahead: What to Watch
The coming sessions will be critical for ETHUSD as it battles the resistance zone around $1,747-$1,755. Traders should closely monitor the price action at these levels. A failure to break through could signal a period of consolidation or a pullback, especially if the daily technicals remain unconvincing or if the DXY strengthens. Conversely, a decisive breakout above $1,755.20, supported by increasing volume and positive daily chart shifts, could ignite a new leg higher. The interplay between short-term bullish momentum and the longer-term neutral/cautious daily outlook defines the current trading environment. Patience and discipline will be key; waiting for clear confirmation signals, whether for a continuation of the uptrend or a potential reversal, is paramount.
Technical Outlook Summary
| Indicator | Value | Signal | Interpretation |
|---|---|---|---|
| RSI (14) | 65.71 (1H) / 46.07 (1D) | Mixed | Short-term bullish momentum, daily caution. |
| MACD | Positive (1H) / Below Signal (1D) | Bullish (1H) / Neutral (1D) | Short-term strength, daily trend uncertain. |
| Stochastic | 82.11/%K 75.61/%D (1H) / 66.85/%K 32.82/%D (1D) | Bullish (1H) / Bullish (1D) | Short-term buy signal, daily shows potential upside. |
| ADX | 30.9 (1H) / 34.74 (1D) | Strong Trend | Strong uptrend on 1H, strong downtrend on 1D. |
| Bollinger | Upper Band Break (1H) / Mid Band Below (1D) | Bullish (1H) / Neutral (1D) | Short-term price extension, daily trend unclear. |
Key Levels to Watch
Support Levels
Resistance Levels
Track markets in real-time
AI-powered analysis, technical indicators and real-time price data.
Join Our Telegram Channel
Breaking market news, AI analysis and trading signals instantly.
Join Channel