The cryptocurrency market is in a fascinating tug-of-war, and ETHUSD is right at the heart of it, currently trading at $1,761.53. This pivotal price point finds Ether challenging immediate resistance levels, a scenario that has traders and analysts on the edge of their seats. With the 1-hour chart showing a strong bullish trend and the 4-hour confirming upward momentum, the bulls certainly have a case. However, the daily chart presents a more cautious picture, and conflicting signals from key indicators suggest that this rally might be more complex than it appears. Understanding the confluence of technical signals and broader market sentiment is crucial for navigating this critical juncture. This analysis delves into the current technical landscape, dissects the bull and bear arguments, and explores the potential paths forward for ETHUSD.
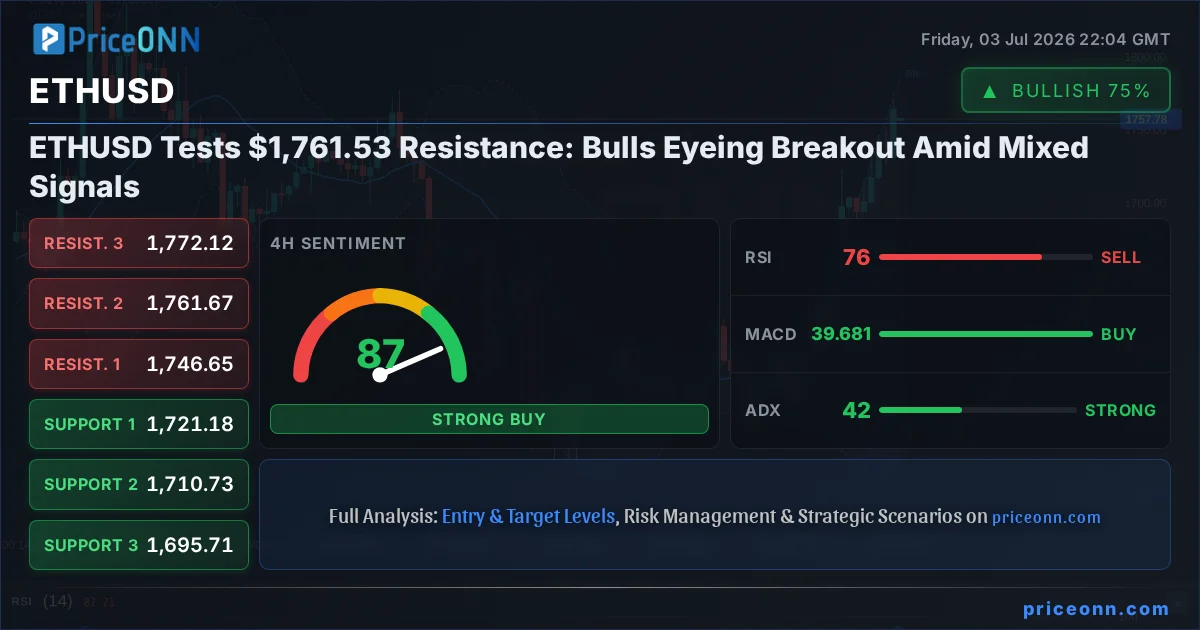
- ETHUSD is currently trading at $1,761.53, testing near-term resistance at $1,776.48.
- The 1H and 4H charts show strong bullish trends (ADX 58.81 and 42.26 respectively), but the daily RSI at 48.34 indicates fading momentum.
- MACD shows positive momentum on 1H/4H charts, but daily MACD is below the signal line, suggesting caution.
- A break above $1,776.48 is needed to confirm bullish continuation, while a fall below $1,716.98 could signal a reversal.
- Correlation with DXY (currently 100.85) and broader market risk appetite (SP500 at 6572.87) will play a significant role.
The Bullish Case: Momentum and Macro Tailwinds
The immediate technical picture for ETHUSD certainly leans bullish, driven by strong short-term trends and positive momentum indicators. On the 1-hour timeframe, the ADX is a remarkable 58.81, indicating an exceptionally strong uptrend. This isn't just a flicker of hope; it's a roaring fire, suggesting that buyers are firmly in control and pushing prices higher with conviction. The MACD is also painting a positive narrative on this timeframe, showing positive momentum with the MACD line above the signal line. This suggests that recent upward price action is being supported by increasing buying pressure, a classic sign of a healthy rally. The Stochastic Oscillator, with %K at 76.16 and %D at 58.62, confirms this bullish sentiment, indicating strong upward movement, although it's approaching overbought territory, which warrants attention.
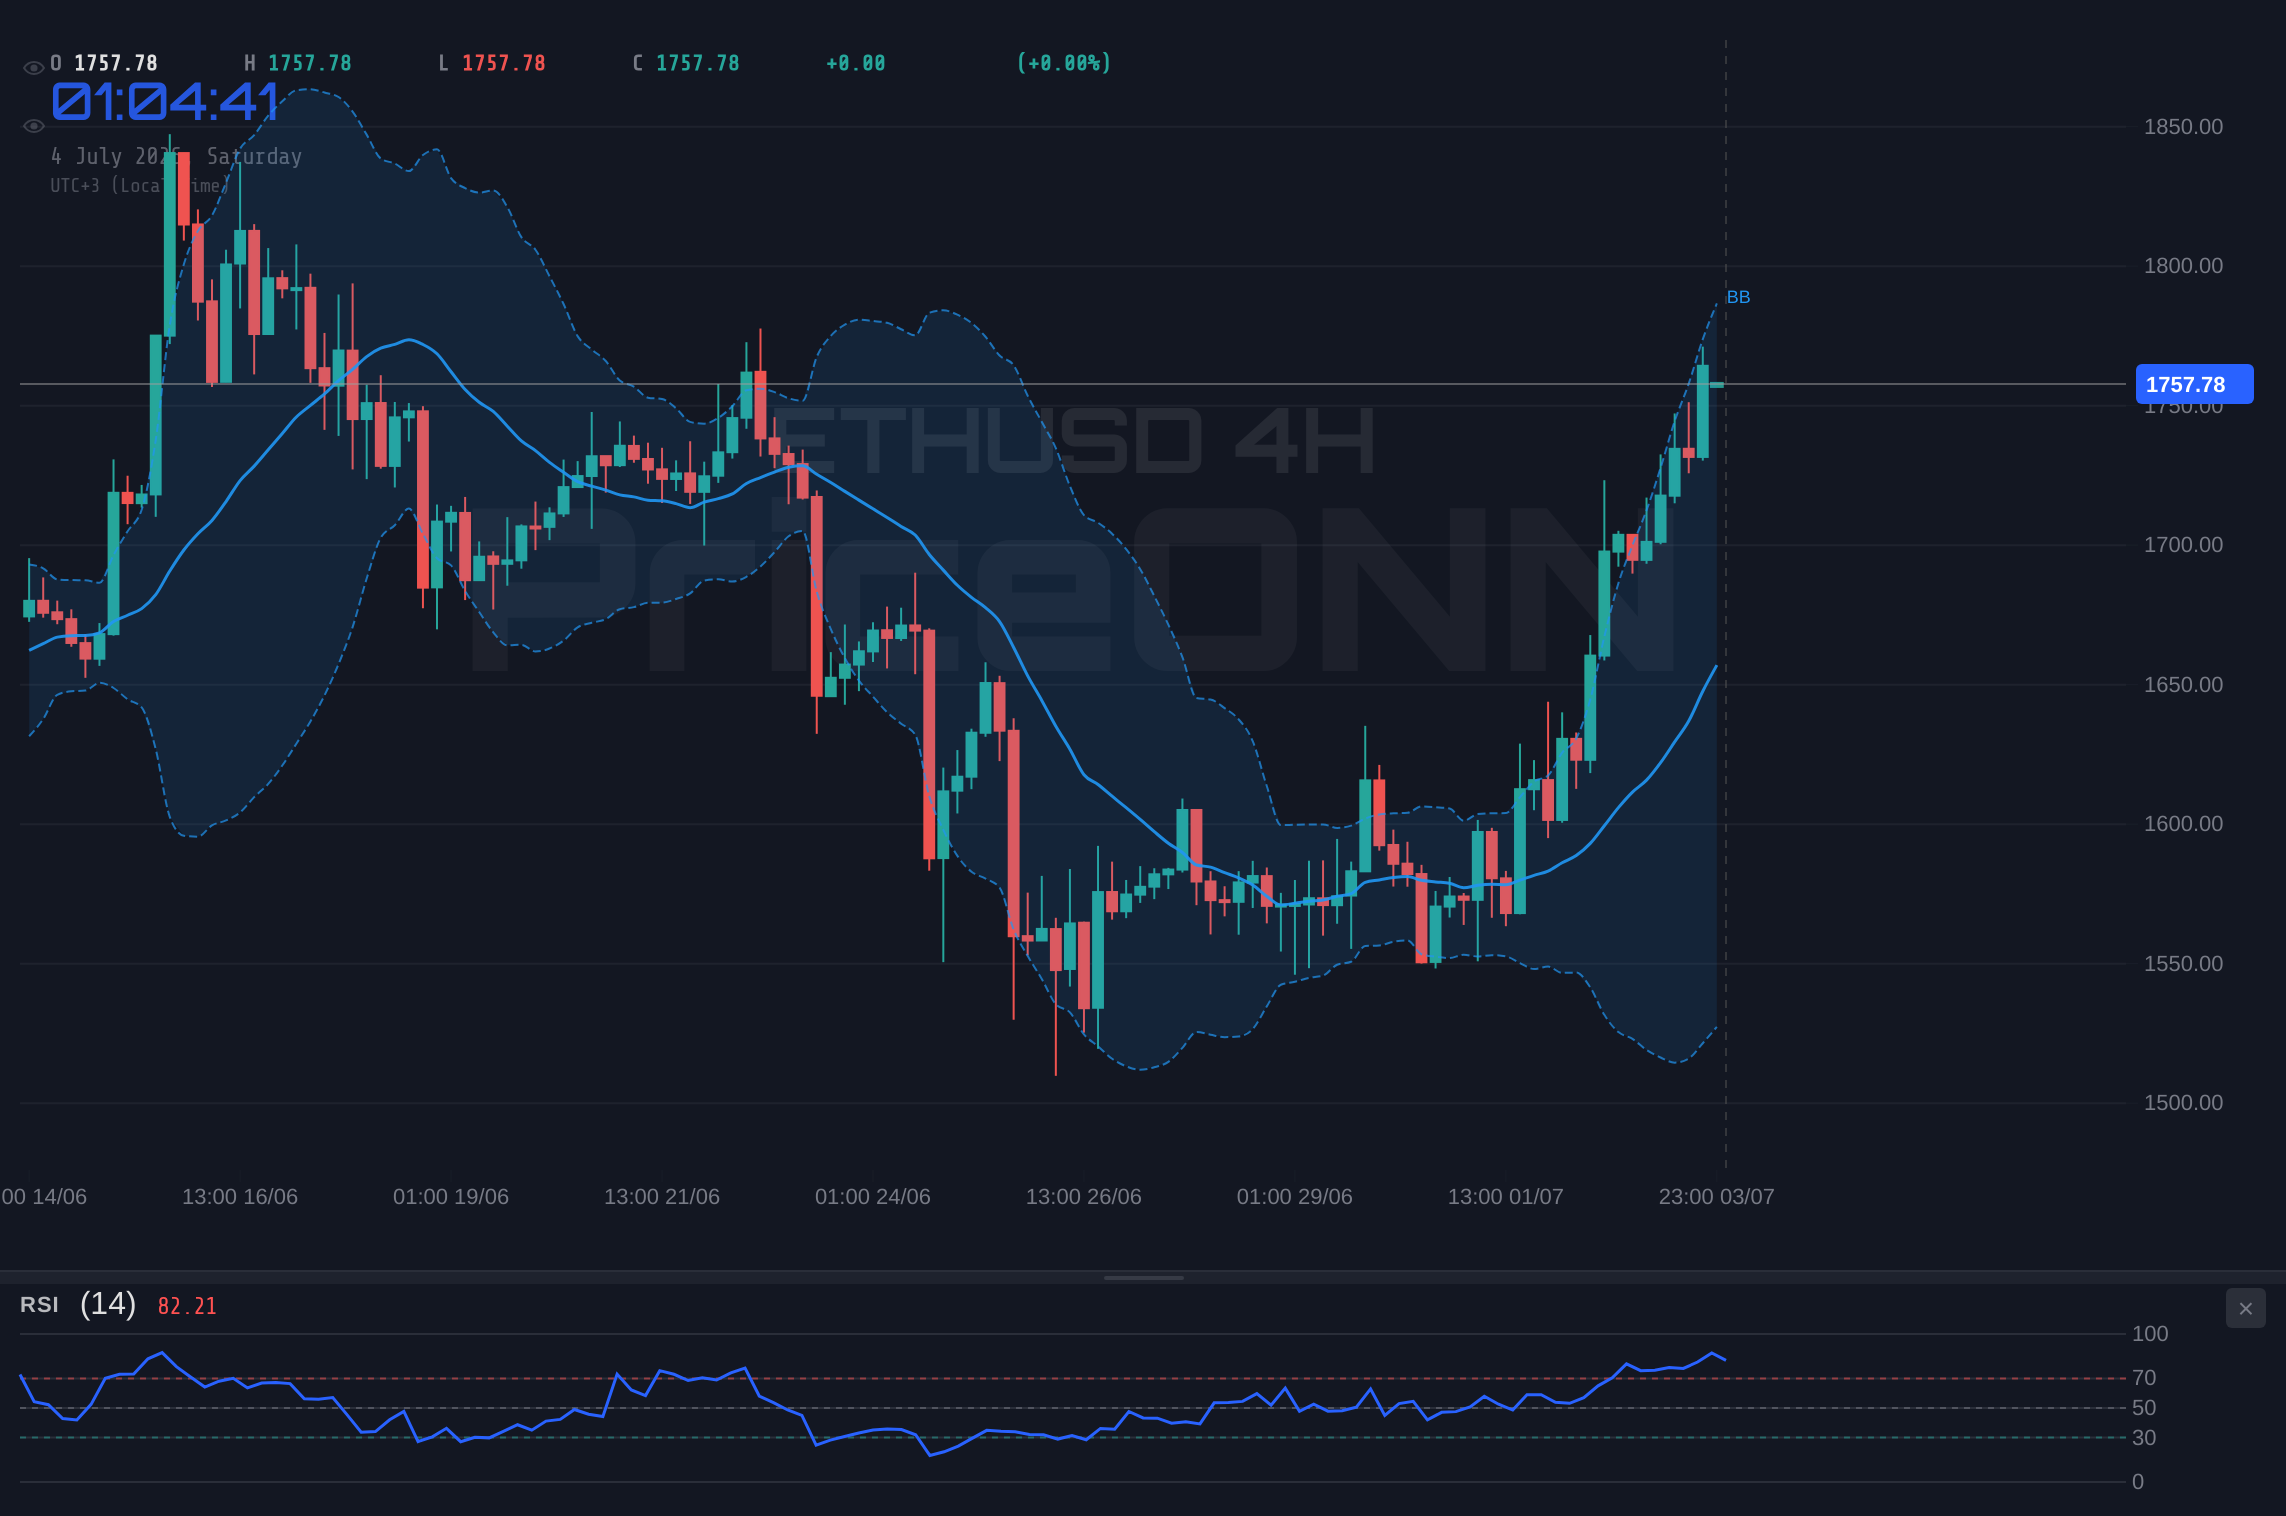
Expanding the view to the 4-hour chart, the bullish trend remains robust, albeit with a slightly less aggressive ADX reading of 42.26, still signifying a strong trend. The MACD here also shows positive momentum, reinforcing the idea that the upward trajectory is supported by underlying buying interest. The RSI, sitting at 69.65, is firmly in the neutral zone but trending upwards, suggesting there's still room for the price to climb before hitting overbought conditions. The Stochastic Oscillator on this timeframe is even more emphatic, with %K at 90.5 and %D at 81.43, firmly in overbought territory. While this can sometimes signal a short-term pullback, in a strong uptrend, it can also indicate sustained buying pressure. The Bollinger Bands on both the 1H and 4H charts are also showing upward bias, with the price trading above the middle band, indicating the path of least resistance is currently to the upside.
Furthermore, the broader market context provides some tailwinds. The DXY, or Dollar Index, is currently trading around 100.85, showing a slight downward bias on the 4-hour chart, which historically tends to be a positive correlation for risk assets like ETHUSD. A weaker dollar can encourage investment in alternative assets. Additionally, the S&P 500 is showing a strong upward move, currently at 6572.87, indicating a healthy risk appetite in the broader financial markets. This positive sentiment in equities often spills over into the crypto space, creating a more favorable environment for assets like Ether. The recent news of cooling US labor market data, as reported on July 2nd and 3rd, potentially lowering Fed rate hike odds, could further support risk assets by reducing borrowing costs and increasing liquidity. This macro backdrop aligns well with the bullish technical signals observed on the shorter timeframes for ETHUSD.
The Bearish Counterpoint: Daily Divergence and Cautionary Signals
Despite the compelling bullish narrative on the shorter timeframes, a closer inspection of the daily chart reveals significant divergences and cautionary signals that cannot be ignored. The ADX on the daily timeframe stands at 34.29, still indicating a strong trend, but the RSI paints a different story. At 48.34, the daily RSI is in the neutral zone but shows a downward trend. This suggests that while shorter-term momentum might be positive, the longer-term buying pressure is waning, and bears are starting to regain some ground. This divergence between short-term strength and long-term weakness is a classic warning sign that the current rally might be unsustainable without further fundamental catalysts.
The MACD on the daily chart further amplifies this caution. While the 1H and 4H MACD lines are above their signal lines, the daily MACD is below its signal line, indicating negative momentum on the longer timeframe. This suggests that the recent price increases might be met with increasing selling pressure as we move further out. The Stochastic Oscillator on the daily chart presents a more mixed picture, with %K at 67.03 and %D at 32.85, showing a bullish signal as %K crosses above %D. However, this comes after a period of significant downside, and its position in the upper half of the oscillator range, while bullish, doesn't scream runaway rally. The Bollinger Bands on the daily chart are also trading above the middle band, indicating an upward bias, but this needs to be viewed in conjunction with the RSI and MACD signals. The overall daily trend strength is noted as 'Düşüş' (Downtrend) with 92% strength, which is a significant red flag against the short-term bullishness.
Moreover, the historical context and market structure offer additional reasons for caution. Looking at the broader crypto market, Bitcoin (BTCUSD), the market leader, is also showing mixed signals. While its 1H and 4H charts are bullish, its daily chart presents a similar divergence with a downward-trending RSI and a MACD below the signal line, despite a strong ADX. This lack of conviction from Bitcoin can often cap rallies in altcoins like Ethereum. Furthermore, the current price action for ETHUSD is approaching a significant resistance level. The data shows resistance at $1,776.48, $1,788.69, and $1,806.23. Breaking through these levels will require substantial buying volume and conviction, which may be lacking given the daily divergences. The fact that the 1D General Signal is 'NÖTR' (Neutral) with 4 'Buy', 4 'Sell', and 0 'Neutral' signals from the indicators further underscores the uncertainty. This isn't a clear-cut bullish scenario; it's a battleground where bears have valid arguments based on longer-term charts.
Navigating the $1,761.53 Crossroads: Technical Confluence
The $1,761.53 level for ETHUSD is more than just a price; it's a critical battleground where the short-term bullish momentum clashes with longer-term bearish divergences. The technical indicators provide a complex tapestry of signals, requiring careful interpretation. On the 1-hour chart, the ADX at 58.81 screams 'strong uptrend,' and the MACD confirms positive momentum. This suggests that any immediate dips might be short-lived opportunities for buyers to step in. However, the RSI at 71.93 is firmly in overbought territory. This means that while the trend is strong, the market is becoming overheated on this timeframe, increasing the probability of a short-term consolidation or pullback. The Stochastic Oscillator, with %K at 81.24, also points to overbought conditions, reinforcing the idea that immediate upside might be limited without a pause.
The 4-hour chart offers a slightly more balanced view but still leans bullish. The ADX at 42.26 indicates a strong trend, and the MACD remains positive. The RSI at 69.65 is approaching overbought levels, but still has some room to run. The Stochastic Oscillator here is at 90.5/%K and 81.43/%D, firmly in overbought territory, suggesting that a period of consolidation or a minor correction could be on the horizon to cool off these oscillators. The Bollinger Bands on this timeframe are hugging the upper band, indicating strong upward pressure, but also the potential for price to revert towards the middle band if momentum falters. The overall signal on this timeframe is 'AL' (Buy), but the extreme readings on the Stochastic warrant vigilance.
The daily chart, however, is where the real conflict lies. The ADX at 34.29 still points to a strong trend, but the RSI at 48.34 is showing weakness and a downward slope. The MACD is below its signal line, indicating bearish momentum on this longer timeframe. The Stochastic Oscillator shows a bullish crossover, but its position doesn't suggest a massive rally is imminent. The key takeaway here is the divergence: strong short-term momentum is running into resistance on longer-term charts. This suggests that while a short-term breakout above $1,776.48 is possible, sustained upward movement will likely require a fundamental shift or a significant increase in buying volume that can overcome the daily bearish signals. The confluence of these signals suggests a high probability of consolidation or a volatile breakout attempt around the current $1,761.53 level, with the direction ultimately depending on which timeframe's signals prevail.
Scenario Analysis: Mapping the Path Forward
Bearish Scenario: Consolidation and Lower Targets
60% ProbabilityNeutral Scenario: Range-Bound Volatility
25% ProbabilityBullish Scenario: Breakout Confirmation
15% ProbabilityThe Verdict: Tread Carefully Above $1,761.53
ETHUSD is currently perched at a critical juncture, trading at $1,761.53. The short-term technicals, particularly on the 1-hour and 4-hour charts, paint a picture of bullish momentum with strong ADX readings and positive MACD signals. This suggests that the immediate pressure is to the upside, and any dips could be temporary. The broader market sentiment, buoyed by cooling US economic data and a slightly weaker dollar, also provides a supportive backdrop. However, the daily chart presents a starkly different perspective. The RSI is trending downwards, the MACD is below its signal line, and the overall daily trend is still classified as a downtrend. This divergence between short-term strength and long-term weakness is a significant warning. The overbought conditions on the Stochastic Oscillator across multiple timeframes also indicate that the market may be due for a pause or correction.
Given these conflicting signals, the most probable outcome in the short term is increased volatility and potential consolidation around the $1,761.53 level. While a breakout above the immediate resistance at $1,776.48 is possible, especially if driven by strong volume or positive news, it faces headwinds from the daily divergences. The bearish scenario, with a breakdown below $1,746.73, seems more probable given the longer-term indicators, targeting support levels at $1,716.98 and potentially $1,695.71. The neutral scenario, characterized by range-bound trading between $1,746.73 and $1,776.48, also holds significant probability. Traders should exercise caution, manage risk diligently, and await clearer signals. Confirmation of a sustained move above $1,776.48, backed by increasing daily RSI and MACD momentum, would be needed to validate a stronger bullish outlook. Conversely, a decisive break below $1,746.73 on increasing volume would strengthen the bearish case.
Frequently Asked Questions: ETHUSD Analysis
What happens if ETHUSD breaks above the $1,776.48 resistance level?
If ETHUSD sustains a close above $1,776.48 on increased volume, particularly on the 1-hour and 4-hour charts, it could signal a continuation of the bullish trend. The next key resistance target would then be $1,788.69, with a further push towards $1,806.23 possible.
Should I consider buying ETHUSD at current levels of $1,761.53 given the mixed signals?
Buying at $1,761.53 presents a risk due to conflicting signals between short-term bullish momentum and longer-term bearish divergences. A more prudent approach might be to wait for confirmation: either a clear break above $1,776.48 with strong volume, or a pullback to a more defined support level like $1,716.98, offering a better risk-reward ratio.
Is the RSI at 72.59 on the 1H chart a sell signal for ETHUSD?
An RSI of 72.59 on the 1-hour chart indicates overbought conditions, suggesting that the recent rally might be losing steam and a short-term pullback or consolidation is likely. However, in a strong uptrend (like the 1H ADX at 58.81), RSI can remain elevated for extended periods, so it's not a definitive sell signal on its own but warrants caution and looking for bearish confirmation.
How might the upcoming Fed rate expectations affect ETHUSD's price around $1,761.53?
Cooling US labor market data suggesting lower Fed rate hike odds can be bullish for ETHUSD, as it may increase risk appetite and reduce the appeal of holding dollar-denominated assets. If future Fed commentary remains dovish, this could provide the necessary catalyst for ETHUSD to break above resistance at $1,776.48.
Technical Outlook Summary
| Indicator | Value | Signal | Interpretation |
|---|---|---|---|
| RSI (14) | 48.34 | Bearish Divergence (Daily) | Momentum fading on longer timeframe despite short-term strength. |
| MACD | -3.20 (Histogram) | Bearish Momentum (Daily) | Daily MACD below signal line suggests selling pressure. |
| Stochastic | 67.03 / 32.85 | Bullish Crossover (Daily) | Suggests potential upside, but in context of longer-term weakness. |
| ADX | 34.29 | Strong Trend (Daily) | Indicates a strong trend is in play, direction uncertain due to divergences. |
| Bollinger Bands | Middle Band Breakout | Bullish Bias (Daily) | Price above middle band supports upward movement, but watch for overbought signals. |
Key Levels
Support Levels
Resistance Levels
Track markets in real-time
AI-powered analysis, technical indicators and real-time price data.
Join Our Telegram Channel
Breaking market news, AI analysis and trading signals instantly.
Join Channel