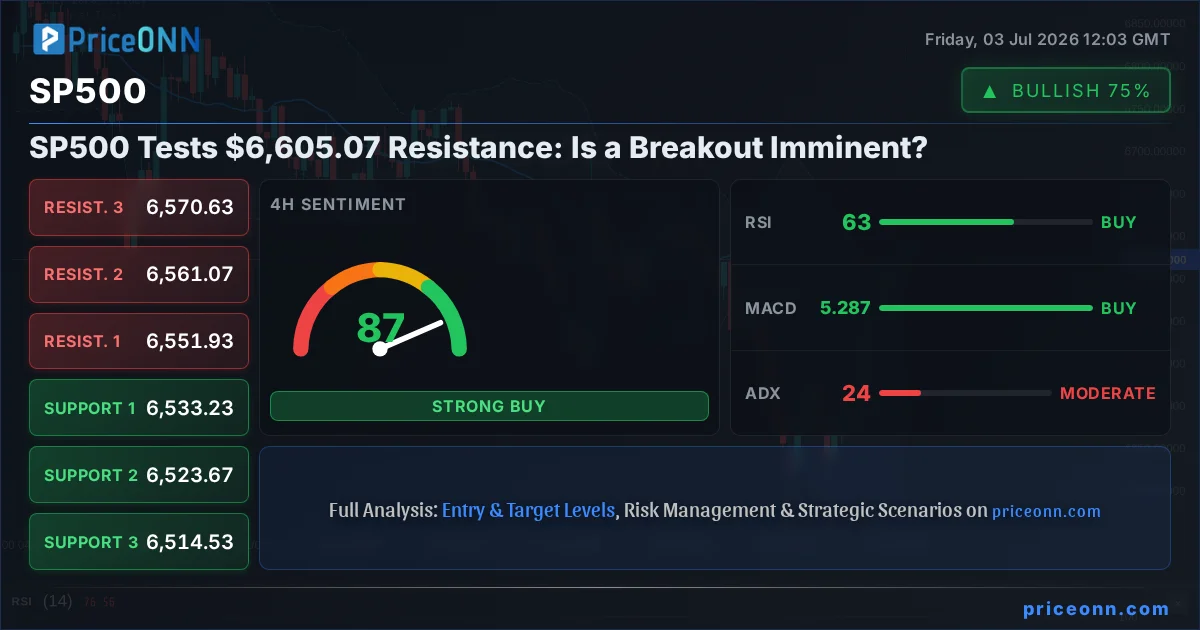
The S&P 500 is currently dancing around a critical juncture, perched at $6,572.87 and eyeing the significant resistance level at $6,605.07. This price point isn't just another number; it represents a potential inflection zone that could dictate the market's short-term trajectory. Having witnessed a strong intraday rally, the question on every trader's mind is whether this index has the steam to push through and establish new highs, or if this level will serve as a ceiling, triggering a much-needed correction.
- The SP500 is currently trading at $6,572.87, testing resistance at $6,605.07.
- On the 1-hour chart, the ADX at 49.72 indicates a strong uptrend, but RSI at 70.95 signals overbought conditions.
- Daily analysis shows a neutral trend with support at $6,377.47 and resistance at $6,605.07.
- Conflicting signals from different timeframes suggest caution is warranted until a clear breakout or rejection occurs.
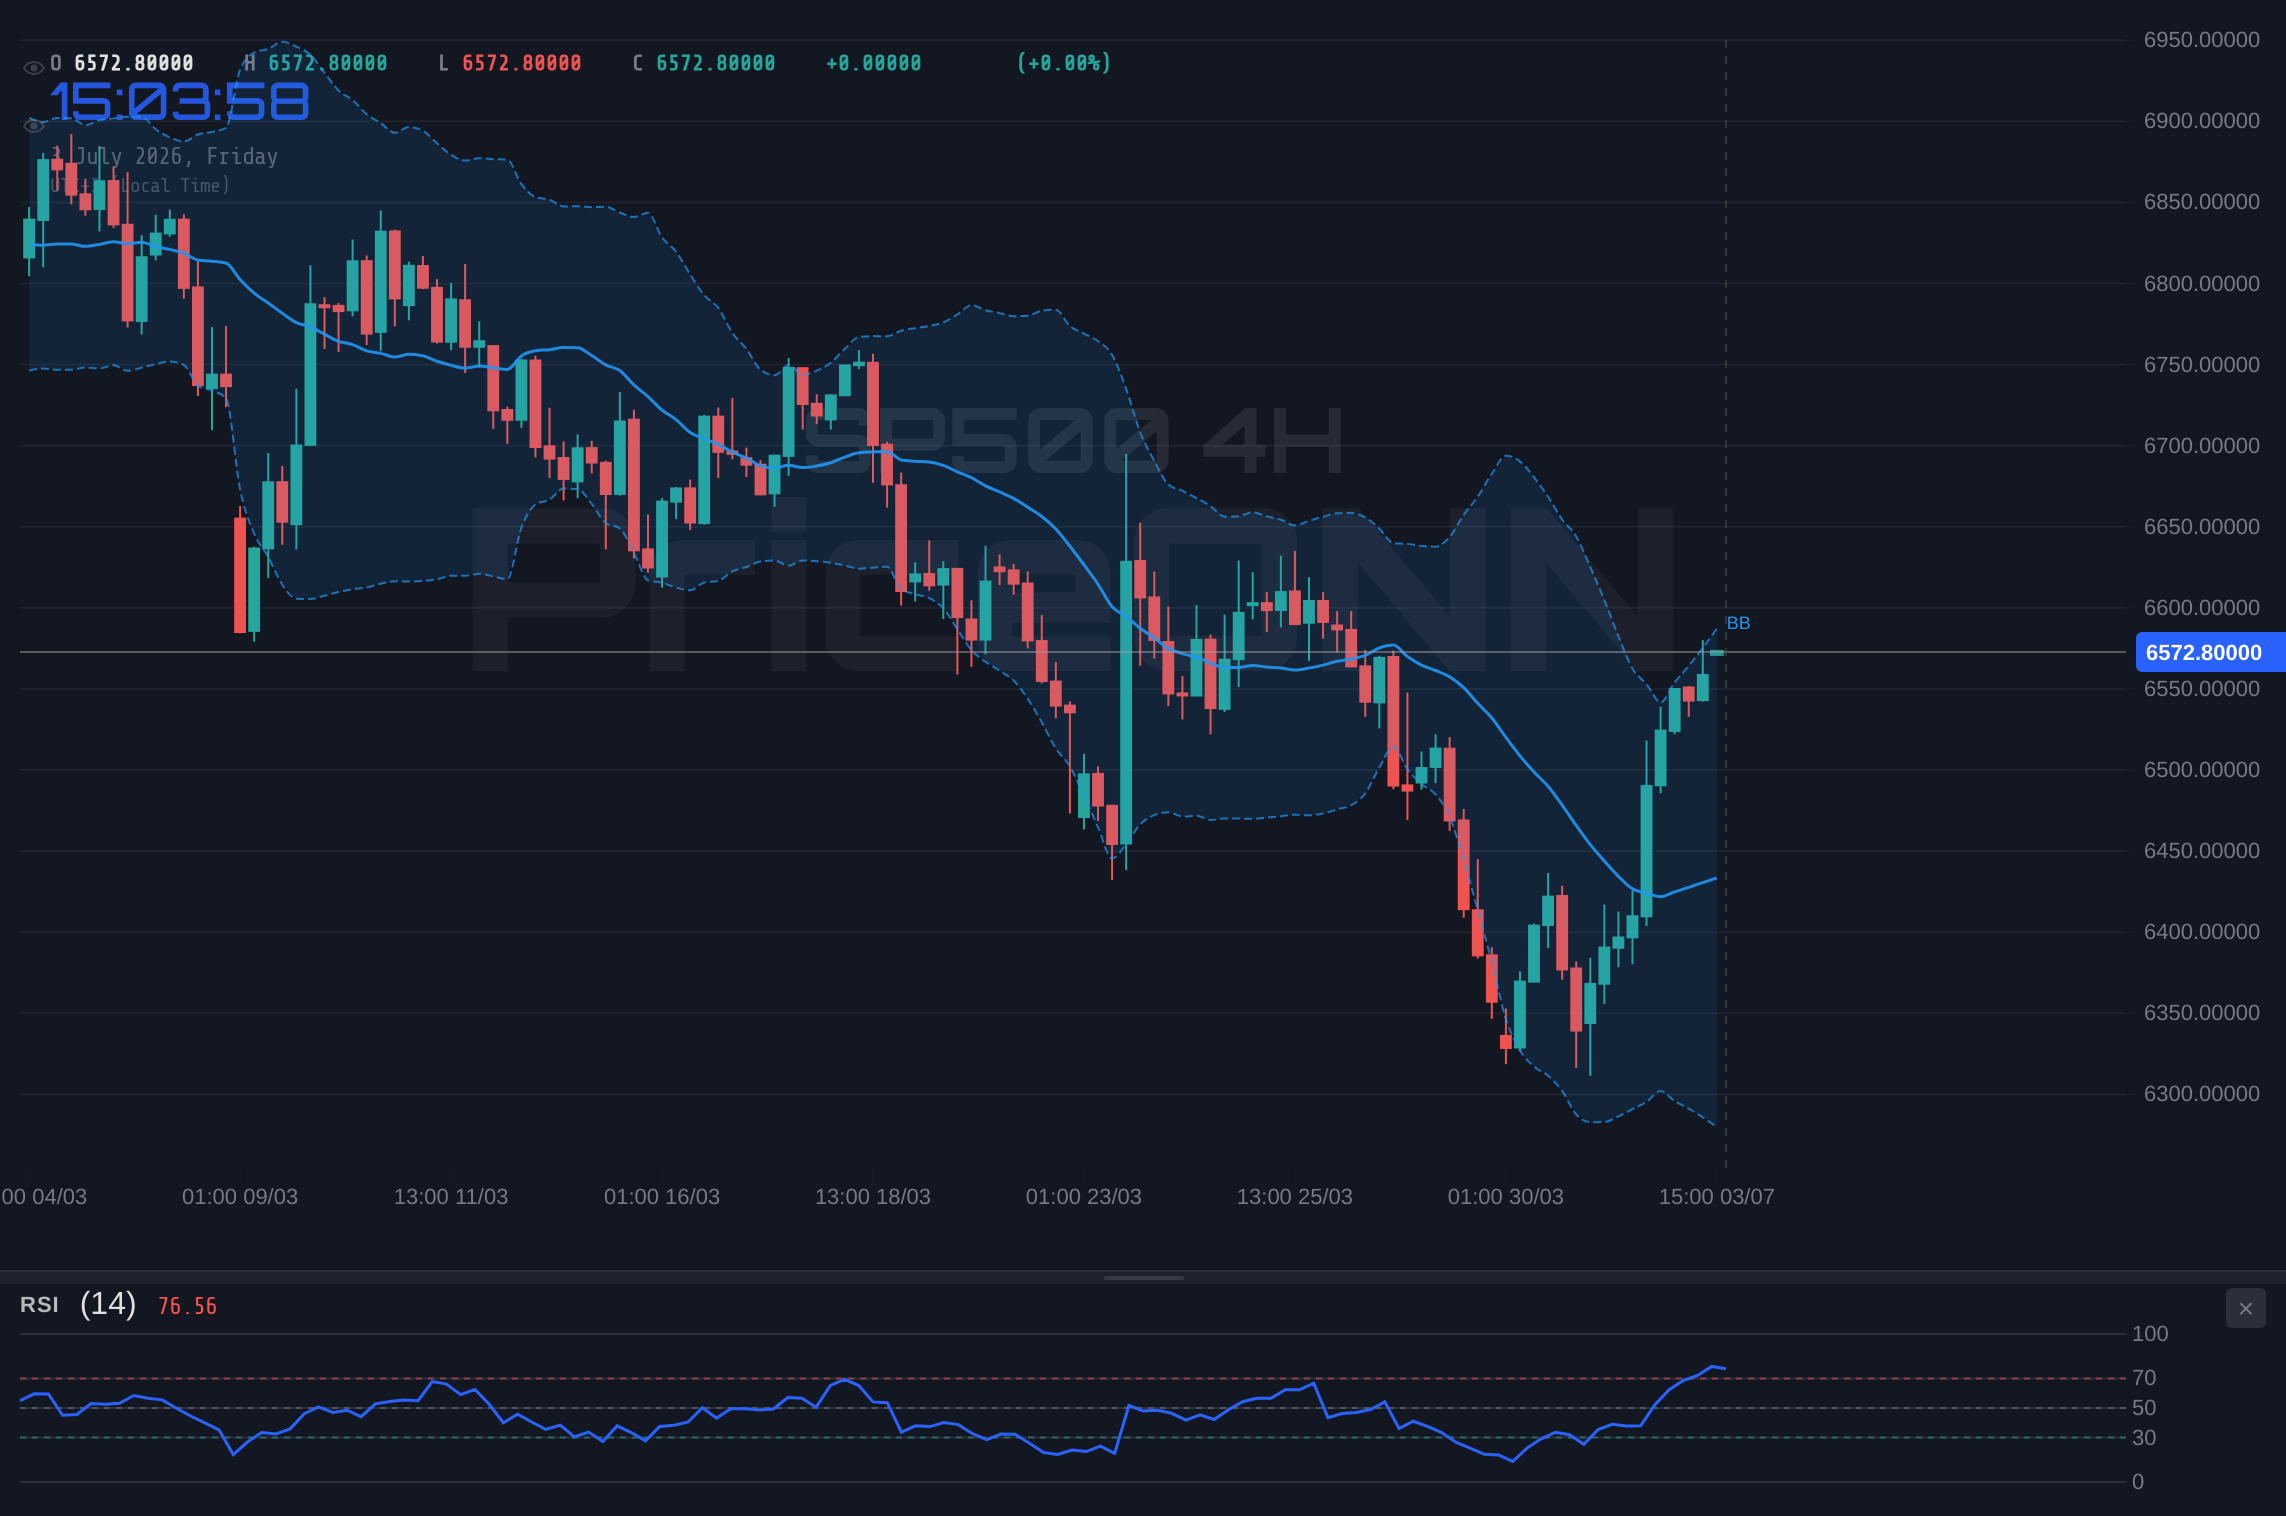
The immediate price action on the 1-hour chart paints a picture of bullish conviction. The index has rallied significantly, and indicators like the ADX at 49.72 scream 'strong trend.' This suggests that, in the short term, buyers are firmly in control. However, a closer look reveals underlying tensions. The RSI(14) is sitting at a lofty 70.95, a level traditionally associated with overbought conditions. This divergence - strong trend versus stretched momentum - is a classic sign that the current rally might be running on fumes, vulnerable to a sharp reversal or at least a period of consolidation. The Stochastic oscillator, with %K at 65.73 and %D at 73.5, further supports this, showing a bearish crossover as %K dips below %D, hinting at a potential pullback from these elevated levels.
Navigating the Choppy Waters of Short-Term Momentum
The 1-hour technicals present a complex puzzle. While the overall trend strength on this timeframe is classified as 100% bullish, the individual indicator readings tell a story of caution. The MACD, though showing positive momentum, has its histogram below the signal line, suggesting that the bullish momentum might be waning. The Bollinger Bands, while indicating a price above the middle band, are not showing extreme expansion, which could mean the market is consolidating within a tight range before the next major move. The key resistance levels on the 1-hour chart are $6,568.73, $6,577.27, and $6,589.83, with the ultimate target being the $6,605.07 mentioned in the title. Holding above these levels will be crucial for continued upside momentum. Conversely, a failure to break convincingly above $6,577.27 could signal a short-term top, potentially leading to a test of the intraday support levels at $6,547.63, $6,535.07, and $6,526.53. This intraday battleground is where the immediate price discovery will occur.
The SP500's current RSI of 70.95 on the 1-hour chart suggests that the recent rally has pushed the index into overbought territory. Traders should be wary of potential profit-taking or a short-term pullback before any sustained move higher.
The Daily Picture: A Tale of Neutrality and Divergence
Shifting to the daily timeframe, the narrative becomes more nuanced, and frankly, more concerning for aggressive bulls. The overall trend is classified as neutral, with a power of 50%, indicating a market that is yet to commit to a clear direction over the longer term. This neutrality is reflected in the RSI(14) sitting at 45.35, which is comfortably in the neutral zone and showing a slight downward tendency. This contrasts sharply with the 1-hour chart's bullish signals. The MACD on the daily chart, while showing positive momentum, is also below its signal line, a sign that the upward pressure might not be as robust as the intraday action suggests. The daily support levels are marked at $6,377.47, $6,230.63, and $6,149.87. These are significant levels that could halt any potential downside move if the market turns south. The primary daily resistance, however, remains at $6,605.07, with further levels at $6,685.83 and $6,832.67. The ADX on the daily chart is at 47.51, indicating a strong trend, but its directionality is crucial - currently, it's supporting a strong downtrend, which clashes with the intraday bullishness.
The Stochastic indicator on the daily chart (K=42.97, D=29.88) shows a bullish signal with %K above %D, and the Bollinger Bands are currently below the middle band, suggesting a potential downward bias on the daily close. This daily picture is one of indecision, where short-term strength battles against longer-term consolidation or even potential weakness. The market seems to be caught between a desire to push higher, perhaps fueled by speculative fervor or short-covering, and fundamental or technical headwinds that suggest a broader consolidation phase might be more appropriate. The contrast between the aggressive intraday moves and the more measured, potentially cautious, daily outlook is precisely where many trading opportunities and risks lie.
Correlation Analysis: DXY and Equity Sentiment
Understanding the broader market context is paramount, and the Dollar Index (DXY) provides a crucial piece of that puzzle. Currently trading at 100.76, the DXY is in a downward trend on the hourly and 4-hour charts, though its daily trend is neutral. A weaker dollar typically correlates with strength in risk assets like the S&P 500, and vice versa. The current DXY reading suggests that the dollar is facing some headwinds, which could be contributing to the SP500's resilience. However, the daily trend for DXY being neutral means this dollar weakness might not be a sustained trend, and any resurgence in dollar strength could quickly put pressure on the SP500, especially if it's already trading near resistance.
The interplay between the SP500 and the Dollar Index is a key area to monitor. If the SP500 manages to break above $6,605.07 while the DXY remains weak or continues to decline, it would signal strong risk appetite and potentially a sustained rally. Conversely, if the SP500 falters at resistance and the DXY begins to climb, it would confirm the bearish sentiment and suggest a broader market pullback. Furthermore, the performance of other major indices like the Nasdaq 100 (currently at 29,662.13 and showing a strong 1.22% daily gain) and the Dow Jones Industrial Average (trading at 52,784.5 with a slight daily dip) provides context. The Nasdaq's strong intraday performance mirrors the SP500's upward push, reinforcing the idea of a tech-driven rally. However, the Dow's slight decline might indicate a rotation out of some sectors, adding another layer of complexity to the overall market sentiment.
The divergence between the 1-hour and 1-day RSI readings for the SP500 is a critical signal. While the intraday action is bullish, the daily perspective warns of potential exhaustion. Traders should look for confirmation on the daily close above $6,605.07 before committing to long positions, or watch for a breakdown below $6,526.53 as a bearish confirmation.
Economic Calendar and Macro Drivers
Looking at the economic calendar, recent data has played a significant role in shaping market expectations. The cooling economic data, as hinted by the Dow Jones futures climbing on lower Fed rate hike odds, suggests a potential shift in monetary policy outlook. This environment, where inflation fears might be abating enough to curb aggressive rate hikes, can be a tailwind for equities. However, the market is highly sensitive to any hints of persistent inflation or a hawkish stance from the Federal Reserve. Upcoming data releases, particularly those related to employment and inflation, will be crucial in determining whether the current risk-on sentiment can be sustained. The GBP/USD pair's movement, influenced by cooling US labor market data and the British Pound strengthening, also reflects a broader theme of shifting global economic narratives. While not directly tied to the SP500's intraday movements, these macro trends set the stage for overall market sentiment and risk appetite.
The sensitivity of the market to central bank commentary cannot be overstated. Any indication from the Fed that inflation remains 'stubborn,' as suggested by some reports, could quickly reverse the current bullish sentiment. Conversely, further evidence of cooling inflation or a Fed signaling a pause or even potential rate cuts could fuel another leg higher for the SP500. This delicate balance between economic growth, inflation, and monetary policy is the primary driver of market sentiment. Investors are constantly trying to price in the Fed's next move, and any data point that shifts this expectation can lead to significant volatility. The current upward push in the SP500 might be partially fueled by the hope of a 'soft landing' or even a 'no landing' scenario where growth continues without reigniting inflation, allowing the Fed to maintain a less aggressive policy.
Bearish Scenario: Resistance Holds Firm
65% ProbabilityNeutral Scenario: Consolidation Around Resistance
25% ProbabilityBullish Scenario: Breakout Confirmation
10% ProbabilityFrequently Asked Questions: SP500 Analysis
What happens if SP500 fails to break above the $6,605.07 resistance level?
If the SP500 fails to decisively break above $6,605.07, especially with its 1-hour RSI at 70.95 signaling overbought conditions, it's likely to trigger profit-taking. This could lead to a pullback towards the intraday support at $6,526.53, and potentially test the more significant daily support at $6,377.47 if bearish momentum gains traction.
Should I buy SP500 at current levels of $6,572.87 given the mixed signals?
Buying at $6,572.87 carries significant risk due to the proximity of resistance at $6,605.07 and the overbought RSI on the 1-hour chart. A more prudent approach would be to wait for confirmation: either a confirmed breakout above $6,605.07 with follow-through buying, or a clear rejection and pullback towards support levels like $6,526.53, offering a better risk-reward ratio.
Is the RSI at 70.95 a sell signal for SP500 right now?
An RSI of 70.95 on the 1-hour chart is a strong indicator of overbought conditions and suggests that the recent upward momentum may be unsustainable in the very short term. While not an immediate sell signal on its own, it warrants caution and increased probability of a pullback or consolidation, especially when viewed against the daily chart's neutral stance.
How will potential Fed rate decisions affect SP500's move above $6,605.07 this week?
Any indication of a less hawkish Fed stance, such as lower rate hike odds due to cooling economic data, could provide the necessary catalyst for the SP500 to break above $6,605.07. Conversely, renewed inflation concerns or hawkish commentary from Fed officials could dampen sentiment, leading to a rejection of the resistance and a potential move lower, despite the bullish intraday action.
| Indicator | Value | Signal | Interpretation |
|---|---|---|---|
| RSI (14) | 70.95 | Neutral | Overbought on 1H, Neutral on 1D |
| MACD Histogram | -0.02 | Neutral | Negative momentum on 1H, Positive on 1D |
| Stochastic | 65.73 / 73.5 | Bearish | Bearish crossover on 1H, Bullish on 1D |
| ADX | 47.51 | Bullish | Strong trend (uptrend on 1H, downtrend on 1D) |
| Bollinger Bands | Middle Band | Watch | Above middle band on 1H/4H, below on 1D |
Track markets in real-time
AI-powered analysis, technical indicators and real-time price data.
Join Our Telegram Channel
Breaking market news, AI analysis and trading signals instantly.
Join Channel