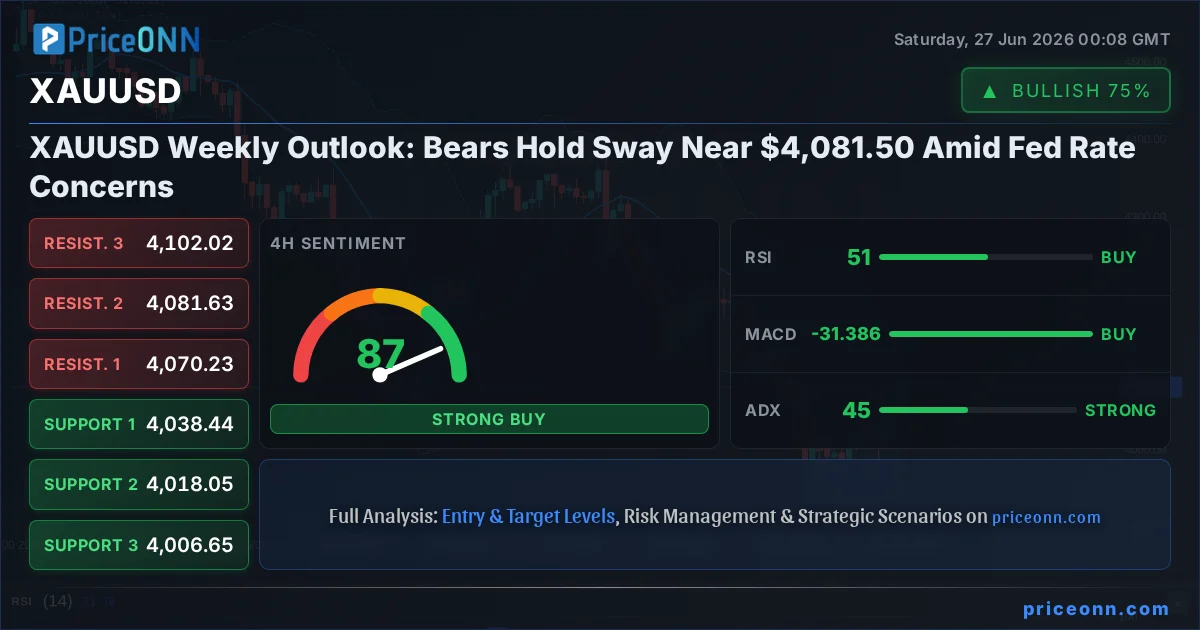
The gold market is currently locked in a fierce tug-of-war, with bears firmly in control as we head into the close of the trading week. XAUUSD is clinging precariously to the $4,081.50 level, a critical juncture that has seen significant price action throughout the past few days. While the 1-hour and 4-hour charts offer glimpses of potential upward momentum, the daily timeframe paints a decidedly grim picture, with a strong downtrend and a cascade of sell signals dominating the technical landscape. This divergence across timeframes creates a complex trading environment, demanding a nuanced approach from traders looking to navigate the volatility. The prevailing sentiment is one of caution, as market participants digest a mix of macroeconomic data, central bank rhetoric, and ongoing geopolitical undercurrents that continue to shape the precious metal's trajectory.
- RSI at 63.2 on the 1H chart signals neutral territory with a slight upward bias, but the daily RSI at 37.01 indicates significant room for further downside.
- Critical support for XAUUSD sits at $4,063.34, a level tested multiple times this week, with a break below potentially targeting $4,059.35.
- MACD on the daily timeframe shows negative momentum, with the MACD line below the signal line, suggesting bearish pressure is building.
- Fed rate hike expectations, influenced by recent PCE inflation data, are driving the correlation between XAUUSD and the DXY, which is currently trading around 101.38.
The Shifting Sands of Gold's Fortunes: A Tale of Two Markets
The narrative surrounding gold (XAUUSD) has become increasingly complex, reflecting a delicate balance between inflation concerns, central bank policy shifts, and broader market sentiment. As of the latest data, XAUUSD is trading at $4,081.50, a level that has proven to be a battleground for bulls and bears alike. The past week has been characterized by significant price swings, with the precious metal experiencing both periods of sharp decline and tentative recoveries. This volatility underscores the sensitivity of gold prices to macroeconomic indicators and monetary policy expectations. Currently, the 1-hour chart suggests a degree of bullishness, with a trend strength of 87% and a buy signal dominating. However, this short-term optimism is sharply contrasted by the daily timeframe, which screams caution, showing a strong downtrend (96% strength) and a clear sell signal across most indicators. This juxtaposition demands a deeper dive into the underlying drivers to understand where gold might be headed next.
The recent PCE inflation data, which broadly met expectations, has done little to significantly alter the Federal Reserve's hawkish leanings, at least in the short term. While the odds of an imminent rate hike might have slightly receded, the possibility remains a potent headwind for gold. The US Dollar Index (DXY), currently hovering around 101.38, acts as a crucial barometer for gold's sentiment. A strengthening dollar, often a consequence of rising rate hike expectations, typically exerts downward pressure on gold prices, as seen in the inverse correlation observed over the past few weeks. This dynamic suggests that any sustained strength in the DXY could further challenge the $4,081.50 level for XAUUSD. The market is keenly watching for any signs of a dovish pivot from the Fed, but until then, the specter of higher interest rates continues to weigh on gold's appeal as an inflation hedge.
Furthermore, the geopolitical landscape remains a significant, albeit somewhat subdued, factor. While major conflicts or escalations have not dominated headlines in the last 48 hours, underlying tensions, particularly in the Middle East, continue to contribute to a baseline level of risk aversion. This can, at times, provide a safe-haven bid for gold. However, the current market environment seems to be prioritizing inflation and interest rate dynamics over geopolitical safe-haven flows. The price action reflects this, with gold struggling to gain sustainable traction despite lingering global uncertainties. This suggests that for gold to mount a significant rally, a more pronounced shift in either central bank policy or a significant escalation of geopolitical risks would likely be required.
The Bull Case: A Short-Term Rally or a Fleeting Mirage?
Despite the dominant bearish signals on the daily chart, the short-term technicals on XAUUSD offer a glimmer of hope for the bulls. The 1-hour chart, in particular, presents an enticing picture. With a trend strength of 87% and a general buy signal, it suggests that intraday traders might be finding opportunities. The current price of $4,081.50 is finding some initial support, with immediate resistance seen at $4,075.12 and $4,082.91. The RSI(14) at 63.2 on this timeframe is comfortably in neutral territory, indicating room for upward movement before becoming overbought. Similarly, the MACD is showing positive momentum, with the MACD line trading above its signal line, a classic bullish indication. The Bollinger Bands are also supporting this narrative, with the price trading above the middle band, suggesting an upward bias in the immediate term. These indicators collectively paint a picture of short-term strength, where buyers might be stepping in to defend key intraday levels.
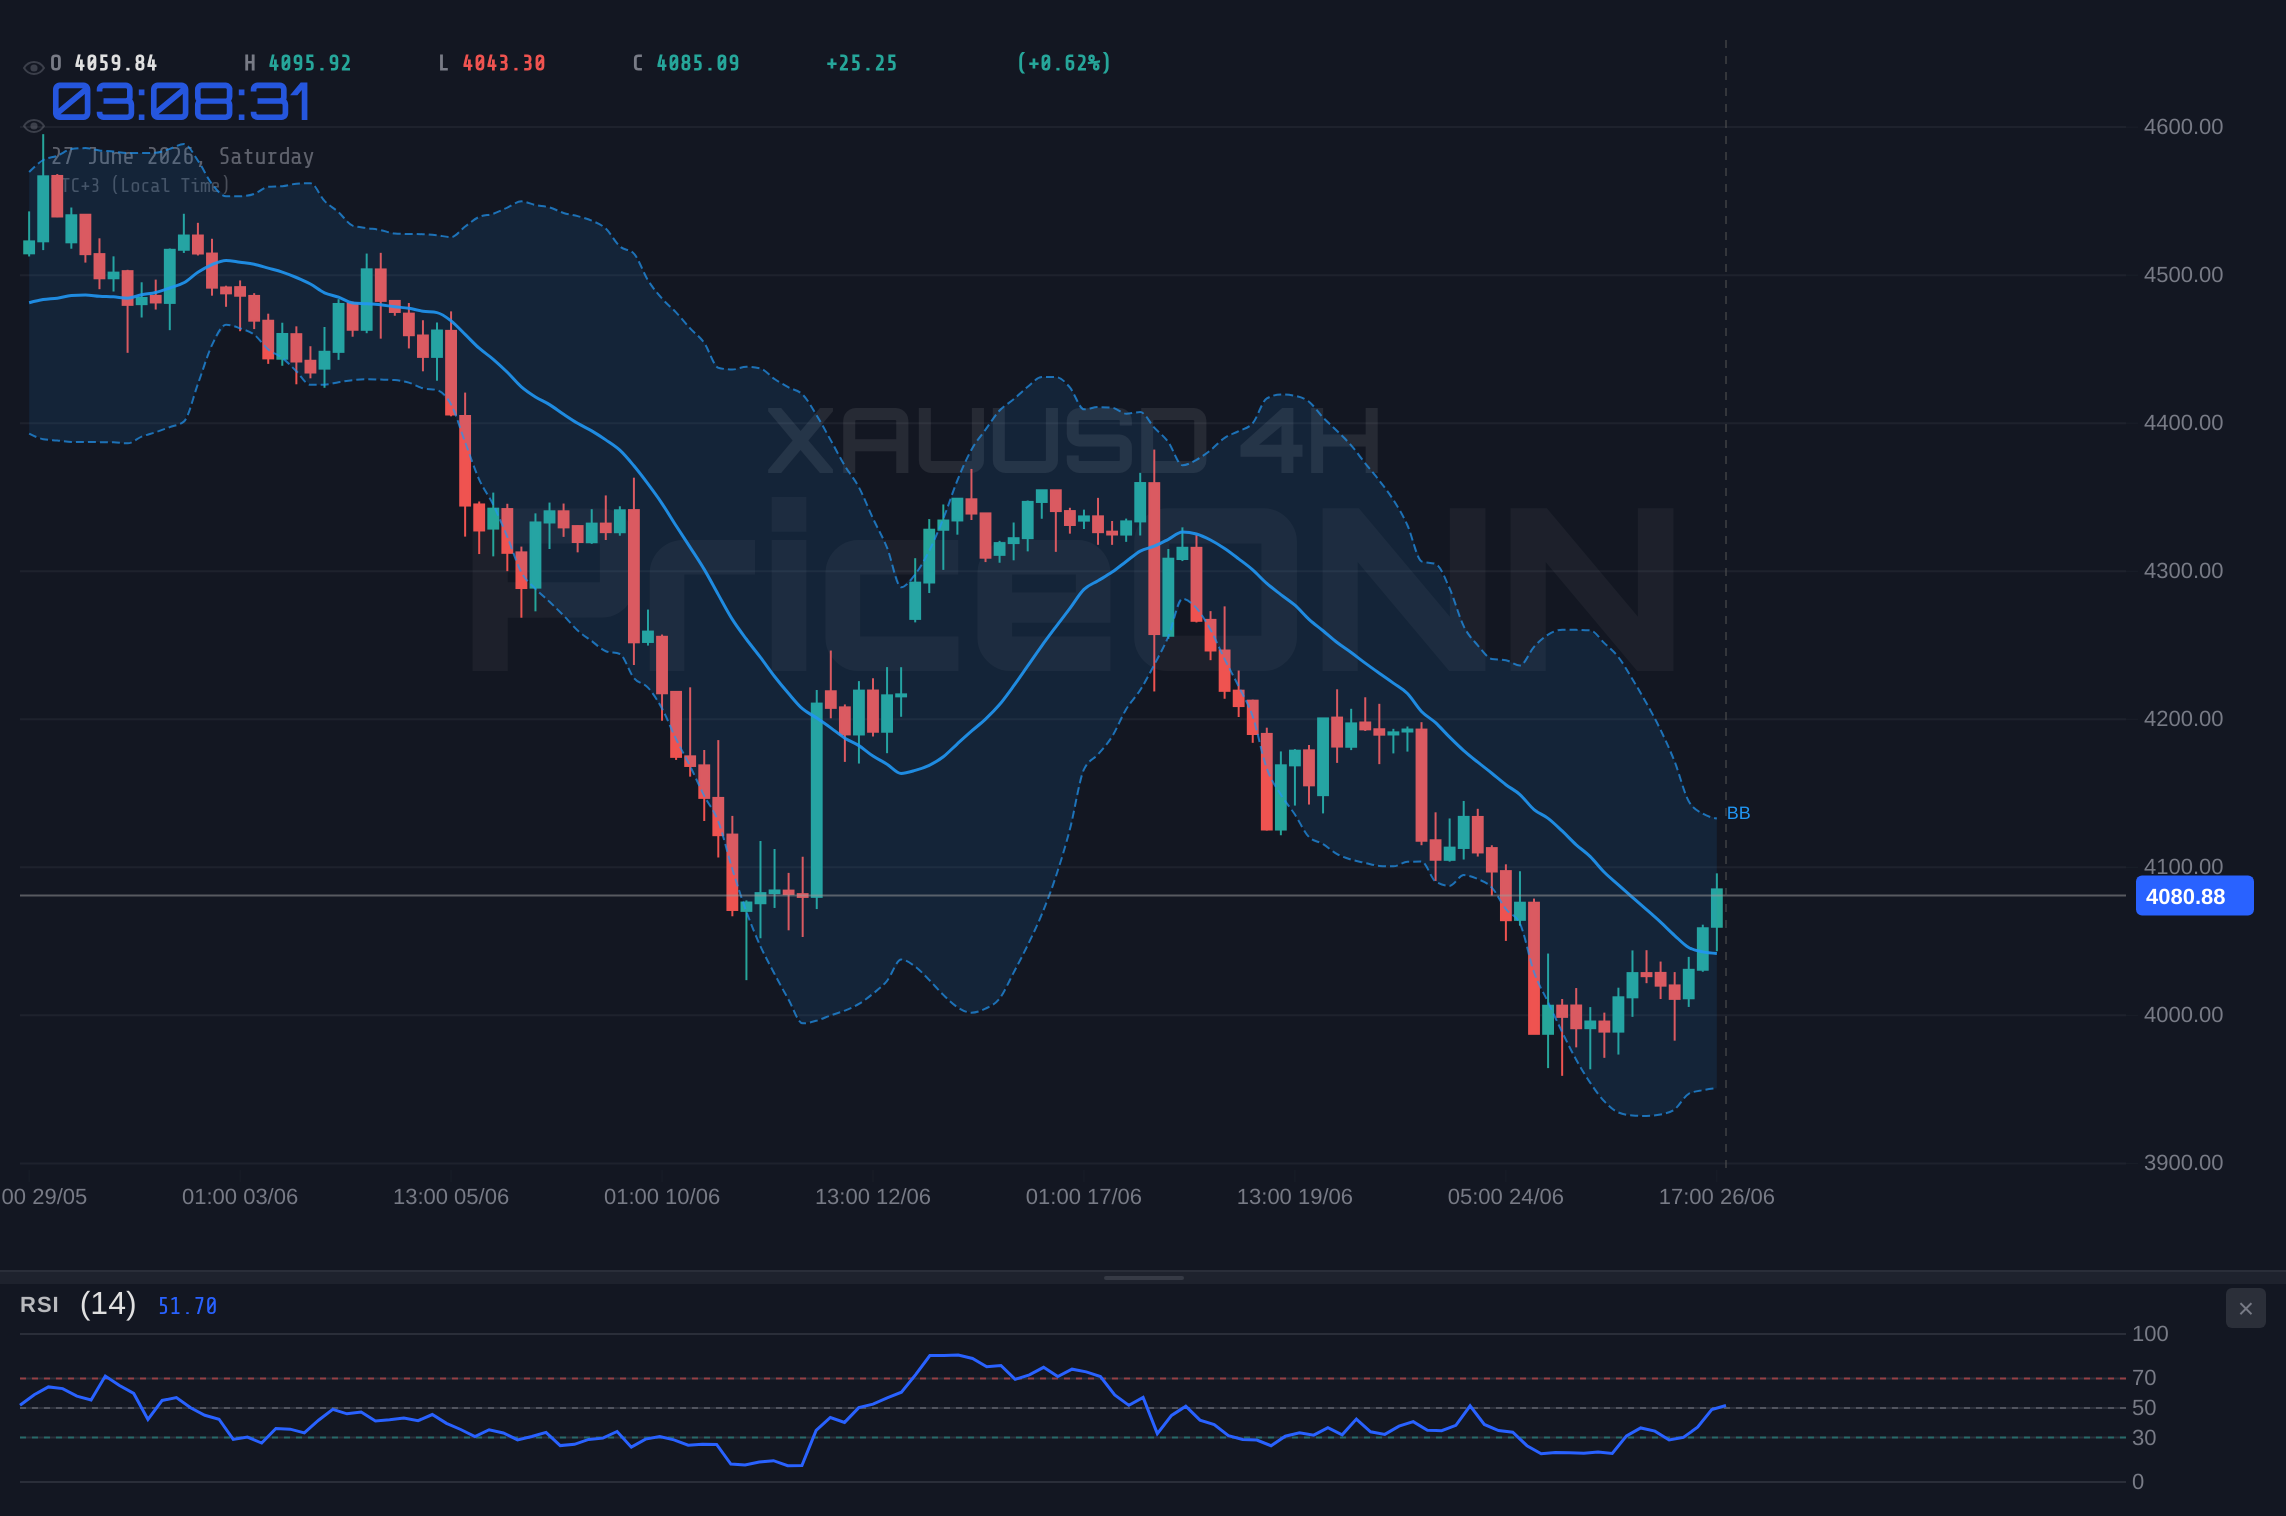
The 4-hour chart adds another layer to this short-term bullish argument. While the trend is categorized as neutral (50% strength), the indicators here also lean towards a potential upside. The RSI(14) at 51.3 is sitting right at the midpoint, showing a lack of clear directional conviction but also no immediate sign of exhaustion. The MACD here is also positive, reinforcing the idea of a potential rally. Stochastic, with K=89.83 and D=68.85, is in overbought territory, which might seem bearish, but the fact that %K is still above %D suggests that the upward momentum could potentially continue before a reversal occurs. This suggests that if the price can hold above the immediate support levels, there might be room for a test of higher resistance levels, potentially pushing towards $4,070.23 or even $4,081.63 in the short to medium term. The ADX at 45.25 on this timeframe, however, is a strong warning sign, indicating a very strong trend is in play, which, given the daily bearish outlook, could imply a strong bearish trend is being tested.
One of the primary catalysts that could fuel this short-term bullish sentiment is a potential shift in market sentiment regarding the Federal Reserve's monetary policy. If upcoming economic data, such as employment figures or consumer confidence surveys, were to significantly undershoot expectations, it could bolster the narrative of a Fed pause or even a future rate cut. Such a development would likely weaken the US Dollar, providing a direct tailwind for gold. Additionally, any unexpected geopolitical escalation, however unlikely at this moment, could trigger a flight to safety, boosting demand for gold. For the bulls, the $4,081.50 level is not just a price point; it's a psychological barrier and a potential pivot. Holding above this level, especially with positive short-term technicals, could encourage more buyers to enter the market, aiming for the resistance levels identified at $4,075.12 and $4,082.91. The key for the bulls will be to see sustained buying pressure and a clear break above immediate resistance levels, ideally supported by fundamental shifts.
The Bear Case: Dominant Downtrend and Looming Macro Headwinds
The long-term outlook for gold, as dictated by the daily timeframe analysis, is overwhelmingly bearish. The current price of $4,081.50 is finding itself under significant pressure from a well-established downtrend. The daily chart reveals a trend strength of 96%, indicating strong conviction among sellers. Immediate support levels are identified at $3,978.68, $3,930.90, and $3,898.23. These levels represent potential targets for the bears should the price continue its downward trajectory. The RSI(14) at 37.01 is firmly within the neutral zone but trending downwards, suggesting ample room for further decline before oversold conditions are met. This indicator does not offer any immediate comfort to the bulls, indicating that the selling pressure has not yet reached a point of capitulation.
The MACD on the daily chart is a stark warning for gold investors. It displays negative momentum, with the MACD line positioned below its signal line. This configuration is a classic bearish signal, suggesting that the downward trend is likely to continue. Furthermore, the Bollinger Bands are trading below the middle band, reinforcing the bearish sentiment and indicating that the price is trending lower within the bands. The Stochastic oscillator also aligns with this bearish outlook, with K=18.08 and D=31.44, both well into oversold territory and showing %K below %D – a strong sell signal. The ADX value of 41.41 on the daily chart signifies a strong downtrend is in place, suggesting that the current bearish momentum is not a fleeting anomaly but a dominant force in the market. The overall signal on the daily chart is a resounding 'SELL' (8 sell, 0 buy, 0 neutral), leaving little room for interpretation.
The fundamental backdrop further bolsters the bear case. The Federal Reserve's persistent focus on inflation control, even with recent data suggesting a slight cooling, means that the specter of higher interest rates for longer remains a significant threat. The CME FedWatch tool, reflecting market expectations, continues to price in a non-negligible probability of further rate hikes, which directly impacts gold's attractiveness. Higher yields on US Treasury bonds make holding non-yielding assets like gold less appealing. The US Dollar Index (DXY) at 101.38, despite a slight daily pullback, is still showing signs of underlying strength on the daily chart (71.59 RSI, 40.81 ADX), which acts as a consistent drag on gold prices. The narrative of a strong dollar, driven by the Fed's hawkish stance, is a powerful headwind that gold is currently struggling to overcome. Any positive news regarding US economic resilience or a less dovish tone from Fed officials could further solidify this bearish trend.
Moreover, the correlation between gold and risk assets, while sometimes inverse, has also shown periods of alignment, particularly when broader market sentiment shifts. The S&P 500 (SP500) is currently showing strength on the 1-hour and 4-hour charts, but its daily trend is identified as down, indicating potential headwinds for risk sentiment. If the stock market experiences a significant downturn, it could lead to a liquidity grab, where investors sell off assets across the board, including gold, to meet margin calls or de-risk their portfolios. While gold is often seen as a safe haven, this effect is not guaranteed, especially in a scenario of broad-based deleveraging. The current technical setup, with its strong daily downtrend signals, suggests that the path of least resistance for XAUUSD remains to the downside, with key support levels at $3,978.68 and $3,930.90 being the next logical targets for the bears.
Navigating the Crosscurrents: Key Levels and What to Watch
The current market environment for XAUUSD presents a classic bull vs. bear scenario, with the $4,081.50 price level acting as the immediate battleground. For the bulls to regain control, they must first overcome the immediate resistance at $4,075.12 and, more importantly, the psychological and technical barrier at $4,082.91. A decisive close above this level on a significant timeframe, ideally the 4-hour or daily chart, would be required to invalidate the current bearish outlook. Confirmation would come from sustained buying pressure, increasing volume, and a shift in daily technical indicators towards positive momentum. The next significant resistance level to target would then be $4,086.90, followed by the more distant $4,102.02. However, the strength of the daily downtrend suggests that such a breakout would require a substantial shift in fundamental drivers, such as a clear dovish signal from the Federal Reserve or a significant geopolitical shock.
Conversely, the bears have a clear path laid out if the $4,081.50 level fails to hold. The immediate support is at $4,063.34. A break below this level would confirm the short-term bearish bias and open the door for a retest of the $4,059.35 support. Further downside targets include $4,051.56 on the hourly chart, and more significantly, the daily support levels at $3,978.68 and $3,930.90. The confluence of bearish technical signals on the daily chart - low RSI, negative MACD, and lower Bollinger Bands - provides a strong case for further declines. The ADX at 41.41 on the daily chart indicates a strong existing trend, suggesting that a breakdown below key support could lead to a rapid acceleration of selling pressure. Traders will be watching the volume on any break below $4,063.34 very closely; a significant increase would lend further credence to the bearish thesis.
Looking ahead, the economic calendar is critical. This coming week, key events will include US Non-Farm Payrolls (NFP) data and further commentary from Federal Reserve officials. The NFP report, in particular, will be closely scrutinized for its impact on inflation expectations and Fed policy. Stronger-than-expected job growth could reinforce the narrative of economic resilience, potentially supporting the dollar and pressuring gold. Conversely, a weaker report might fuel speculation of a Fed pause, offering some relief to gold prices. Investors should also keep an eye on the broader market sentiment, as reflected in the performance of the S&P 500 and Nasdaq. A sustained sell-off in equities could either trigger safe-haven flows into gold or lead to a broader deleveraging event, depending on the underlying cause. The interplay between these factors will determine whether gold consolidates around the $4,081.50 level or makes a decisive move towards the support or resistance zones identified.
The divergence between short-term bullish signals and the dominant daily bearish trend presents a high-risk environment. Aggressive traders might attempt to play short-term bounces, but the overall bias remains to the downside until key daily resistance levels are convincingly broken or key support levels decisively fall.
Market Sentiment and the Dollar's Dominance
The current market sentiment surrounding gold is largely dictated by its intricate relationship with the US Dollar Index (DXY). As the DXY hovers around 101.38, its movements are closely watched for their implications on XAUUSD. The daily chart for the DXY shows a strong uptrend (71.59 RSI, 40.81 ADX), suggesting that the dollar may continue to find favor among investors, particularly if inflation remains sticky or the Federal Reserve maintains a hawkish stance. This sustained dollar strength acts as a significant headwind for gold, making it more expensive for holders of other currencies and reducing its appeal as a store of value. The recent PCE inflation data, while broadly matching expectations, did not provide enough dovish impetus to significantly weaken the dollar, keeping gold under pressure.
The correlation between gold and risk assets, such as the S&P 500 and Nasdaq, also plays a crucial role in shaping market sentiment. While gold is traditionally viewed as a safe-haven asset, its behavior can be complex. Currently, the S&P 500 exhibits a mixed picture, with short-term strength but a daily downtrend. The Nasdaq, on the other hand, is showing a clear daily downtrend. If risk appetite deteriorates further, leading to a significant sell-off in equities, it could trigger a flight to safety. In such a scenario, gold might benefit from increased demand as a perceived safe haven. However, if the sell-off is driven by liquidity concerns or deleveraging, gold could also be sold off alongside other assets. The ADX on the daily charts for both SP500 (47.51) and Nasdaq (20.4) indicate strong trends, suggesting that the direction of these indices will be a key determinant of overall market sentiment and, by extension, gold's performance.
The prevailing narrative favoring higher-for-longer interest rates from the Federal Reserve continues to overshadow other factors. Market participants are closely analyzing Fed speeches and economic data for any hints of a policy pivot. The Fed Fund Futures and OIS data, although not provided in the live feed, are crucial for gauging market expectations. Any indication that the Fed might be nearing the end of its tightening cycle would likely provide a significant boost to gold prices by weakening the dollar and reducing bond yields. Conversely, any rhetoric suggesting continued vigilance against inflation could reinforce the bearish case for gold. The fact that gold has shown resilience around the $4,000 mark in recent weeks, despite bearish technicals and macro headwinds, suggests that underlying demand exists, likely fueled by inflation hedging and safe-haven considerations. However, this demand appears insufficient to counteract the macro pressures at present.
For swing traders, the key is to watch the daily chart's close relative to the $4,063.34 support. A confirmed break below this level, especially on increased volume, would set the stage for a move towards $3,978.68. On the other hand, a sustained daily close above $4,082.91 would be needed to signal a potential trend reversal, targeting higher resistance levels.
The Weekly Recap: A Testing Ground for Gold
This past week has been a significant testing ground for gold prices, primarily revolving around the $4,081.50 level. As reported by PriceONN's market news, gold has been grappling with concerns over potential Fed rate hikes, which have kept it subdued below the $4,000 psychological mark for extended periods, though recent data shows it recovering above this level at times. The narrative of inflation and the Federal Reserve's stance on monetary policy have been the dominant themes, influencing gold's correlation with the US Dollar Index (DXY). While geopolitical uncertainties have provided some underlying support, they have not been potent enough to counteract the macro headwinds.
Technically, the week saw XAUUSD consolidating and then facing downward pressure around the $4,081.50 area. The daily chart has consistently shown bearish signals, with RSI hovering in the mid-30s and MACD generating negative momentum. The support levels at $4,063.34 and $4,059.35 have been under considerable strain, representing critical zones for the bulls to defend. Resistance has been encountered around $4,075.12 and $4,082.91, levels that have capped rallies. The failure to establish a firm footing above these resistance points throughout the week has reinforced the bearish bias. PriceONN's analysis highlighted gold's struggle against rate hike concerns and a strengthening dollar, suggesting that the bearish bias remained intact.
Looking ahead to the coming week, the focus will undoubtedly remain on macroeconomic data releases and central bank commentary. Key events such as the US Non-Farm Payrolls (NFP) report will be crucial in shaping expectations for the Federal Reserve's next move. A stronger-than-expected NFP could reinforce the dollar's strength and weigh further on gold, potentially pushing it towards the $3,978.68 support. Conversely, a weaker report could offer a reprieve, allowing gold to test higher resistance levels, possibly aiming for $4,086.90 and beyond. The interplay between inflation data, employment figures, and Fed rhetoric will be paramount in determining gold's direction. Traders should remain vigilant, as any significant shift in these fundamental drivers could trigger a decisive move away from the current consolidation range.
The resilience of gold around the $4,000 level, despite strong bearish technicals and macro headwinds, suggests that underlying demand for safe-haven assets remains robust. However, this demand is currently being outmatched by the pressure from potential interest rate hikes and a strengthening dollar.
The Crossroads: $4,081.50 and the Path Forward
The XAUUSD market finds itself at a critical juncture, with the $4,081.50 price level serving as a focal point for the ongoing battle between bullish and bearish forces. The daily chart's strong downtrend (96% strength) and bearish signals (RSI 37.01, negative MACD, ADX 41.41) indicate that the path of least resistance remains to the downside. Key support levels to monitor are $4,063.34, $4,059.35, and further down at $3,978.68. A decisive break below $4,063.34 would likely confirm the bearish sentiment and open the door for a test of lower levels.
However, short-term technicals on the 1-hour and 4-hour charts present a more optimistic, albeit less convincing, picture. The 1-hour chart shows a bullish trend (87% strength) with immediate resistance at $4,075.12 and $4,082.91. A sustained move above $4,082.91 could provide a temporary reprieve for gold, potentially targeting higher levels. The 4-hour chart, while neutral, also shows some positive momentum indicators. The Stochastic at 89.83 suggests overbought conditions, but %K above %D indicates potential for further upside before a reversal.
The fundamental outlook remains the primary driver. The Federal Reserve's stance on inflation and interest rates, coupled with the performance of the US Dollar Index (DXY), will be critical. Upcoming economic data, particularly the NFP report, will provide crucial clues. A stronger dollar or hawkish Fed rhetoric will likely exacerbate the bearish pressure on gold, pushing it towards its daily support levels. Conversely, signs of economic cooling or a dovish shift from the Fed could offer a much-needed boost, allowing gold to challenge its immediate resistance levels. For now, the dominant daily trend suggests caution, and any bullish Trường hợp (case) would require strong confirmation from both technical breakouts and fundamental shifts.
"Volatility creates opportunity - those prepared will be rewarded. Patient traders understand that the market always provides a second chance. Focus on risk management and wait for clear setups."
| Indicator | Value | Signal | Interpretation |
|---|---|---|---|
| RSI (14) | 63.2 | Neutral | 1H: 63.2 (Neutral), 4H: 51.3 (Neutral), 1D: 37.01 (Neutral) |
| MACD | Positive Momentum | Bullish | 1H: Above Signal, 4H: Above Signal, 1D: Below Signal (Bearish) |
| Stochastic | K=65.53, D=80.99 | Bearish | 1H: Bearish Cross, 4H: Overbought (%K > %D), 1D: Oversold (Bearish) |
| ADX | 23.35 | Bullish | 1H: 23.35 (Mid Strength Uptrend), 4H: 45.25 (Strong Downtrend), 1D: 41.41 (Strong Downtrend) |
| Bollinger | Middle Band | Watch | 1H: Above, 4H: Above, 1D: Below |
Bearish Scenario: Sustained Downtrend
65% ProbabilityNeutral Scenario: Consolidation Around $4,081.50
25% ProbabilityBullish Scenario: Short-Term Reversal
10% ProbabilityFrequently Asked Questions: XAUUSD Analysis
What happens if XAUUSD breaks below the $4,063.34 support level?
A break below $4,063.34 would confirm the bearish bias indicated by the daily chart's technicals. This could lead to a rapid decline, with the next logical target being the $4,051.56 level, followed by the significant daily support at $3,978.68.
Should I buy XAUUSD at current levels around $4,081.50 given the mixed signals?
Buying at current levels carries significant risk due to the dominant daily downtrend. While short-term charts show some bullishness, confirmation is needed. A more prudent approach would be to wait for a confirmed break above $4,082.91 resistance or a clear bounce from a lower, more significant support level with strong fundamental backing.
Is the RSI at 37.01 on the daily chart a buy signal for XAUUSD?
An RSI of 37.01 on the daily chart is in the neutral zone but trending downwards, indicating bearish momentum rather than an immediate buy signal. While it suggests that gold is not yet oversold, it also means there is substantial room for further price declines before potentially reaching oversold conditions that could signal a reversal.
How will upcoming US NFP data affect XAUUSD this week?
Stronger-than-expected NFP data could reinforce the US Dollar's strength and Fed rate hike expectations, likely pressuring XAUUSD lower towards its support levels. Conversely, weaker NFP data might fuel Fed pause speculation, potentially boosting gold prices towards its immediate resistance levels around $4,082.91.
Track markets in real-time
AI-powered analysis, technical indicators and real-time price data.
Join Our Telegram Channel
Breaking market news, AI analysis and trading signals instantly.
Join Channel