The relentless tug-of-war between bulls and bears in the WTI crude oil market is reaching a critical juncture, with the commodity currently trading around the $71.28 mark. This level, while seemingly stable, is being tested under the weight of increasingly bearish technical indicators, most notably the Relative Strength Index (RSI). As traders and analysts dissect the charts, a palpable tension emerges: is this a temporary pause before a renewed ascent, or are the signs pointing towards a more significant downturn? This analysis delves into the intricate interplay of technical signals, macroeconomic undercurrents, and geopolitical factors shaping WTI's immediate future, aiming to decipher whether the current weakness signals a strategic buying opportunity or a precursor to further declines.
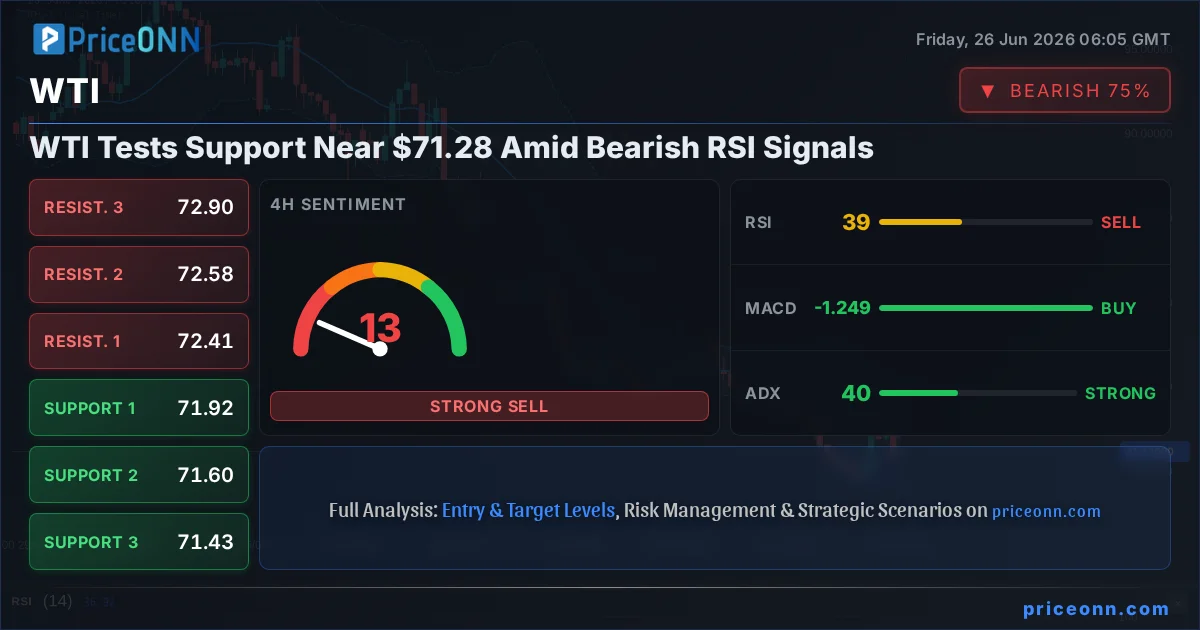
- WTI crude oil is trading near $71.28, showing a bearish trend across multiple timeframes.
- The RSI is at 48.96 on the 1H chart, indicating a bearish trend, and at 38.78 on the 4H, signaling caution. The daily RSI at 29.2 suggests oversold conditions.
- Key support levels are identified at $70.77, $70.68, and $70.52 on the hourly chart, while resistance is seen at $71.02, $71.18, and $71.27.
- Broader market correlations with DXY and equity indices suggest a risk-off environment could pressure oil prices further.
The Bearish Case: Momentum Fades, Support Threatened
The immediate technical picture for WTI crude oil paints a predominantly bearish narrative. On the 1-hour chart, the trend is firmly in the bearish camp, with a power of 93%. The current price of $71.28 is finding immediate resistance at $71.02, $71.18, and $71.27. More critically, the support levels are clustered around $70.77, $70.68, and $70.52. The RSI(14) at 48.96 on this timeframe, while not overtly oversold, clearly indicates a bearish trend, reinforcing the downward pressure. The MACD is also showing negative momentum, with the MACD line sitting below its signal line, a classic bearish signal. Bollinger Bands on the 1H chart are positioned below the middle band, further supporting the bearish inclination.
Escalating this bearish outlook, the 4-hour timeframe reveals a more potent trend. Here, the trend is also categorized as bearish with a power of 100%. The ADX at 40.45 confirms a strong downtrend, suggesting that any upward price action is likely to face significant headwinds. The RSI(14) at 38.78 on the 4H chart reinforces the bearish sentiment, although it's not yet in extreme oversold territory. The Stochastic indicator, however, presents a mixed signal on this timeframe: K=68.06 and D=38.64 show a bullish crossover (%K > %D), which could hint at a potential short-term bounce. Yet, the overall signal remains heavily skewed towards selling, with 6 out of 8 indicators suggesting a sell. The price is below the middle Bollinger Band, indicating bearish pressure.
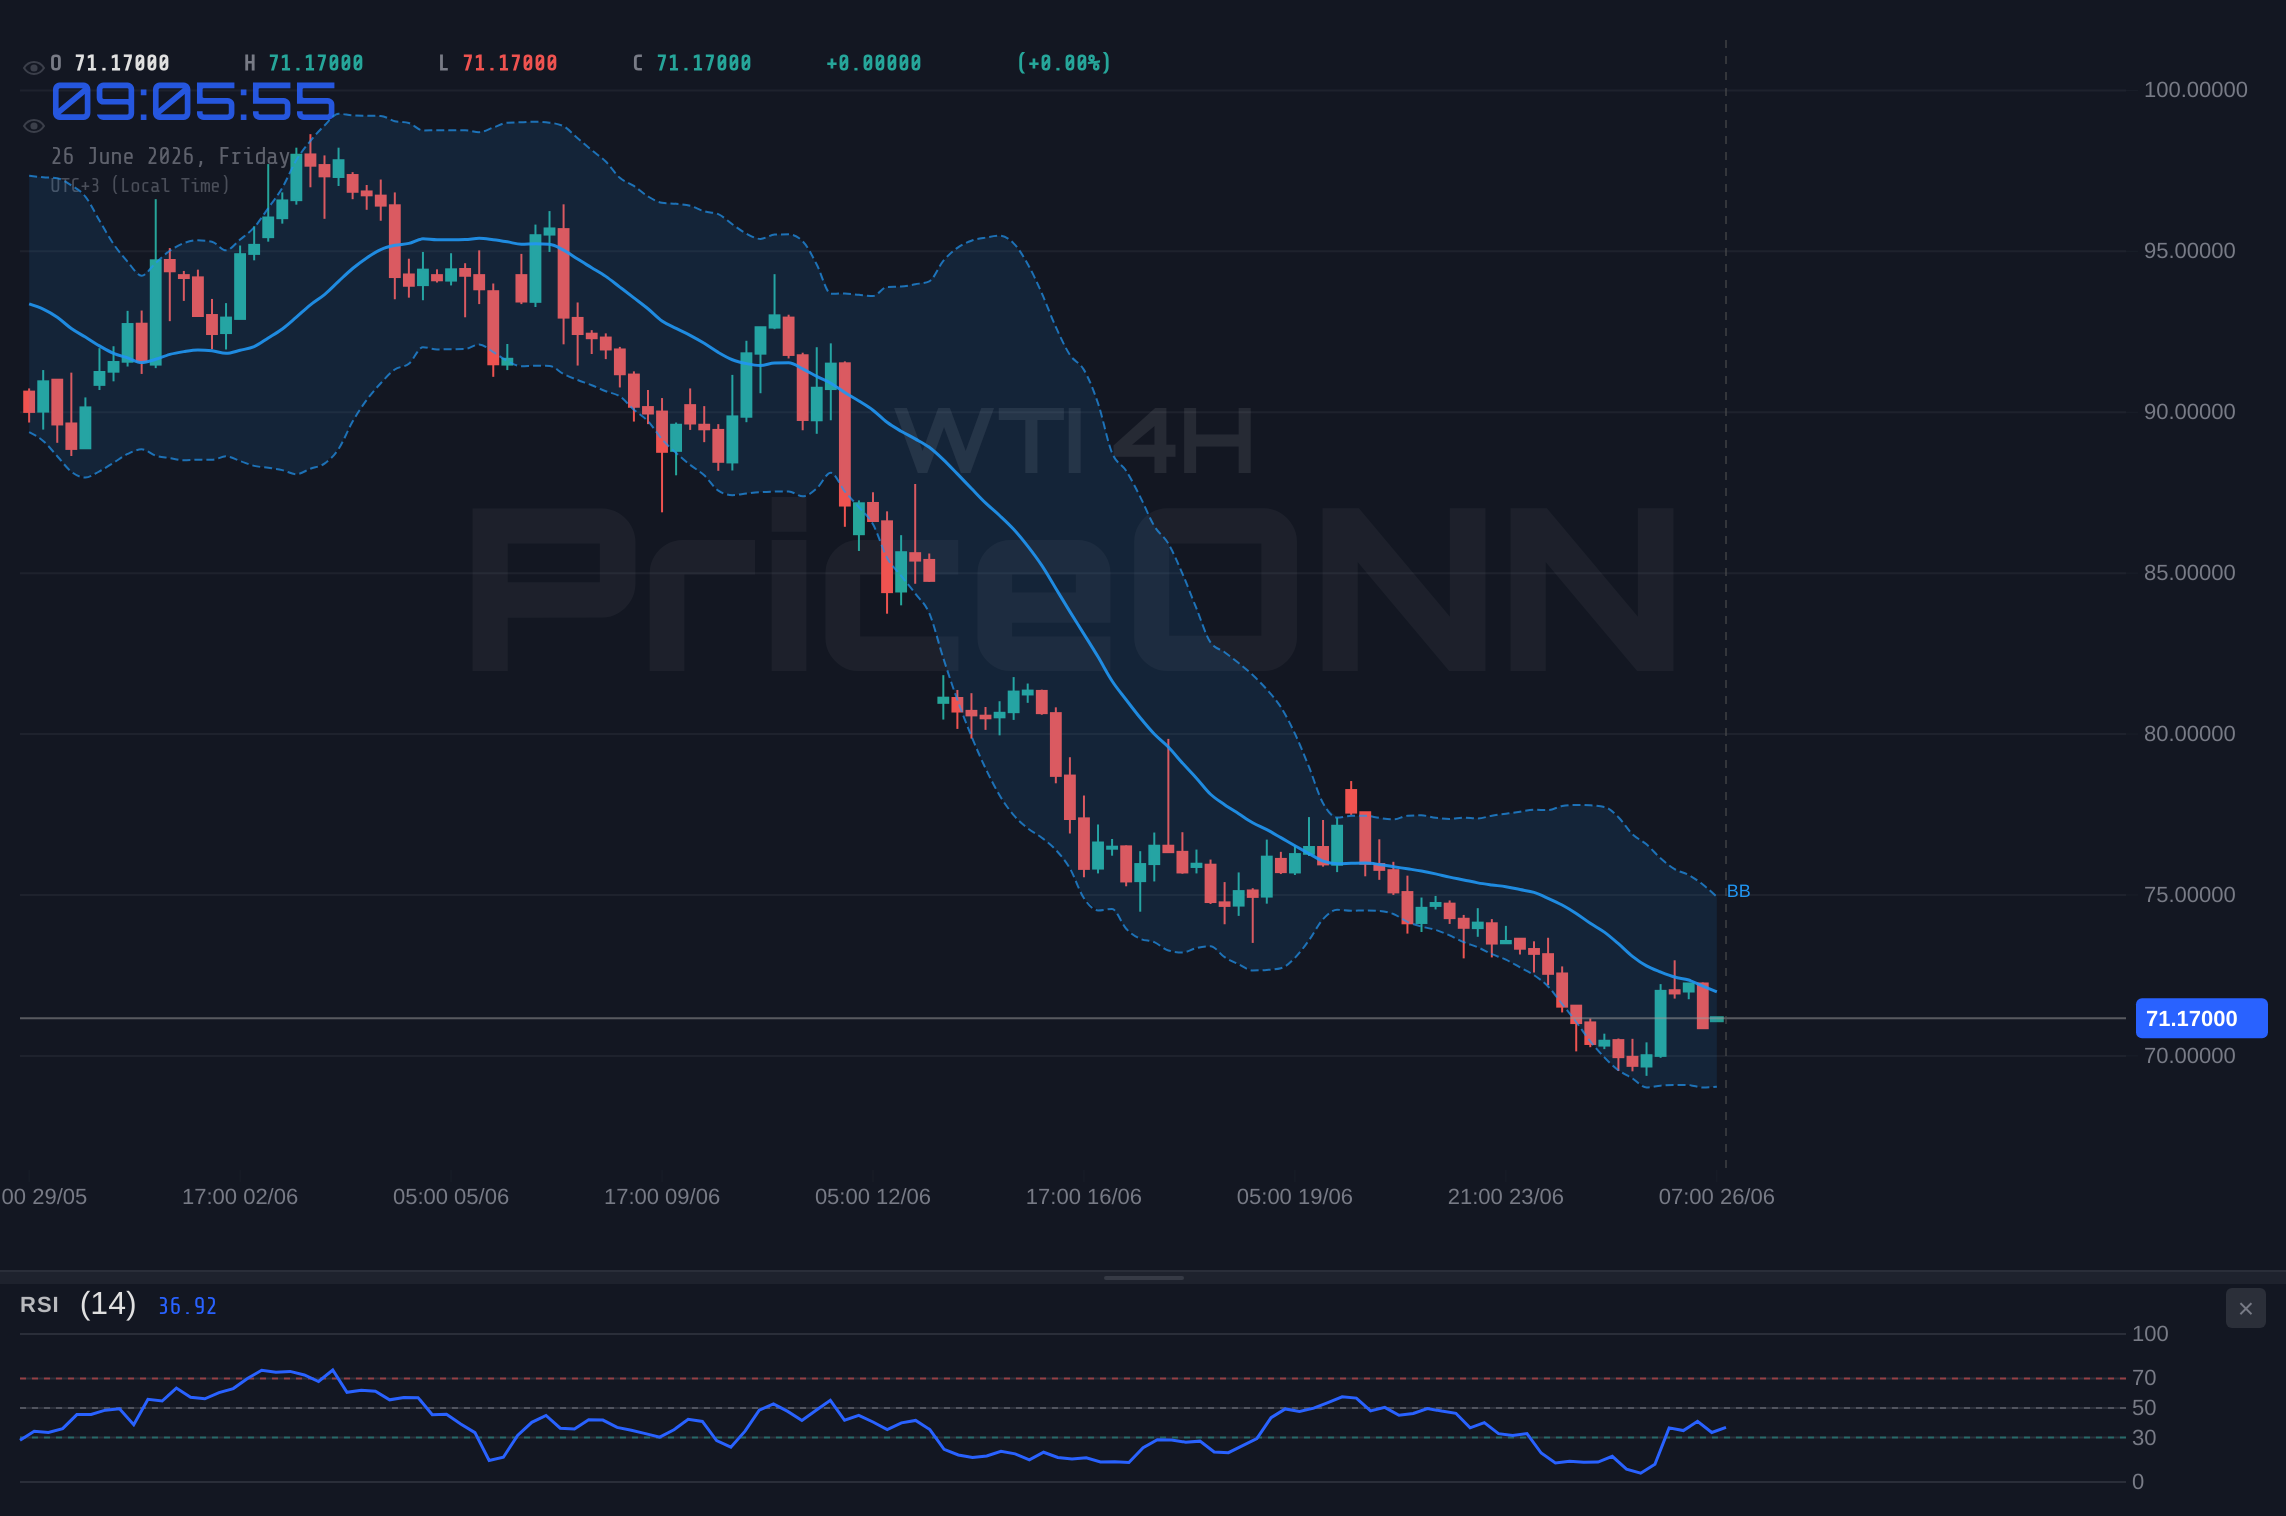
The daily chart solidifies the bearish thesis, painting a picture of an asset potentially heading towards oversold conditions. The trend is a strong 100% bearish, with the ADX at 31.82 indicating a strong downtrend. The RSI(14) has fallen to 29.2, placing it squarely in oversold territory. This reading often precedes a bounce, but in a strong downtrend, it can also signal capitulation or a deeper slide. The MACD is negative, and Stochastic is showing K=12.48, D=9.19, firmly in oversold territory with a bearish signal (%K
The Macroeconomic Headwinds: DXY Strength and Risk Aversion
The pressure on WTI is not solely an isolated technical phenomenon; it's amplified by broader macroeconomic trends and market correlations. The Dollar Index (DXY) is currently trading at 101.42 and showing a strong bullish trend on the 4-hour (100% power) and daily (100% power) charts. A strengthening dollar typically exerts downward pressure on commodities priced in USD, like crude oil, as they become more expensive for holders of other currencies. The DXY's daily RSI at 72.4 is in overbought territory, indicating potential for further dollar strength or at least a consolidation at high levels, which would continue to weigh on oil prices.
Furthermore, the risk appetite in the broader market is showing signs of waning. The SP500 index, currently at 6572.87, is experiencing a bearish trend on its daily timeframe (100% power), despite a recent uptick. Its RSI at 45.35 suggests room for further decline. Similarly, the Nasdaq 100, trading at 29025.68, exhibits a bearish trend across its hourly (88% power) and 4-hour (97% power) charts. This 'risk-off' sentiment typically leads investors away from riskier assets like commodities and towards safer havens. In such an environment, oil, often sensitive to global growth expectations, can suffer as demand forecasts are revised downwards. The recent news highlighting a drop in the Euro to a one-year low due to cooling oil prices and fueling ECB rate cut bets underscores this interconnectedness between energy prices, currency strength, and monetary policy expectations.
Central bank policy remains a significant overhang. While the immediate focus might be on the US Federal Reserve, the global monetary policy landscape is crucial. If major central banks continue to signal a hawkish stance or maintain higher-for-longer interest rate narratives, it could dampen global economic growth prospects. This, in turn, would reduce projected oil demand, providing a fundamental basis for the bearish technical signals observed in WTI. The market is keenly watching for any shifts in inflation data, such as CPI or PCE releases, which could influence future rate decisions and, consequently, commodity prices.
The Bullish Counter-Argument: Oversold Conditions and Geopolitical Wildcards
Despite the prevailing bearish technicals and macroeconomic headwinds, a case for a potential bullish reversal can be constructed, primarily centered on the oversold conditions on longer timeframes and the ever-present geopolitical risks that can swiftly alter the energy market landscape. On the daily chart, the RSI has dipped to 29.2. Historically, readings below 30 on the daily RSI have often marked significant turning points, suggesting that WTI may be approaching a level where sellers become exhausted, and buyers might step in to capture value. The Stochastic indicator on the daily chart also reflects this oversold condition, with %K at 12.48 and %D at 9.19.
The 4-hour chart, while showing strong bearish momentum (ADX at 40.45), also presents a conflicting signal with the Stochastic crossover (%K > %D) and a bullish signal from the MACD momentum on this timeframe. This divergence between the overall trend strength and specific indicator signals can sometimes precede a short-term correction or bounce. While the trend is decidedly down, the oversold readings on the daily and the potential for a Stochastic crossover on the 4-hour chart suggest that a bounce from current levels near $71.28 is not entirely out of the question, especially if triggered by external factors.
Geopolitics remains the ultimate wildcard in the oil market. Recent news regarding easing tensions between the United States and Iran, while contributing to the current price drop, could be a temporary reprieve. Any escalation or unexpected flare-up in the Middle East, a region critical for global oil supply, could instantly reverse the bearish sentiment and send prices sharply higher. Similarly, developments related to the Russia-Ukraine conflict, OPEC+ production decisions, or unexpected supply disruptions due to weather or infrastructure issues can dramatically shift the market's focus from demand concerns to supply shortages. The market is always pricing in a certain level of geopolitical risk premium, and any perceived increase in that premium can lead to rapid price appreciation.
Furthermore, the fundamental demand picture, while currently overshadowed by recession fears, might not be as dire as the bearish sentiment suggests. Emerging economies, particularly India, are projected to maintain strong growth trajectories. As reported, India's economy could return to a 7% growth trajectory if oil prices remain around the $70 mark. This sustained demand from major consumers, coupled with potential supply constraints from OPEC+ adherence or underinvestment in new production capacity, could provide a floor for prices, even amidst broader economic uncertainty. The narrative around AI's energy demands, while nascent, also represents a potential long-term demand driver that could counteract some of the cyclical downturns.
Navigating the Crossroads: What the Data Tells Us
The current technical landscape for WTI presents a clear conflict. On lower timeframes (1H and 4H), the trend is overwhelmingly bearish, supported by RSI readings in bearish territory and strong ADX values indicating a committed downtrend. The price action below key resistance levels, coupled with negative MACD momentum, paints a picture of downward pressure. However, the daily chart is flashing oversold signals with its RSI at 29.2 and Stochastic deeply in the buy zone, suggesting that the current downtrend might be overextended from a longer-term perspective.
This divergence between short-term bearishness and long-term oversold conditions creates a precarious situation. A break below the immediate hourly supports at $70.77, $70.68, or $70.52 could accelerate the slide towards the daily support levels near $69.89 and $67.84. Such a move would invalidate any short-term bullish hopes and confirm the daily bearish trend. Conversely, a failure to break these immediate supports, coupled with a positive catalyst - perhaps a surprisingly strong US employment report, a hawkish shift in central bank rhetoric that fails to materialize, or a sudden geopolitical development - could see WTI bounce back towards the $71.02 and $71.18 resistance levels. The strong ADX on the 4H (40.45) and daily (31.82) charts indicates that the prevailing trend has significant strength, making a sustained reversal challenging without a fundamental shift.
The correlation with the DXY at 101.42 and its overbought RSI (72.4) suggests that any pullback in the dollar could offer a reprieve for oil prices. Similarly, a shift in risk sentiment, perhaps a stabilization or recovery in the SP500 and Nasdaq, could reduce the pressure on WTI. The market is at a crossroads where both further downside and a short-term bounce are plausible scenarios. The key will be how price action behaves around the critical $70.50-$71.28 range. A decisive break below $70.50 would likely signal a continuation of the downtrend, targeting lower levels. A hold and bounce from this area, especially above $71.28, could initiate a corrective rally, but it would need to overcome significant resistance and bearish momentum indicators.
The Verdict: Caution Prevails, But Opportunity Lurks
Given the current data, the most prudent approach for traders and investors is one of caution, leaning towards the bearish bias on lower timeframes while acknowledging the potential for a bounce from oversold conditions on the daily chart. The strong bearish trend indicators across multiple timeframes, particularly the ADX and RSI, suggest that the path of least resistance for WTI crude oil remains downwards in the short to medium term. The immediate resistance at $71.28 is formidable, and breaking through it would require a significant shift in market sentiment or a clear catalyst.
However, the oversold daily RSI at 29.2 cannot be ignored. This suggests that while further downside is possible, the magnitude of any subsequent move might be limited, and the potential for a technical bounce is elevated. Traders should remain vigilant for signs of capitulation or strong buying pressure emerging around the $70.50-$69.89 support zone. A failure to break these levels decisively, especially with increasing volume, could signal the start of a corrective move higher. The interplay between the strong dollar and risk-off sentiment, currently weighing on oil, remains a critical factor to monitor. Any weakening in the DXY or a recovery in equity markets could provide the necessary tailwind for a WTI rebound.
Ultimately, the market is at an inflection point. The bearish technicals are compelling, but the oversold daily signals and the ever-present geopolitical risks introduce an element of uncertainty. For now, the trend is down, and any rallies should be treated with skepticism until key resistance levels are convincingly broken. The $70.50 - $71.28 range is crucial; a hold here could lead to a bounce, while a break below signals further decline. Patience and risk management will be paramount in navigating this complex environment.
Frequently Asked Questions: WTI Analysis
What happens if WTI breaks below the $70.50 support level?
If WTI breaks decisively below the $70.50 support level, the bearish trend is likely to accelerate. The daily chart's strong bearish trend (ADX at 31.82) and oversold RSI (29.2) suggest that such a break could lead to a sharp decline towards the next key supports identified at $69.89 and potentially $67.84. This would confirm the market's current risk-off sentiment and demand concerns.
Should I consider buying WTI at current levels around $71.28 given the oversold daily RSI?
Buying at current levels around $71.28, despite the daily RSI being oversold at 29.2, carries significant risk due to the strong bearish trend on lower timeframes. While a bounce is possible, it's advisable to wait for confirmation, such as a close above $71.28 resistance or signs of bullish divergence on lower timeframes. A more conservative approach would be to look for buying opportunities closer to the $69.89 support level, with strict risk management.
Is the RSI at 29.2 on the daily chart a strong sell signal for WTI?
An RSI reading of 29.2 on the daily chart is technically in oversold territory, which typically suggests a potential for a price bounce rather than a strong sell signal. However, in the context of a strong prevailing downtrend (confirmed by ADX 31.82), it indicates that the selling pressure has been significant and that the market might be approaching exhaustion. It's more of a warning sign for bears and a potential buy-the-dip signal for contrarians, rather than a direct sell signal.
How will the strengthening DXY at 101.42 affect WTI prices this week?
The strengthening Dollar Index (DXY), currently at 101.42 with an overbought RSI of 72.4 on the daily chart, is expected to continue exerting downward pressure on WTI prices. This inverse correlation means that as the dollar gains strength, oil becomes more expensive for non-dollar buyers, potentially dampening demand and contributing to lower prices. Traders should monitor the DXY for any signs of a pullback, as this could offer some relief to WTI.
Technical Outlook Summary
| Indicator | Value | Signal | Interpretation |
|---|---|---|---|
| RSI (14) | 48.96 | Neutral | Bearish trend on 1H, but nearing oversold on Daily (29.2) |
| MACD | Negative | Bearish | Negative momentum on 1H and Daily |
| Stochastic | K=10.6, D=9.19 | Bearish | Oversold on Daily, bearish crossover on Daily |
| ADX | 31.82 | Bullish | Strong downtrend confirmed on Daily |
| Bollinger Bands | Below Middle Band | Bearish | Suggests downward pressure across timeframes |
Key Levels
Bearish Scenario: Downside Acceleration
70% ProbabilityNeutral Scenario: Range-Bound Consolidation
20% ProbabilityBullish Scenario: Short-Covering Rally
10% ProbabilityTrack markets in real-time
AI-powered analysis, technical indicators and real-time price data.
Join Our Telegram Channel
Breaking market news, AI analysis and trading signals instantly.
Join Channel