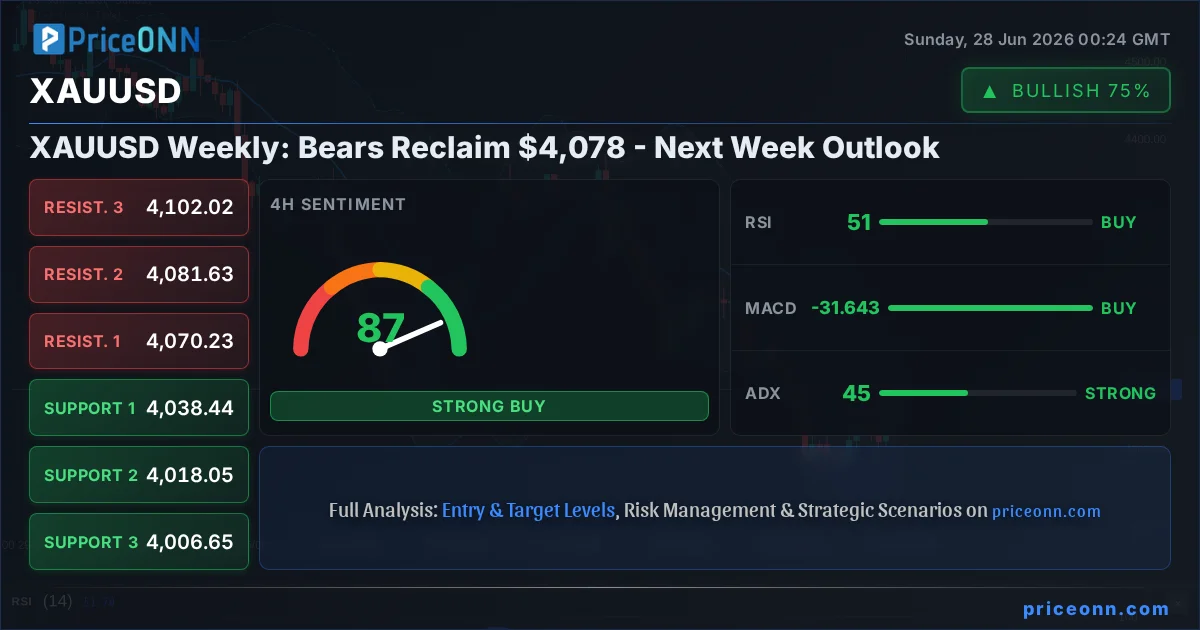
The gold market is at a critical juncture. After a period of bullish momentum that saw prices flirt with higher levels, the bears have firmly reasserted control, pushing XAUUSD back below the significant $4,078.27 mark. This reversal, occurring as we close out the trading week, is not just a minor pullback; it signals a potential shift in sentiment that traders must understand to navigate the coming days. The charts are speaking, and they’re whispering caution for gold bugs, even as certain indicators hint at underlying strength that could be tested in the week ahead.
- RSI at 62.32 on the 1H chart signals overbought conditions are easing, but the overall trend remains cautious.
- Critical support sits at $4,063.34, tested multiple times this week, with further levels at $4,059.35 and $4,051.56.
- The DXY strengthening above 101.34 is a key driver, putting pressure on gold due to its inverse correlation.
- Upcoming economic events, particularly labor market data and central bank commentary, will be crucial for shaping the next move.
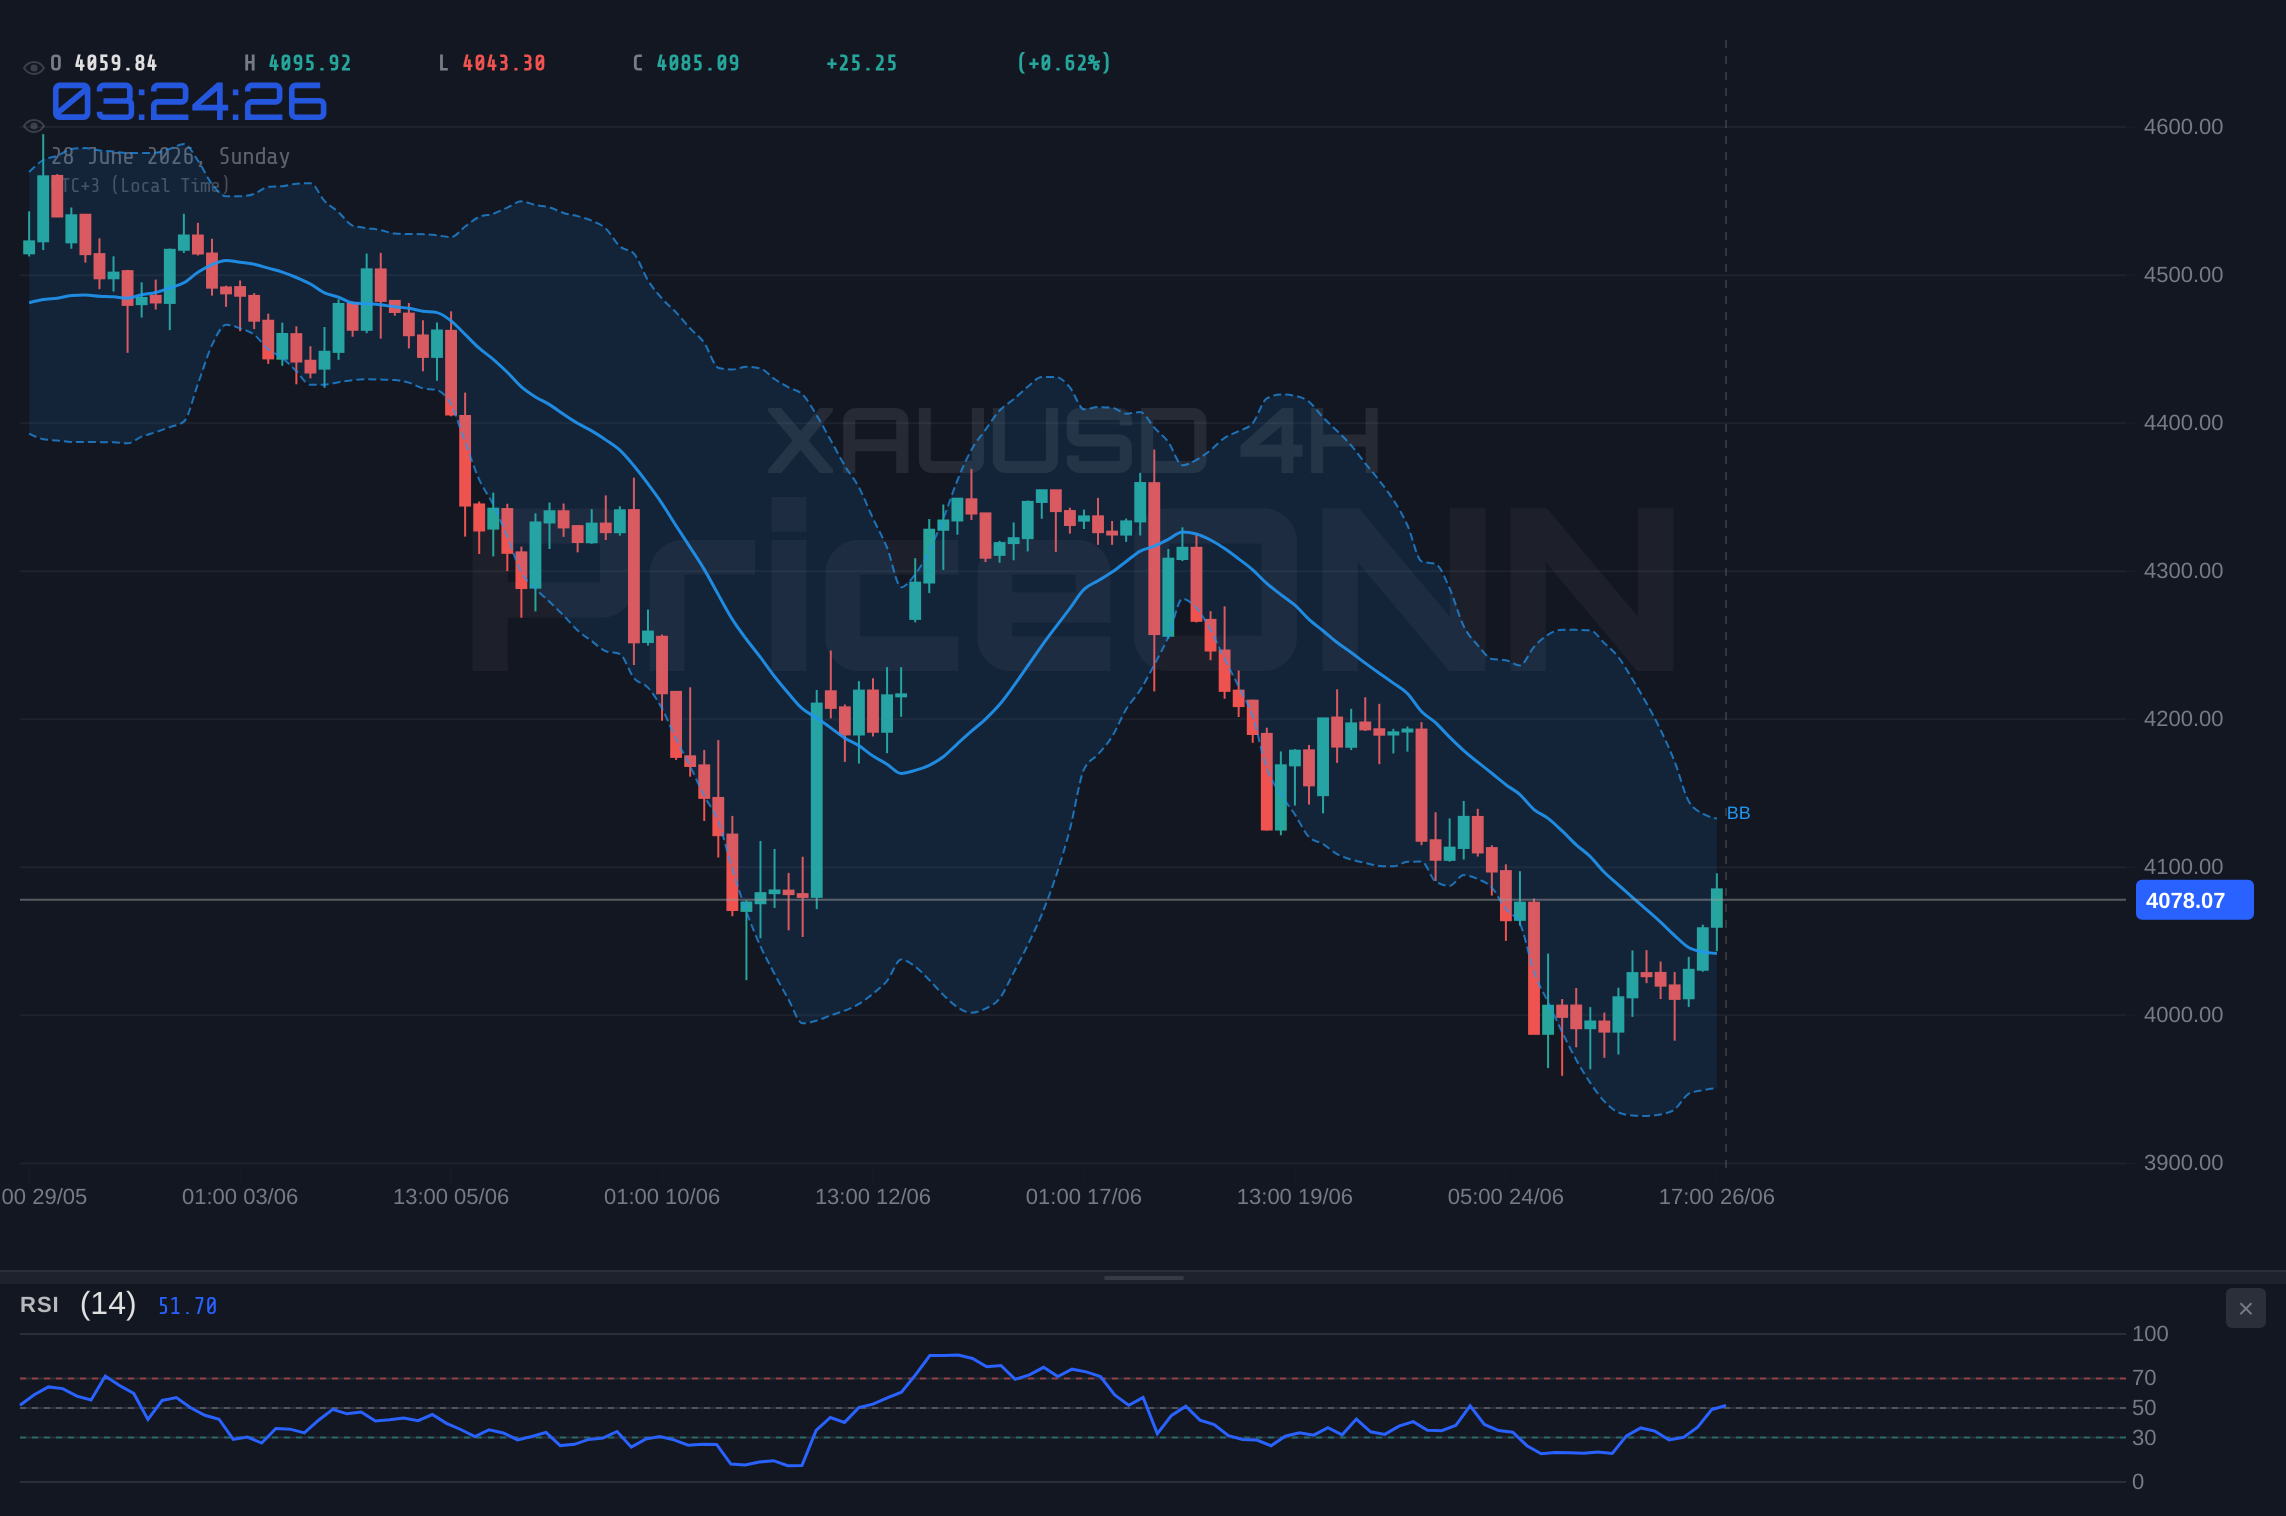
Last week was a tumultuous one for gold, characterized by a sharp reversal that saw prices shed significant gains. The precious metal, which had been showing signs of life, succumbed to renewed selling pressure, driven by a confluence of factors including a strengthening US Dollar and shifting expectations around central bank monetary policy. The daily chart paints a stark picture: a clear downtrend remains in play, with the price action failing to decisively break through key resistance levels. While short-term indicators on the 1-hour timeframe might offer glimpses of potential pullbacks, the overarching sentiment, particularly on the daily and 4-hour charts, suggests that the path of least resistance for XAUUSD is currently to the downside. This analysis delves into the technical and fundamental forces at play, offering a strategic outlook for the week ahead.
The Dollar's Resurgence and Its Impact on Gold
The US Dollar Index (DXY) has been a dominant force in recent market movements, and its performance directly correlates with the trajectory of gold prices. As the DXY strengthened this past week, trading above 101.34, it exerted significant downward pressure on XAUUSD. This inverse relationship is a cornerstone of forex and commodity trading. A stronger dollar makes gold, priced in dollars, more expensive for holders of other currencies, thereby dampening demand. Furthermore, a robust dollar often signals investor confidence in the US economy or a perceived increase in the likelihood of higher interest rates, both of which tend to reduce the appeal of non-yielding safe-haven assets like gold. The latest market data shows the DXY at 101.34, indicating a consolidation phase after recent gains, but the underlying strength remains a key factor to monitor.
The narrative around Federal Reserve policy is intrinsically linked to the dollar's strength and, consequently, gold's performance. Recent economic data, including the PCE inflation figures, have painted a mixed picture. While inflation has shown signs of cooling, the labor market remains relatively stable, as indicated by recent economic week-ahead reports suggesting that the current pace of hiring may not be sustained. This leaves the Fed in a delicate balancing act. Any hint of hawkishness – a suggestion that interest rates might stay higher for longer or even rise further – could bolster the dollar and weigh on gold. Conversely, signs of economic weakening or a dovish pivot from the Fed would likely support gold prices. The market is keenly awaiting further commentary from Fed officials and upcoming economic releases to gauge the future path of monetary policy.
Technical Landscape: A Battle for Key Levels
From a technical standpoint, XAUUSD is navigating a challenging landscape. The 1-hour chart, which often captures short-term sentiment, shows a trend that is currently neutral with a bullish inclination, indicated by a strength of 86%. However, this is juxtaposed against a daily trend that is firmly in the bearish camp with 96% strength. The immediate support level to watch on the 1-hour chart is $4,063.34. This level has been tested, and a decisive break below it could signal further downside towards $4,059.35 and $4,051.56. On the resistance side, $4,075.12, $4,082.91, and $4,086.90 are the immediate hurdles.
The RSI on the 1-hour chart sits at 62.32, a level that is neither definitively overbought nor oversold, but it does suggest that the recent upward momentum is moderating. The MACD is showing positive momentum, with the MACD line above the signal line, but this is within the context of a broader daily bearish trend. The Stochastic Oscillator, with K at 63.74 and D at 80.77, is showing a bearish signal (%K
Stepping back to the 4-hour timeframe, the picture becomes more mixed, with a neutral trend and 50% strength. Here, support levels are found at $4,038.44, $4,018.05, and $4,006.65, while resistance looms at $4,070.23, $4,081.63, and $4,102.02. The RSI at 50.7 is hovering right at the neutral zone, providing no clear directional bias but showing an upward inclination. The MACD again shows positive momentum. However, the Stochastic Oscillator is significantly overbought with K at 88.96 and D at 68.71, indicating a potential reversal is brewing on this timeframe. The ADX at 45.25 is concerning for bulls, suggesting a strong downtrend is in play on this intermediate timeframe, contradicting the bullish signals from other indicators. This confluence of conflicting signals across different timeframes highlights the uncertainty and potential for volatility.
Daily Chart: The Dominant Bearish Narrative
The daily chart provides the most critical context for XAUUSD's current predicament. Here, the trend is undeniably bearish, with a formidable 96% strength. The price has fallen significantly below key moving averages, with the Bollinger Bands showing the price trading below the middle band, indicating a bearish inclination. The RSI is at 36.77, firmly in neutral territory but trending downwards, suggesting further room for price declines before reaching oversold conditions. The MACD is deeply negative, with the MACD line well below the signal line, confirming strong bearish momentum. The Stochastic Oscillator is also in oversold territory, with K at 17.83 and D at 31.4, signaling a potential for a short-term bounce, but this is within the context of a powerful downtrend.
The ADX on the daily chart stands at 41.41, confirming a strong, established downtrend. This is a critical piece of information for any trader considering positions in gold. The support levels on this timeframe are substantial: $3,978.68, $3,930.90, and $3,898.23. These are the levels that bulls must defend if they are to have any hope of halting the current sell-off. Conversely, resistance is stacked above the current price, with the first significant hurdle at $4,059.13, followed by $4,091.80 and $4,139.58. The fact that the price is currently trading at $4,078.27, well below the first daily resistance level, underscores the bearish technical picture. The average 'General Signal' across all timeframes leans heavily towards 'SELL', with the daily timeframe showing a unanimous sell signal.
Correlations and Macroeconomic Undercurrents
Understanding the interplay between XAUUSD, the DXY, and broader market sentiment is crucial. As mentioned, the DXY's recent strength has been a major headwind for gold. The index’s move above 101.34 suggests a risk-off sentiment or a strengthening US economy, both typically bearish for gold. Conversely, a weakening DXY would likely provide a tailwind for gold. The current DXY reading of 101.34 suggests a potential pause, but the underlying trend on the daily chart is bullish (100% strength), which could continue to pressure gold.
Equity markets, particularly the S&P 500 and Nasdaq, also play a significant role. The S&P 500 is currently trading at 6572.87, showing a strong daily gain of 0.74%. However, the Nasdaq 100 has experienced a notable decline, down 1.58% to 28988.09. This divergence can create uncertainty. Generally, a falling Nasdaq, which represents growth and tech stocks, can signal a decline in risk appetite. In such 'risk-off' environments, investors often flock to safe-haven assets like gold. However, if the dollar strengthens concurrently, as it has been, this safe-haven demand for gold can be negated. The conflicting signals from the stock indices themselves add another layer of complexity, suggesting that traders should closely watch for clear directional cues from either equities or the dollar.
The energy market, specifically Brent and WTI crude oil prices, also provides context. Both benchmarks are currently in a downtrend, trading at $73.42 and $70.66 respectively. Falling oil prices can sometimes be interpreted as a sign of weakening global demand, which could be bearish for commodities in general, including gold. However, oil prices are also sensitive to geopolitical tensions. Any escalation in global conflicts could quickly reverse this trend and boost oil prices, potentially spilling over into inflation expectations and increasing gold's appeal as an inflation hedge. Currently, the bearish trend in oil suggests that immediate inflationary pressures from energy may be subsiding, removing one potential catalyst for gold.
The Role of Inflation and Interest Rate Expectations
Inflation remains a central theme in financial markets, and its trajectory is a key determinant of gold's future. While recent PCE inflation data broadly matched expectations, the underlying persistence of inflation, as suggested by some economic reports, keeps central banks on alert. The European Central Bank (ECB) survey indicating that one-year forward inflation expectations have cooled to 3.5% is a notable development for the Eurozone, potentially influencing the ECB's monetary policy decisions. For gold, persistently high inflation typically acts as a tailwind, as investors seek the metal as a store of value against currency debasement. However, this effect is often counteracted if central banks respond by aggressively hiking interest rates.
The market's anticipation of future interest rate hikes is heavily influenced by economic data and central bank communications. The fading odds of further Fed rate hikes, as suggested by the recent weakening of the US Dollar Index below 101.50, could theoretically be supportive of gold. Yet, the current price action in XAUUSD, coupled with the strong daily downtrend, indicates that this potential support is not yet being fully realized. Traders are likely waiting for more definitive signals from upcoming economic events, such as Non-Farm Payrolls (NFP) or further central bank speeches, to confirm a shift in the interest rate environment. The delicate balance between inflation concerns and the threat of economic slowdown due to high rates is what makes gold's outlook so complex right now.
Navigating the Week Ahead: Key Levels and Events
Looking ahead, the focus will remain on key economic releases and central bank rhetoric. The upcoming week's economic calendar will be crucial. Any significant deviations in labor market data, inflation reports, or manufacturing indices could trigger sharp moves in gold. Traders will be particularly attuned to any signals that might influence the Federal Reserve's next policy decision. The current technical setup on the daily chart for XAUUSD is bearish, with strong downtrend indicators like ADX at 41.41. The immediate support at $4,063.34 is the first line of defense. A break below this could accelerate selling towards $4,059.35 and potentially $4,051.56.
On the upside, resistance is capped around the $4,075.12 to $4,086.90 range on the 1-hour chart. A sustained move above the daily resistance at $4,059.13 would be the first sign of a potential bullish turnaround, but given the current market structure, this seems unlikely without a significant catalyst. The confluence of a strong dollar, bearish daily technicals, and neutral-to-bearish longer-term indicators suggests that caution is the prudent approach. While short-term fluctuations are possible, the broader trend favors further downside unless key resistance levels are decisively breached with strong conviction and volume.
Bearish Scenario: Downside Momentum Continues
70% ProbabilityNeutral Scenario: Consolidation Around Key Levels
20% ProbabilityBullish Scenario: Reversal Potential Emerges
10% ProbabilityThe current setup on the daily chart is heavily skewed towards the bears. While short-term traders might find opportunities in the 1-hour fluctuations, any significant long position should be approached with extreme caution. A sustained move above the $4,080-$4,090 area would be needed to even consider a bullish reversal, and even then, the daily trend resistance at $4,139.58 remains a significant hurdle. For now, the focus should be on managing risk and identifying potential short opportunities on pullbacks, provided they align with the dominant bearish trend.
Frequently Asked Questions: XAUUSD Analysis
What happens if XAUUSD breaks below $4,063.34 support?
A break below $4,063.34 on the 1-hour chart would likely trigger further selling pressure, targeting the next support levels at $4,059.35 and $4,051.56. This would confirm the bearish sentiment indicated by the daily chart's ADX at 41.41.
Should I consider buying XAUUSD at current levels around $4,078.27 given the oversold Stochastic on the 4H chart?
While the 4-hour Stochastic at 88.96 is overbought, the dominant daily trend remains bearish (ADX 41.41). Buying here carries significant risk unless accompanied by a clear bullish breakout above daily resistance near $4,059.13, which is currently unlikely.
Is the RSI at 62.32 on the 1H chart a sell signal for XAUUSD?
An RSI of 62.32 is not a definitive sell signal; it indicates some upward momentum but is not yet in overbought territory. However, in the context of the stronger bearish signals on longer timeframes, it suggests that any short-term bullish attempts may be losing steam and could be vulnerable.
How will upcoming labor market data affect XAUUSD this week?
Stronger-than-expected labor market data could bolster the US Dollar and reinforce Fed rate hike expectations, likely pushing XAUUSD lower towards its support levels. Conversely, weaker data might weaken the dollar and provide some relief for gold, potentially testing short-term resistance.
The gold market finds itself at a critical crossroads. The recent price action, culminating in a move back below $4,078.27, has firmly placed the bears in the driver's seat. While short-term charts might offer flickers of hope for a bounce, the overwhelming technical evidence on the daily timeframe points towards continued downside pressure. The strengthening dollar and the complex interplay of inflation expectations and central bank policy will continue to dictate the narrative. For traders, patience and disciplined risk management are paramount. Waiting for clear confirmation of a trend reversal or for prices to reach more attractive levels, while respecting the established support and resistance zones, will be key to navigating this challenging market environment. Volatility creates opportunity - those prepared will be rewarded.
| Indicator | Value | Signal | Interpretation |
|---|---|---|---|
| RSI (14) | 62.32 | Neutral | Easing overbought pressure on 1H, but overall trend is bearish. |
| MACD Histogram | +0.52 | Bullish | Positive momentum on 1H, but overall daily trend is negative. |
| Stochastic | K=63.74, D=80.77 | Bearish | %K |
| ADX | 22.98 | Bullish | Moderately strong uptrend on 1H, but daily ADX is 41.41 (strong downtrend). |
| Bollinger | Middle Band | Watch | Price is above middle band on 1H, but below on 4H and 1D. |
Track markets in real-time
AI-powered analysis, technical indicators and real-time price data.
Join Our Telegram Channel
Breaking market news, AI analysis and trading signals instantly.
Join Channel