The question on every trader's mind: Is BTCUSD's current consolidation around $61,504 a pause before the next leg up, or a precarious perch before a significant pullback? After a period of strong upward momentum, Bitcoin has entered a phase of indecision, trading between key support and resistance levels. This critical juncture demands a closer look at the technical indicators, broader market correlations, and the fundamental forces shaping investor sentiment. Understanding the interplay of these elements is crucial for navigating the choppy waters ahead.
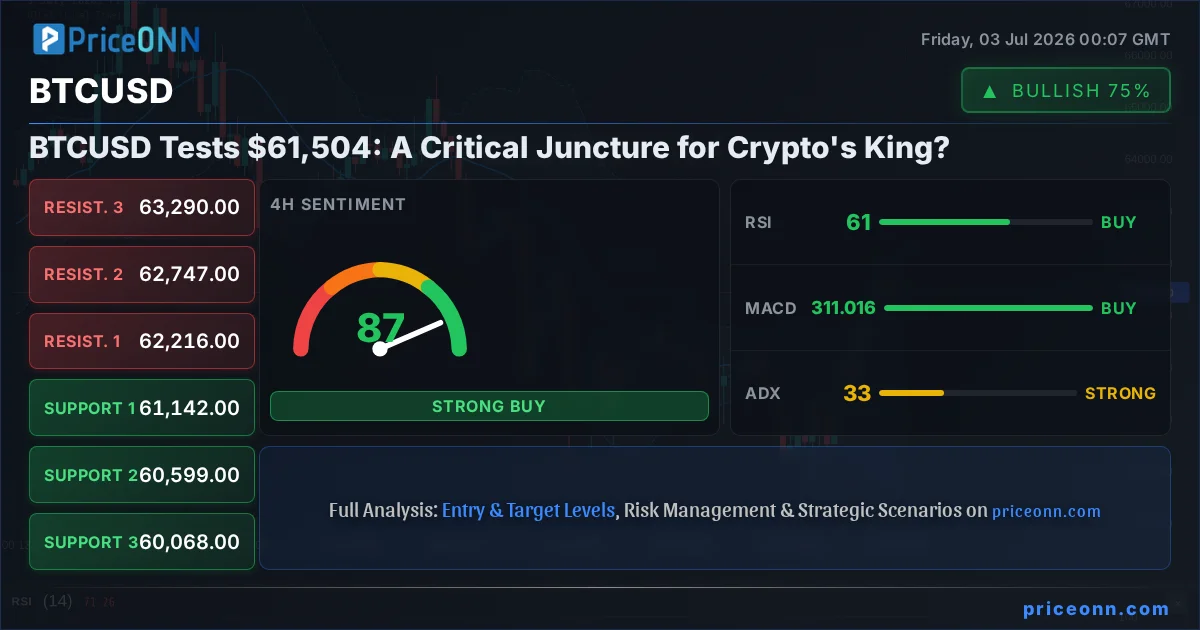
- BTCUSD is currently trading around $61,504, showing signs of consolidation after a recent rally.
- The 1-hour chart indicates a strong bullish trend (88% strength) with RSI at 66.47, but the daily chart shows a bearish trend (ADX 41.65).
- Critical support for BTCUSD is identified at $61,386, while resistance looms at $61,575, forming a tight range.
- The DXY (Dollar Index) is showing a bearish trend on the 4H chart at 100.67, potentially supporting risk assets like BTCUSD.
Navigating the $61,504 Battleground: A Multi-Timeframe Snapshot
The immediate price action for BTCUSD, currently hovering around the $61,504 mark, presents a classic case of market indecision. On the 1-hour timeframe, the trend indicators paint a decidedly bullish picture, with an 88% strength rating and a strong ADX of 35.2, suggesting a robust uptrend is in play. The RSI(14) at 66.47, while entering neutral territory, still leans towards buyers, and the MACD shows positive momentum with the signal line below. Stochastic oscillators also favor a bullish continuation, with %K at 72.09 and %D at 70.4. This short-term bullish bias is further reinforced by the overall signal of 'BUY' derived from the 1H indicators, with 8 out of 8 indicators suggesting a buy.
However, shifting focus to the daily chart paints a starkly different narrative. Here, the ADX at 41.65 signals a strong *downward* trend, a significant divergence from the 1-hour view. The RSI(14) is at 43.77, indicating a bearish leaning within the neutral zone. The MACD, while showing positive momentum, is below its signal line, and Bollinger Bands are trending below the middle band, suggesting downward pressure. The daily signal is a clear 'SELL', with 5 out of 8 indicators pointing south. This stark contrast between short-term optimism and longer-term bearish signals creates the current $61,504 stalemate, highlighting the importance of multi-timeframe analysis for any serious BTCUSD today analysis.
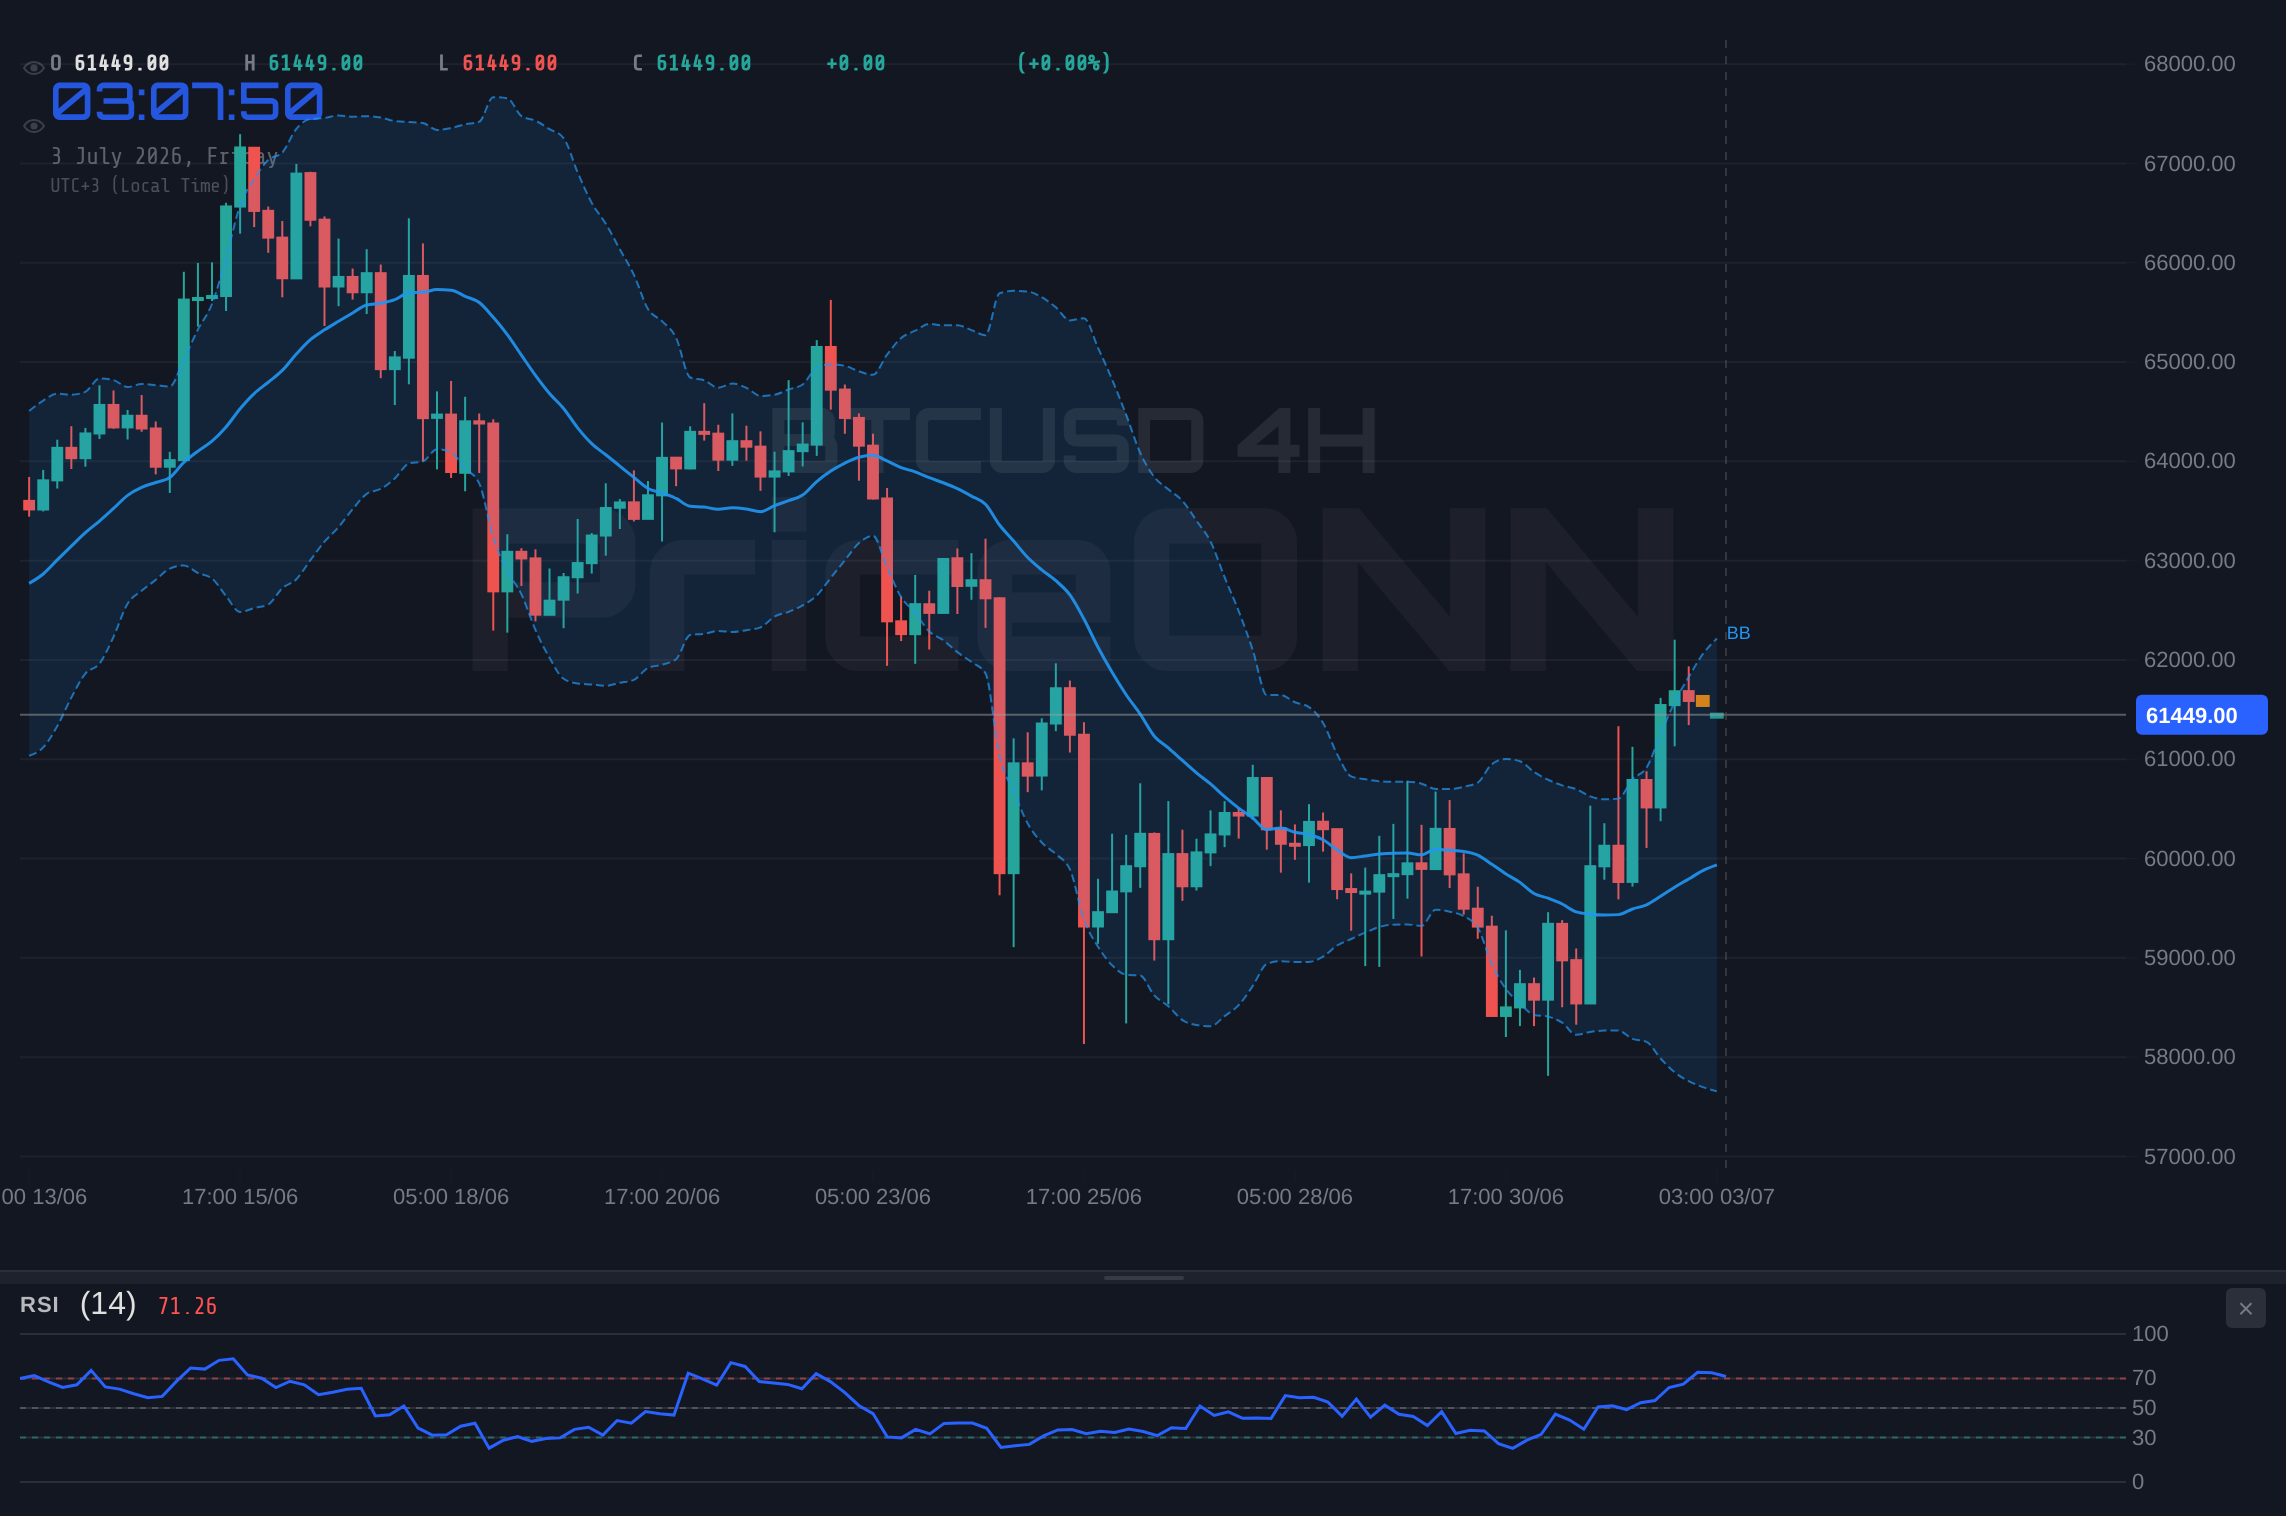
The 4-hour chart offers a middle ground, leaning towards neutrality with a 50% trend strength but still showing a bullish inclination in its general signal (7 buys, 1 sell). The RSI at 65.17 remains in neutral territory, while the Stochastic K line at 88.89 is deeply into overbought territory, potentially signaling an impending pullback. The ADX at 31.22 still indicates a strong trend, but the conflicting signals across timeframes underscore the volatility inherent in crypto markets. This divergence is precisely what creates the current price action around $61,504, where bulls and bears are locked in a tug-of-war, waiting for a decisive catalyst.
The Macro Backdrop: DXY's Weakness and Equity Market Puzzles
Understanding the BTCUSD price action requires looking beyond the immediate chart patterns to the broader macroeconomic landscape. The US Dollar Index (DXY) is currently exhibiting a bearish trend on the 4-hour chart, trading at 100.67, with a strong downward ADX of 22.49. This weakening dollar environment is typically a tailwind for risk assets, including cryptocurrencies like Bitcoin. Historically, a decline in the DXY often correlates with an increase in demand for assets perceived as higher risk or inflation hedges. If this inverse correlation holds, the current dollar weakness could provide underlying support for BTCUSD, even amidst short-term technical headwinds.
The equity markets present a more complex picture. The S&P 500 (SP500) is showing a strong upward trend on the 1-hour chart (100% strength, ADX 49.72) and a bullish general signal, trading at 6572.87. However, its daily chart paints a different story, indicating a bearish trend (ADX 47.51) with a 'SELL' signal. Similarly, the Nasdaq 100 (Nasdaq) shows a bearish trend on the 1-hour chart (89% strength, ADX 27.83) at 29352.13, despite a neutral daily outlook. This divergence within the stock market itself - strength in the S&P 500's intraday action contrasted with longer-term bearish signals and Nasdaq's intraday weakness - adds a layer of uncertainty. Such mixed signals in traditional markets can lead to broader risk aversion, potentially impacting BTCUSD's correlation with equities and its ability to capitalize on dollar weakness.
The juxtaposition of a weakening dollar and mixed equity market signals creates a nuanced environment for BTCUSD. While dollar weakness might typically propel Bitcoin higher, the conflicting signals from major stock indices suggest that 'risk-on' sentiment is not fully established. Traders are likely weighing the potential for a Fed pivot or rate cuts against persistent inflation concerns and geopolitical uncertainties. This macro uncertainty is a key factor contributing to the consolidation observed around $61,504. The market is seeking clarity on the direction of monetary policy and the overall health of the global economy before committing to a significant directional move.
Key Levels and Price Action: The $61,386 Support and $61,575 Resistance
Delving deeper into the BTCUSD chart structure, the immediate price action around $61,504 is defined by critical support and resistance levels. On the 1-hour chart, the first line of defense is identified at $61,386, followed by $61,304 and $61,197. A decisive break below $61,386 could trigger further selling pressure, potentially leading to a retest of lower levels. Conversely, the immediate resistance stands at $61,575, with subsequent hurdles at $61,682 and $61,764. The narrow range between these levels - a mere $191 difference - underscores the current equilibrium and the high probability of a volatile breakout once this range is breached.
The daily support levels, significantly lower at $58,449.67, $56,770.33, and $55,728.67, serve as a stark reminder of the broader bearish trend indicated by the daily ADX of 41.65. These levels are crucial for long-term holders and swing traders to monitor, as a failure to hold the immediate $61,386 support could open the door to a much larger correction. On the resistance side, the daily targets of $61,170.67, $62,212.33, and $63,891.67 suggest that a sustained move higher would require overcoming significant selling pressure, particularly around the $62,212 mark.
The current price battle at $61,504 is essentially a fight for control within this tight intraday range. The strength of the 1-hour bullish signals suggests that buyers are attempting to defend the lower bounds, aiming to push price towards the $61,575 resistance. However, the conflicting daily indicators and the potential for broader market risk aversion, as suggested by the mixed equity performance and the significant daily ADX for BTCUSD itself, mean that a breakout to the upside is far from guaranteed. Traders must watch for volume confirmation on any break of these immediate levels; a low-volume move is more likely to be a false breakout, or 'stop hunt', leading to a reversal.
Fundamental Drivers and Upcoming Catalysts
While technical analysis provides a roadmap of potential price movements, the underlying fundamental drivers are what ultimately dictate market direction. For BTCUSD, the narrative remains heavily influenced by macroeconomic factors and central bank policy expectations. The current weakening of the DXY, trading at 100.67 on the 4H chart, is a significant tailwind. This dollar weakness is often interpreted as a sign of easing global liquidity conditions or expectations of future rate cuts, both of which can be bullish for risk assets like Bitcoin. If the US Dollar Index continues its descent, particularly if it breaks below key support levels, it could provide the necessary fuel for a BTCUSD breakout above $61,575.
The upcoming economic calendar is packed with potentially market-moving events. Key US employment data, such as Non-Farm Payrolls (NFP), and inflation figures like CPI, are crucial. Stronger-than-expected NFP or hotter inflation prints could complicate the Federal Reserve's path, potentially leading to a more hawkish stance or delaying anticipated rate cuts. This would likely strengthen the DXY and put pressure on BTCUSD. Conversely, weaker employment numbers or cooling inflation would bolster expectations for Fed rate cuts, reinforcing the bullish case for Bitcoin and potentially driving it towards its daily resistance levels. The market is in a delicate dance, reacting to every economic datapoint as it tries to price in the future trajectory of monetary policy.
Geopolitical tensions also continue to play a role, albeit indirectly. While not directly linked to BTCUSD in the way oil prices are to Middle Eastern conflicts, global instability can influence risk appetite. A sudden escalation of geopolitical events could trigger a flight to safety, strengthening the DXY and potentially dampening demand for cryptocurrencies. However, in recent cycles, Bitcoin has sometimes acted as a partial safe-haven asset itself, particularly against currency debasement fears. The current market sentiment, as reflected in the mixed equity signals, suggests that traders are cautious but not yet in full 'risk-off' mode. The interplay between monetary policy expectations and geopolitical stability will be key in determining whether BTCUSD can sustain a rally past the $61,504 consolidation zone.
Scenario Analysis: Betting on the Breakout
Bullish Scenario: The Breakout Ignites
60% ProbabilityNeutral Scenario: Range-Bound Grind
25% ProbabilityBearish Scenario: Support Crumbles
15% ProbabilityThe current technical setup, particularly the strong bullish signals on the 1-hour timeframe and the favorable DXY trend, suggests that the path of least resistance might be to the upside. A decisive break above the $61,575 resistance, especially if accompanied by increasing volume and positive news flow regarding upcoming economic data or central bank policy shifts, could initiate a significant upward move. The targets would then be the daily resistance levels, starting with $61,764 and then the more critical $62,212. This scenario is given a 60% probability, reflecting the immediate bullish indicators.
However, the persistent bearish signals on the daily chart cannot be ignored. The ADX at 41.65 on the daily timeframe indicates a strong trend, and if this trend is to the downside, a failure to break resistance at $61,575 could lead to a swift reversal. The invalidation of the bullish scenario would occur on a close below the immediate 1-hour support at $61,386. Should this level give way, the bearish scenario becomes more probable, with targets potentially extending down to the 4-hour support at $60,599. This downside remains a significant risk, especially if upcoming economic data proves unfavorable for risk assets.
The neutral scenario, where BTCUSD grinds sideways within its current range, is assigned a 25% probability. This outcome is likely if economic data releases are mixed or if geopolitical events introduce uncertainty without a clear direction. In such a case, volatility might remain elevated within the $61,197 to $61,575 range, offering opportunities for range-bound trading strategies but lacking the conviction for a strong directional bias. Patience will be key; waiting for a clear breakout or breakdown from this consolidation zone is crucial for managing risk effectively.
Frequently Asked Questions: BTCUSD Analysis
What happens if BTCUSD breaks decisively above the $61,575 resistance level?
A sustained close above $61,575, especially with strong volume, would invalidate the current consolidation and likely trigger a move towards the next daily resistance at $62,212. This bullish scenario is supported by the intraday technicals and potential dollar weakness.
Should I buy BTCUSD at current levels around $61,504 given the mixed signals?
Given the conflicting signals between the 1-hour bullish trend and the daily bearish trend, caution is advised. A high-probability entry would require confirmation of a breakout above $61,575 or a clear bounce from the $61,386 support with increasing volume.
Is the RSI at 66.47 on the 1H chart a sell signal for BTCUSD right now?
An RSI of 66.47 on the 1-hour chart is in the neutral zone, leaning towards bullish. While it indicates upward momentum, it's not yet in the overbought territory (typically above 70) that would signal an immediate sell. It suggests buyers are still active but potentially losing steam.
How will upcoming US NFP data affect BTCUSD this week, given the current $61,504 price?
Stronger-than-expected NFP data could strengthen the dollar and pressure BTCUSD, potentially invalidating the bullish scenario. Conversely, weaker NFP would likely boost risk assets, supporting a move towards $62,212, aligning with the current bullish technical setup.
The battle for $61,504 is far from over. While short-term indicators flash green, the longer-term daily trend and the overarching macroeconomic uncertainties demand respect. The upcoming economic data releases will be the ultimate arbiter, potentially providing the catalyst needed to break this consolidation. For now, patience and disciplined risk management are paramount. Traders should await clear confirmation of a breakout or breakdown, rather than trying to anticipate the market's next move prematurely. The market always provides a second chance; waiting for the right setup is the hallmark of a seasoned trader.
Technical Outlook Summary
| Indicator | Value | Signal | Interpretation |
|---|---|---|---|
| RSI (14) | 66.47 | Neutral | Approaching overbought on 1H, but within neutral on Daily. |
| MACD Histogram | Positive | Bullish | Momentum positive on 1H, but daily trend is bearish. |
| Stochastic | K:72.09, D:70.4 | Bullish | Bullish signal on 1H, but K line approaching overbought. |
| ADX | 35.2 | Strong Trend | Strong uptrend on 1H, but strong downtrend on Daily (41.65). |
| Bollinger Bands | Mid Band + | Bullish | Above mid band on 1H, below on Daily. |
Key Levels
Support Levels
Resistance Levels
Track markets in real-time
AI-powered analysis, technical indicators and real-time price data.
Join Our Telegram Channel
Breaking market news, AI analysis and trading signals instantly.
Join Channel