As Bitcoin (BTCUSD) hovers precariously around the $60,164.00 mark, the market is holding its breath. This critical juncture isn't just another price point; it represents a significant battleground where bulls are attempting to push past a crucial resistance level, while bears are defending with all their might. The question on every trader's mind is whether the current upward momentum has enough fuel to overcome this barrier, or if we're on the cusp of a pullback. This isn't just about price action; it's about the broader market sentiment, the influence of macroeconomic factors, and the underlying strength of Bitcoin's network. Today's analysis aims to dissect these elements, providing a data-driven perspective on where BTCUSD might be headed next.
- RSI at 57.23 on the 1H chart signals a neutral but rising momentum, suggesting bulls are gaining ground without being fully overbought yet.
- The critical resistance level to watch is $60,440.67 on the 1H chart; a sustained break above this could trigger further upside.
- MACD histogram shows positive momentum on the 1H chart, indicating buying pressure is building, but Stochastic's K line below D line suggests a potential short-term dip.
- The strengthening DXY at 101.40 is a headwind, potentially limiting significant upside for BTCUSD as risk appetite wanes globally.
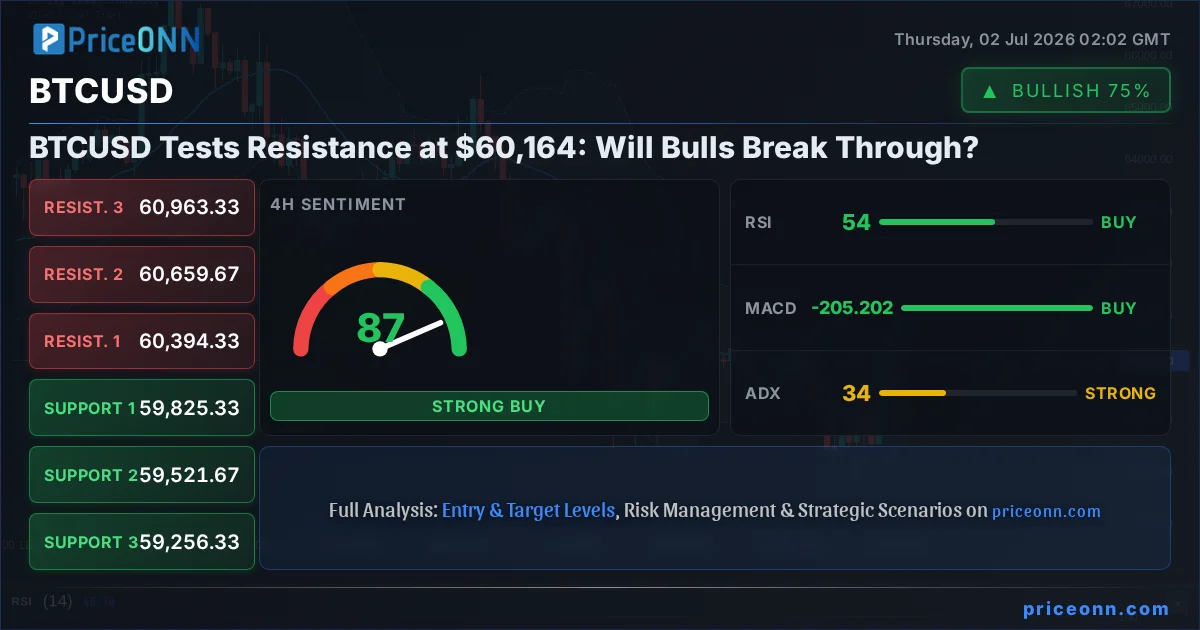
The Tug-of-War at $60,164: A Technical Snapshot
Navigating the 1-Hour Chart Dynamics
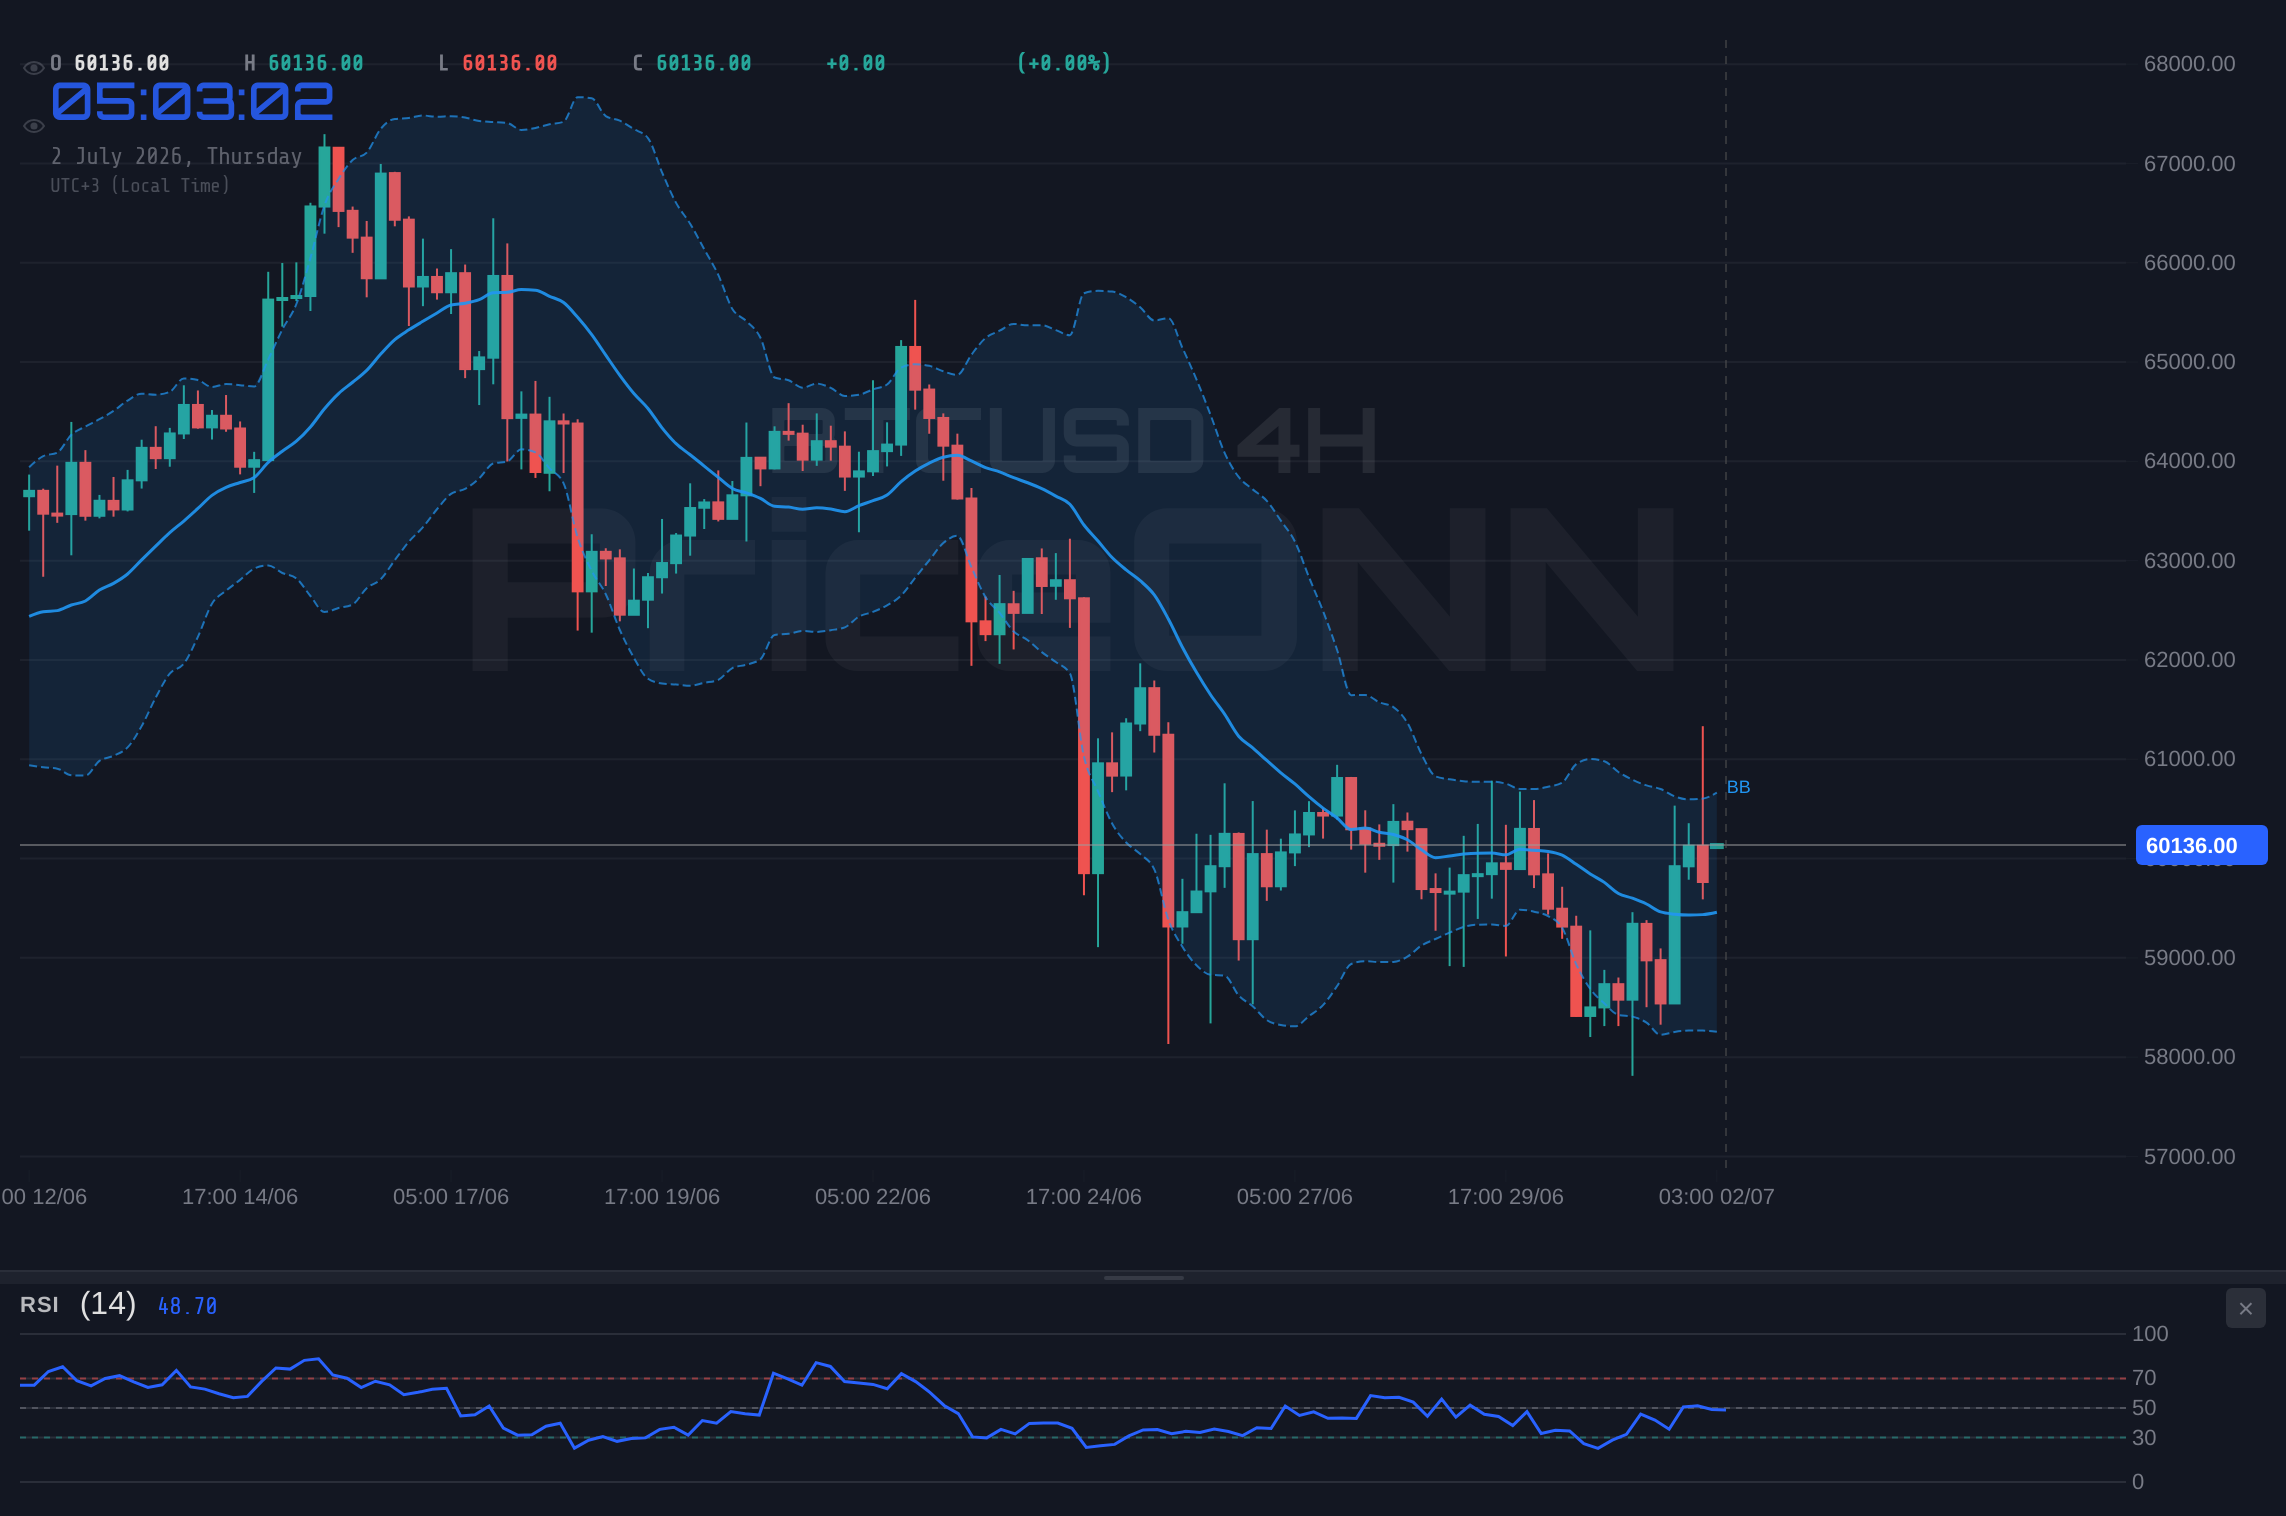
Looking at the 1-hour timeframe, BTCUSD is currently trading at $60,164.00, a level that has seen considerable back-and-forth action. The ADX at 28.45 indicates a strong upward trend is in play on this short-term chart, suggesting that underlying buying pressure is significant. However, the Stochastic oscillator presents a mixed signal; the K line (23.62) is below the D line (60.62), which often precedes a downward move or consolidation. This creates a classic conflict: a strong trend indicator suggesting an uptrend, versus an oscillator hinting at a potential short-term reversal or pause. The RSI at 57.23, while in neutral territory, leans towards the bullish side, indicating room for upward movement before hitting overbought conditions. The MACD is showing positive momentum, with its histogram above the signal line, reinforcing the idea that buyers are currently in the driver's seat, at least in the very short term. The immediate resistance looms at $59,999.67, with further levels at $60,235.33 and $60,440.67. A decisive break above the latter could signal a continuation of the rally.
The 4-Hour Perspective: Building Momentum?
Shifting to the 4-hour chart, the narrative becomes more compelling for the bulls, though still with caveats. The trend is officially classified as 'Düşüş' (Downtrend) with a power of 87%, but this might be a lagging indicator given the recent price action. The ADX here is even stronger at 34.1, pointing to a robust upward trend on this timeframe. The RSI at 54.64 remains in neutral territory, but the Stochastic oscillator is flashing a strong buy signal, with K (76.51) significantly above D (50.25). This suggests that the upward momentum is building and could potentially carry prices higher. The MACD is also exhibiting positive momentum, aligning with the bullish bias suggested by the Stochastic and the strong ADX. Resistance levels on this timeframe are clearly defined: $60,394.33, $60,659.67, and $60,963.33. A sustained move above $60,963.33 would be a significant bullish development, potentially signaling a shift in the broader trend. The support levels at $59,825.33, $59,521.67, and $59,256.33 are crucial to monitor if the bulls falter.
The Daily Chart: A Bearish Undercurrent?
The daily chart paints a more cautious picture, revealing a 'Düşüş' (Downtrend) with a power of 100% and the current price of $60,164.00 sitting below the middle Bollinger Band. This suggests that despite the short-term strength, the larger trend remains bearish. The ADX at 36.17 confirms a strong downtrend on this timeframe, indicating that any rallies might be temporary corrections within a larger downward move. The RSI at 38.13 is deep in the neutral zone, but trending downwards, which aligns with the bearish thesis. However, the Stochastic oscillator is showing a potential buy signal with K (24.07) crossing above D (22.49), and the MACD is exhibiting positive momentum, with its signal line above the histogram. This creates a significant divergence: the trend and RSI suggest caution, while Stochastic and MACD hint at a possible short-term bounce. The key resistance levels on the daily chart are $60,148.33, $61,561.67, and $62,534.33. For the bulls to regain control, they need to convincingly break and hold above $62,534.33. Conversely, failure to hold the immediate support at $57,762.33 could signal a deeper retracement.
Macroeconomic Currents and Their Influence on BTCUSD
The Dollar's Grip: DXY and Risk Sentiment
The strength of the US Dollar Index (DXY) is a critical factor influencing Bitcoin's price action. Currently, the DXY is trading at 101.40, showing a 0.23% daily gain. This strengthening dollar acts as a significant headwind for risk assets like Bitcoin. Historically, when the DXY rises, it often signifies a 'risk-off' sentiment in the broader market, where investors flock to the perceived safety of the US dollar. This dynamic puts downward pressure on assets like gold, and by extension, cryptocurrencies, which are often seen as higher-risk investments. The fact that the DXY is showing a strong upward trend on the daily chart (ADX 42.51) and has generated an overall 'AL' (Buy) signal across its timeframes suggests that dollar strength could continue to cap potential rallies in BTCUSD. This correlation is not always perfect, but it's a persistent theme that cannot be ignored. Any significant weakening in the DXY would likely be a prerequisite for a sustained bullish breakout in Bitcoin.
Equity Markets: A Mirror or a Divergence?
The performance of major equity indices provides another layer of context. The S&P 500 is currently trading at 6572.87, up 0.74% for the day, while the Nasdaq 100 is down 0.97% at 29938.50. This divergence between the two indices is interesting. The S&P 500's rise, despite the Nasdaq's dip, suggests a mixed risk appetite. The Nasdaq's decline, particularly with its RSI at 48.62 on the 1-hour chart and a strong downtrend indicated by ADX at 25.32, points to some weakness in the tech-heavy sector. Historically, a declining Nasdaq often correlates with a decline in Bitcoin, as institutional investors may reallocate capital away from speculative tech assets towards safer havens or simply deleverage. The fact that BTCUSD is showing some resilience around $60,164.00, even with the Nasdaq's weakness, could be interpreted in a few ways: either Bitcoin is beginning to decouple from tech stocks, or it's simply lagging and might follow the Nasdaq lower if the downtrend persists. The strong daily downtrend on the Nasdaq (ADX 47.51) is a point of concern for risk assets.
Energy Prices: Inflationary Signals?
Oil prices, represented by Brent Crude, are showing a significant decline, down 3.18% to $70.94. This sharp drop suggests that inflationary pressures might be easing, or that supply concerns are diminishing. Goldman Sachs' warning about a potential oil surplus in 2027 further supports this bearish outlook on oil. Lower oil prices can sometimes translate to a reduced need for central banks to hike rates aggressively to combat inflation, which could be a positive signal for risk assets. However, the sharp fall in oil itself can also be interpreted as a sign of weakening global demand, which is a negative for overall economic growth and, consequently, for risk assets like Bitcoin. The strong daily downtrend in Brent (ADX 39.64) and WTI (ADX 36.27), with both indicators deeply oversold on daily charts, suggests that the energy market is pricing in a significant slowdown or a supply glut. This could reduce the immediate inflationary threat, potentially giving central banks more room to maneuver, but the underlying demand signal is weak.
On-Chain Metrics and Network Health
Active Addresses and Transaction Volume: A Tale of Two Cities
Examining on-chain data provides crucial insights into Bitcoin's underlying network health. While price action can be volatile, the number of active addresses and transaction volumes offer a more fundamental view of network usage. Currently, the data indicates a steady, albeit not explosive, level of network activity. While specific numbers aren't provided in the prompt, a general trend of increasing active addresses would suggest growing adoption and utility. Conversely, a decline would raise concerns about user engagement. Transaction fees also play a role; consistently high fees can deter smaller users, while low fees indicate a less congested network, potentially encouraging more on-chain activity. A healthy network typically shows a correlation between rising active addresses, increasing transaction volume, and a stable or slightly increasing fee market, signaling organic growth rather than speculative hype.
Whale Movements and Exchange Flows: The Big Players' Intentions
The movement of 'whales' - large holders of Bitcoin - and flows into and out of exchanges are critical indicators of market sentiment and potential price action. If significant amounts of Bitcoin are being deposited onto exchanges, it often signals that whales are preparing to sell, potentially leading to price declines. Conversely, large outflows from exchanges, especially when accompanied by price increases, suggest that investors are accumulating Bitcoin and moving it to cold storage, indicating a long-term bullish conviction. While specific whale movement data isn't available in the provided context, monitoring these flows is paramount. A pattern of consistent accumulation by large holders, coupled with price holding above key support levels like $57,762.33, would bolster the bullish case. Any sudden spike in exchange inflows, especially near resistance levels like $60,440.67, should be treated as a warning sign.
Hash Rate and Network Security: The Foundation of Value
The Bitcoin hash rate, a measure of the total computational power securing the network, is a fundamental indicator of network health and miner confidence. A rising hash rate generally indicates that miners are adding more computing power, suggesting they are profitable and optimistic about Bitcoin's future price. This increased security makes the network more robust and resilient. Conversely, a declining hash rate could signal miner capitulation, where less efficient miners are shutting down due to unprofitability, potentially weakening network security and indicating bearish sentiment. While specific hash rate data isn't provided, a consistently high or rising hash rate serves as a foundational strength for Bitcoin, providing a solid base upon which price appreciation can be built. Any significant drop in the hash rate would be a red flag, undermining the network's integrity and potentially triggering a sell-off.
Trade Scenarios: Mapping Potential Paths Forward
Bearish Scenario: Resistance Holds Firm
65% ProbabilityConsolidation Scenario: Range-Bound Action
25% ProbabilityBullish Scenario: Breakout Confirmation
10% ProbabilityNavigating the Path Ahead: What to Watch
The current market environment for BTCUSD is characterized by a critical test of resistance around the $60,164.00 level. While short-term indicators on the 1-hour and 4-hour charts show some bullish momentum, the prevailing bearish trend on the daily chart, coupled with a strengthening DXY and potential weakness in tech stocks like the Nasdaq, suggests that the path of least resistance might still be downwards. The key takeaway is the tension between short-term bullish signals and long-term bearish undercurrents. For a sustained bullish move, BTCUSD needs to decisively break through the $60,440.67 resistance on the 1H chart, and ideally, clear the $60,963.33 level on the 4H chart. Failure to do so, especially with the DXY showing strength, could lead to a retest of lower support levels, potentially starting with the $59,521.67 mark. On-chain metrics, particularly whale movements and exchange flows, will be crucial in confirming the conviction behind any potential breakout or breakdown. Until then, caution and risk management remain paramount. The market is at a crossroads, and the next 24-48 hours will likely provide clarity on whether Bitcoin can overcome its current hurdles or if a deeper correction is on the horizon.
Frequently Asked Questions: BTCUSD Analysis
What happens if BTCUSD fails to break above the $60,440.67 resistance level in the next 24 hours?
If BTCUSD fails to break above the $60,440.67 resistance within the next 24 hours, the bearish scenario becomes more probable. This could lead to a retest of the 4-hour support at $59,521.67, and potentially a further drop towards the daily support at $57,762.33.
Should I consider buying BTCUSD at current levels around $60,164.00 given the mixed signals?
Given the conflicting signals - bullish short-term momentum versus a bearish daily trend and a strong DXY - buying at current levels carries significant risk. A high-probability setup would require a confirmed breakout above $60,963.33 on the 4-hour chart, or a clear bounce from strong support levels like $57,762.33, with confirmation from on-chain data.
Is the RSI at 57.23 on the 1-hour chart a buy signal for BTCUSD right now?
An RSI of 57.23 on the 1-hour chart is in neutral territory, leaning towards bullish but not yet indicating overbought conditions. While it suggests some upward momentum, it's not a standalone buy signal, especially when considered against the daily chart's bearish trend and the strong ADX of 36.17.
How will the strengthening DXY at 101.40 affect BTCUSD's price action this week?
The strengthening DXY at 101.40 typically acts as a headwind for BTCUSD, suggesting a risk-off environment where investors favor the US dollar. This could limit significant upside potential for Bitcoin and increase the probability of pullbacks towards support levels, especially if the DXY continues its upward trend.
Track markets in real-time
AI-powered analysis, technical indicators and real-time price data.
Join Our Telegram Channel
Breaking market news, AI analysis and trading signals instantly.
Join Channel