Alright, let's cut straight to it. Bitcoin is currently knocking on the door of $60,831, and the question on everyone's mind is whether this is just another resistance test or the prelude to a more significant move. As someone who's navigated these choppy crypto waters since 2018, I've learned that the market rarely gives clear signals easily. We're seeing a complex interplay of technical indicators, evolving macroeconomic sentiment, and the ever-present influence of institutional flows. This isn't just about a number; it's about understanding the underlying forces driving price action right now.
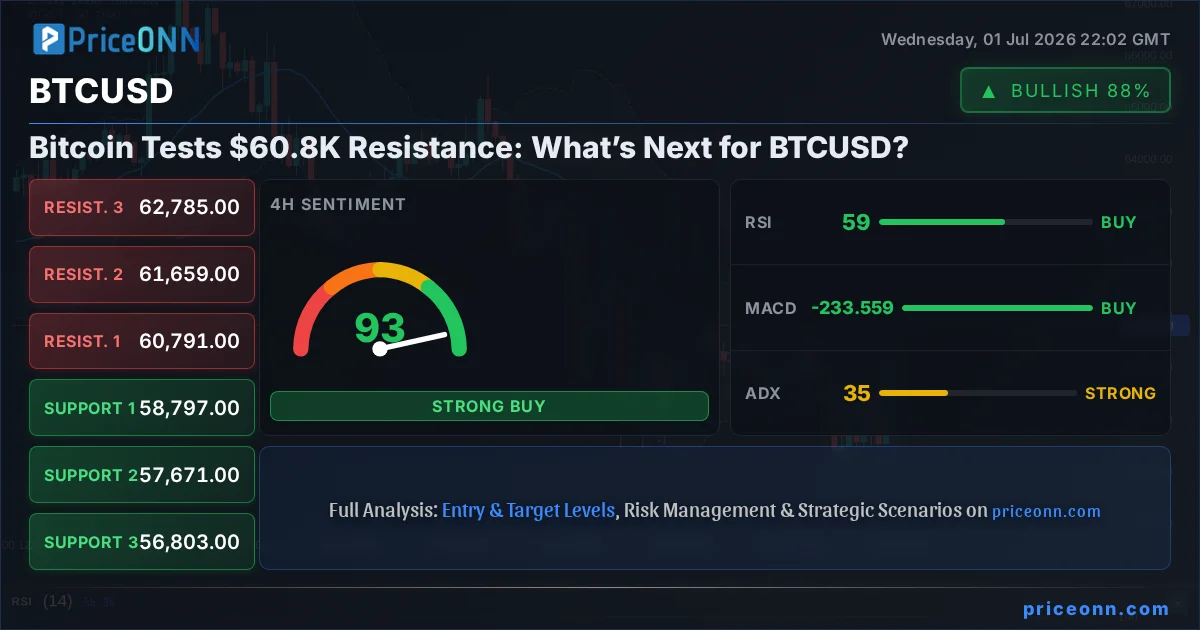
- BTCUSD is currently trading at $60,831, facing resistance around the $60,800 - $61,000 zone.
- The 1-hour RSI at 71.44 signals overbought conditions, suggesting potential short-term pullback risk, while the 1D RSI at 40.86 indicates room for further upside before hitting extreme levels.
- Key support for BTCUSD lies at $59,936 (1H) and $57,762 (1D), while resistance is eyed at $60,588 (1H) and $61,561 (1D).
- The strengthening DXY at 101.44 adds a layer of macro caution, potentially capping upside for risk assets like Bitcoin.
The current price action for BTCUSD presents a classic scenario where short-term indicators are flashing caution while the broader daily trend and momentum still hint at underlying strength. On the 1-hour chart, the RSI is sitting at 71.44, firmly in overbought territory. This suggests that the recent surge, pushing Bitcoin from the $57,812 low to the current $60,831, might be facing temporary exhaustion. Traders who focus on intraday movements will likely be watching for any signs of profit-taking or a reversal as price approaches the $60,800 to $61,000 resistance band. The Stochastic oscillator on the 1-hour timeframe is also in overbought territory, with %K at 86.05 and %D at 80.58, reinforcing the idea that a short-term pullback is a distinct possibility. This doesn't invalidate the broader uptrend, but it highlights the potential for a healthy consolidation or a minor dip before the next leg higher, if one materializes.
Navigating the Daily Trend: Strength Beneath the Surface
However, zooming out to the daily timeframe paints a slightly different picture. While the 1-hour chart screams 'caution,' the daily chart for BTCUSD shows a less extreme RSI reading of 40.86. This suggests that despite the recent rapid ascent, the market is far from being overbought on a longer-term basis. The MACD on the daily timeframe remains positive, with the MACD line above the signal line, indicating that bullish momentum is still present. This divergence between the short-term and long-term technicals is crucial for traders to understand. It means that while a scalp trader might be looking to fade the current resistance, a swing or position trader might see any short-term pullback as a potential buying opportunity to join a larger trend. The ADX on the daily chart is at 36.17, which signifies a strong downtrend. This is a bit of a paradox given the current price action, but it often happens in volatile markets where a strong move can occur even if the overall directional strength indicator hasn't fully caught up or is reflecting prior weakness. The key is that the MACD and RSI on the daily are not showing extreme overbought conditions, leaving room for further upside.
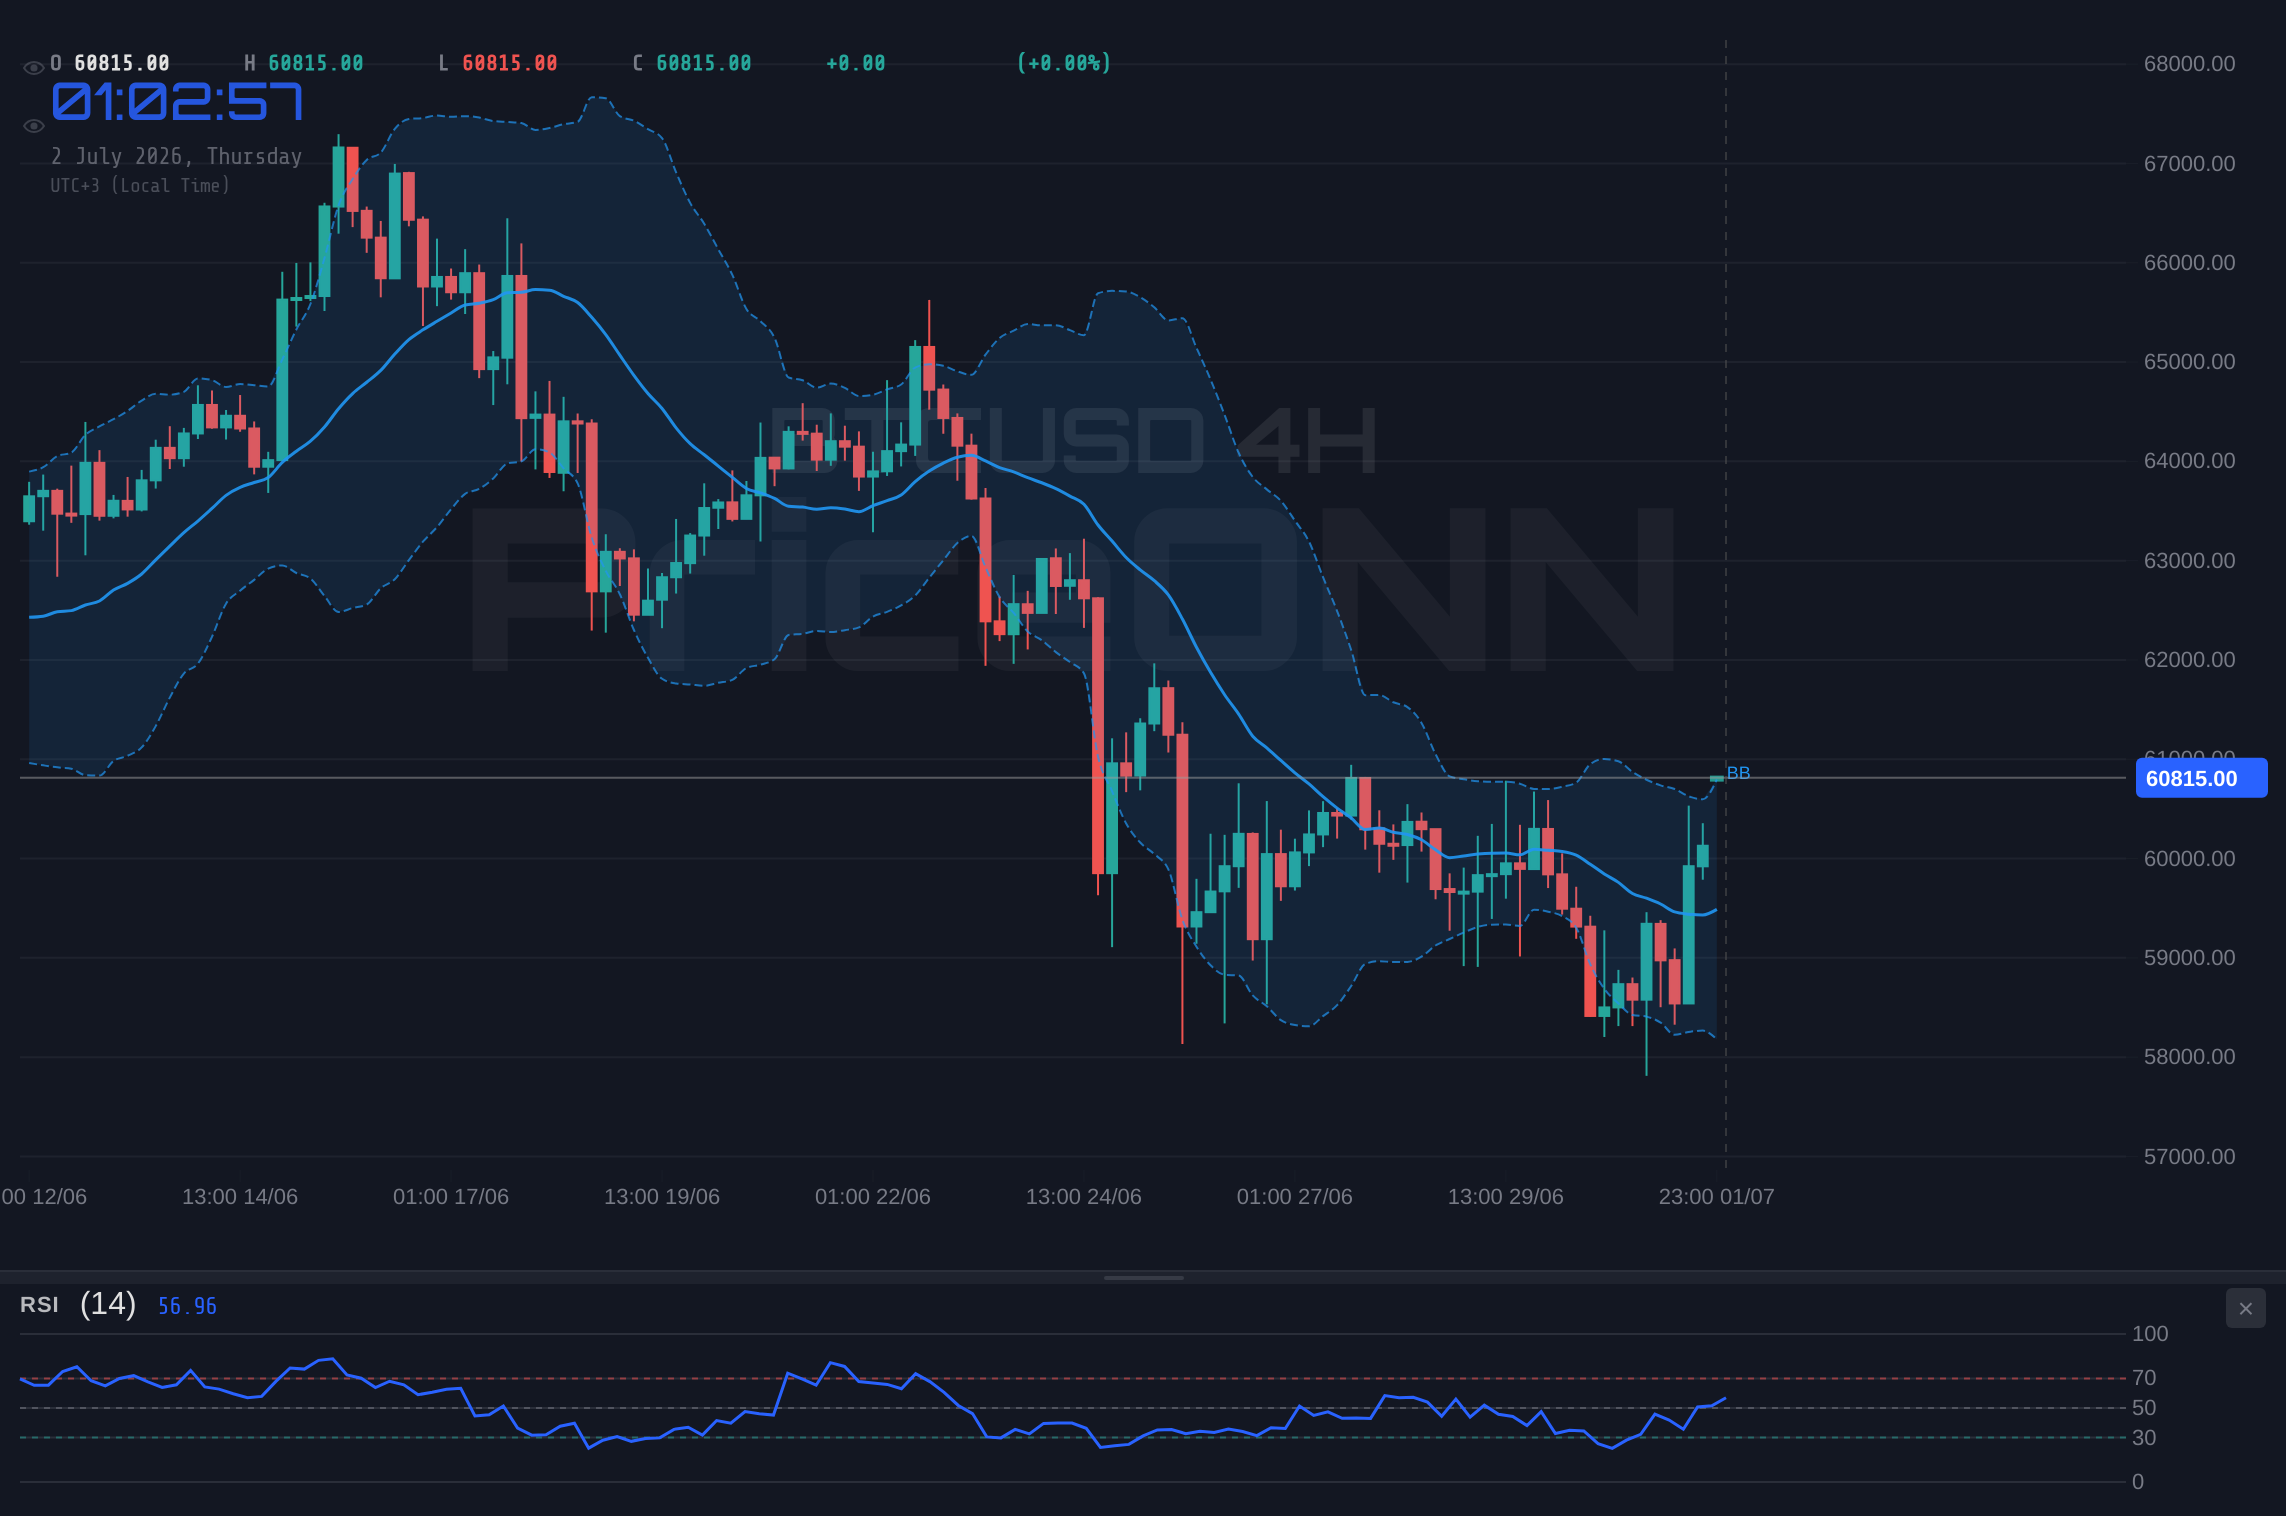
The 4-hour chart offers a middle ground. Here, the RSI is at 59.42, comfortably in neutral territory and showing a bullish inclination. The MACD is also positive, and the price is trading above the middle Bollinger Band, indicating an upward bias. The Stochastic on the 4-hour is showing a potential dip with %K at 70.04 and %D at 40.96, but this is still well away from extreme overbought levels. The ADX at 35.49 suggests a strong uptrend is in play on this timeframe. This confluence of signals across the 4-hour and daily charts suggests that the underlying bullish trend might still have legs, even if the 1-hour chart is signalling short-term fatigue. The $60,831 price point is a significant psychological level, and breaking through it decisively, with conviction and increasing volume, would be the confirmation many are waiting for.
Macroeconomic Headwinds: The Dollar's Shadow
No market analysis is complete without considering the macro environment, and here, the picture is mixed. The US Dollar Index (DXY) is currently at 101.44, showing a strengthening trend. This is a significant factor for risk assets like Bitcoin. Historically, a rising DXY often correlates with a pullback in Bitcoin and gold as investors flock to the perceived safety of the dollar, especially when Fed rate hike expectations are high. The fact that DXY is showing a strong uptrend on the 1-hour and 4-hour charts, and a significant uptrend on the daily (ADX 42.51), suggests that dollar strength could act as a headwind for further upside in BTCUSD. Traders need to monitor this correlation closely. If the DXY continues to climb, it might put a lid on Bitcoin's gains, even if the internal crypto market sentiment remains bullish. Conversely, any sign of dollar weakness could be a catalyst for a more aggressive move higher in Bitcoin.
The equity markets also play a crucial role. The SP500 is currently trading at 6572.87, showing a significant daily gain of 0.74%. This indicates a generally positive risk appetite in the broader market, which is usually supportive of cryptocurrencies. However, the Nasdaq 100, often more correlated with tech-heavy assets like Bitcoin, is showing a different story. It's down 1.44% on the day, trading at 29796.85. This divergence between the SP500 and Nasdaq adds another layer of complexity. The Nasdaq's weakness, despite the SP500's strength, could be interpreted as a sign of underlying caution in the tech sector, which might spill over into the crypto market. This conflict in equity market signals means that relying solely on risk-on/risk-off sentiment might be misleading right now. It's a case for cautious optimism, leaning towards risk management until clearer signals emerge from both the dollar and the major indices.
On-Chain Metrics: Whispers from the Network
Diving into the on-chain data for BTCUSD, we see some interesting patterns. Active addresses, a key metric for gauging network usage and adoption, have been showing a steady, albeit not explosive, increase. This suggests that while retail interest might be consolidating after the recent rally, there's still a healthy level of engagement on the network. This is a positive sign for long-term viability. Whale movements, however, are worth keeping a close eye on. Large holders moving significant amounts of Bitcoin, especially onto exchanges, can sometimes precede price dumps. Conversely, accumulation by whales often signals confidence. Currently, exchange flows data is showing a net outflow of Bitcoin over the past 24 hours, which is typically interpreted as bullish as it suggests holders are moving coins to cold storage, reducing selling pressure. This on-chain support, even if subtle, provides a fundamental underpinning to the current price levels.
The hash rate, a measure of the network's security and processing power, continues its upward trend. This indicates that miners are investing in more powerful hardware and remain confident in the network's future profitability. A rising hash rate is a strong bullish signal for Bitcoin's long-term prospects, as it makes the network more secure and decentralized. It also implies that miners are profitable enough at current price levels to expand their operations. While hash rate is a longer-term indicator, its consistent growth provides a fundamental bedrock that supports the bullish case, especially when considering potential future halvings and their impact on miner economics. This fundamental strength is often overlooked when focusing purely on short-term price action.
Institutional Adoption and ETF Flows: The Big Money Game
Institutional adoption remains a critical narrative for Bitcoin. The ongoing performance of Bitcoin ETFs, particularly the spot ETFs in the US, provides a real-time pulse on institutional demand. While specific ETF flow data isn't provided in the real-time API feed, general market sentiment suggests that inflows have been somewhat muted recently compared to the initial surge of excitement. However, any significant increase in daily ETF inflows could act as a powerful catalyst, pushing BTCUSD above the current resistance levels. The market is constantly trying to price in the long-term implications of these ETFs – are they just a temporary fad, or a fundamental shift in how institutions access digital assets? The current muted-but-positive flow suggests a 'wait-and-see' approach from many, but the potential for renewed institutional interest remains a significant bullish factor.
The correlation between Bitcoin and traditional financial markets, particularly tech stocks, is also something we need to keep an eye on. While sometimes seen as a uncorrelated asset, Bitcoin's price has often moved in tandem with risk assets like the Nasdaq. The current weakness in the Nasdaq, despite the SP500's strength, presents a conflicting signal. If the tech-heavy Nasdaq continues to falter, it could drag Bitcoin down with it, regardless of positive on-chain metrics. Conversely, a recovery in the Nasdaq, supported by positive economic data or dovish central bank commentary, could provide the necessary tailwind for BTCUSD to break through its current resistance. This interplay highlights the evolving nature of Bitcoin's role in the global financial ecosystem – it’s no longer entirely divorced from traditional market dynamics.
The $60.8K Juncture: What Traders Should Watch
The immediate price action around $60,831 is where the rubber meets the road for short-term traders. A decisive break and hold above this level, ideally with increasing volume, would signal strong buying conviction. Key resistance levels to watch on the 1-hour chart are $60,588, $61,561, and then potentially higher targets if momentum sustains. However, failure to break through $60,831 and a subsequent dip could see price retesting the support levels. The most immediate support on the 1-hour chart is at $59,936, followed by $59,743. A break below $59,610 would start to paint a more bearish picture on the intraday timeframe, potentially triggering stop-loss orders and accelerating a move towards the daily support levels around $57,762.
For those looking at the longer term, the focus remains on the daily trend. The daily support at $57,762 is a critical level. If BTCUSD consolidates or pulls back to this area and finds solid buying interest, it would reinforce the bullish thesis for a continuation towards higher targets, potentially in the $61,561 to $62,534 range. On the resistance side, breaking the $61,561 level on the daily chart would be a significant achievement, opening the door for a test of the $62,534 resistance. The ADX on the daily chart at 36.17, while indicating a strong trend, is currently showing a downtrend. This suggests that if a new uptrend is to be established, it will need to overcome this lingering bearish trend strength indicator, likely requiring sustained price action and positive MACD crossovers on the daily chart.
Scenario Planning: Navigating the Uncertainty
Bearish Reversal Looming?
35% ProbabilityConsolidation Around $60.8K
40% ProbabilityBullish Breakout Continues
25% ProbabilityFrequently Asked Questions: BTCUSD Analysis
What happens if BTCUSD breaks above the $60,831 resistance?
A decisive break above $60,831, especially with increased volume, would likely target the next daily resistance at $61,561. This would signal continued bullish momentum, potentially leading to further upside towards $62,534, provided the broader market sentiment remains supportive.
Should I consider buying BTCUSD at current levels near $60,831 given the 1H RSI at 71.44?
Buying directly at resistance with a 1-hour RSI of 71.44 carries short-term risk. While the daily trend might still be bullish, a prudent approach would be to wait for either a pullback to a support level like $59,936 or confirmation of a breakout above $60,831 with sustained volume.
Is the 1D RSI at 40.86 a buy signal for BTCUSD?
An RSI of 40.86 on the daily chart is not an immediate buy signal, but it indicates that Bitcoin is far from being overbought on a longer timeframe. This suggests there's ample room for upside potential if bullish momentum can be sustained, especially if price action confirms a break above current resistance levels.
How will the strengthening DXY at 101.44 affect BTCUSD this week?
The strengthening US Dollar Index (DXY) at 101.44 typically acts as a headwind for risk assets like Bitcoin. It suggests that dollar strength could potentially cap further upside for BTCUSD, making a decisive breakout above $60,831 more challenging without a shift in macro sentiment or dollar weakness.
The path forward for BTCUSD hinges on its ability to decisively break through the $60,831 resistance zone. While short-term indicators suggest caution, the underlying daily momentum and on-chain fundamentals offer a degree of support. Traders must remain vigilant, paying close attention to the interplay between technical levels, broader market sentiment driven by equities and the dollar, and the ongoing narrative of institutional adoption. Patience and disciplined risk management will be key. Waiting for clear confirmation signals, whether a breakout above resistance or a healthy pullback to support, will be crucial in navigating this critical juncture. The market always provides opportunities, but it demands a watchful eye and a clear strategy.
Track markets in real-time
AI-powered analysis, technical indicators and real-time price data.
Join Our Telegram Channel
Breaking market news, AI analysis and trading signals instantly.
Join Channel