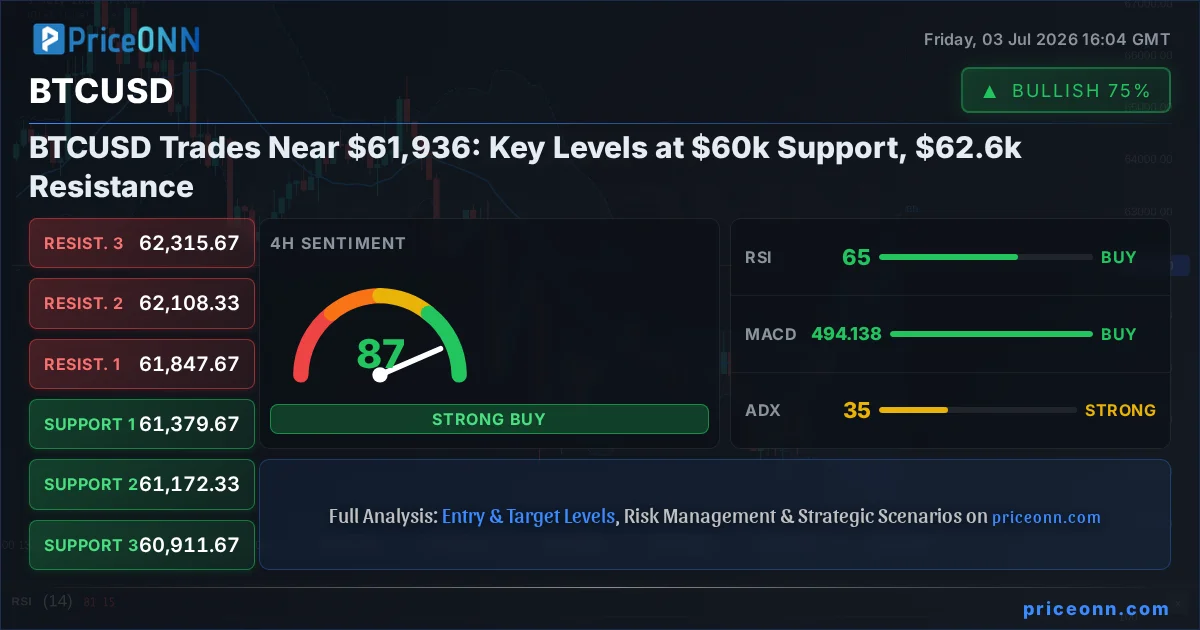
The narrative surrounding Bitcoin has shifted dramatically in recent weeks, moving from euphoric highs to a more grounded, data-driven assessment of its current market position. As of July 3rd, 2026, BTCUSD finds itself consolidating around the $61,936 mark, a level that has become a focal point for both bulls and bears. This consolidation phase is not merely a pause; it's a critical juncture where the interplay of technical indicators, macro-economic undercurrents, and market sentiment will likely dictate the next significant price move. With key support levels holding firm around $60,000 and resistance looming near $62,600, the market is at a crossroads, demanding a closer look at the underlying dynamics driving these movements.
- RSI at 59.2 signals a neutral zone with a slight upward bias, indicating no immediate overbought or oversold conditions on the 1-hour chart.
- Critical support for BTCUSD sits at $61,241.67 on the 1H chart, a level that has been tested multiple times this week.
- MACD histogram on the 1-hour chart shows negative momentum, suggesting potential weakening of upward pressure, despite the overall bullish trend on higher timeframes.
- Fed rate expectations are influencing BTCUSD's correlation with the DXY; as the dollar index shows mixed signals, Bitcoin's price action reflects this uncertainty.
Navigating the $61,936 Labyrinth: A Tale of Two Trends
The Shifting Sands of Momentum
The technical landscape for BTCUSD presents a fascinating dichotomy when viewed across different timeframes. On the 1-hour chart, the trend is decisively bullish with a power score of 100%, supported by an ADX reading of 30.23 indicating a strong trend. However, this short-term bullishness is tempered by mixed signals from momentum indicators. While the RSI at 59.2 suggests room for upward movement without being overbought, the MACD histogram is currently negative, sitting below its signal line. This divergence hints at a potential cooling of the immediate upward momentum, even as the overall trend strength remains high. Traders are watching the $61,821.67 support level closely on this timeframe, as a break below it could signal a short-term pullback.
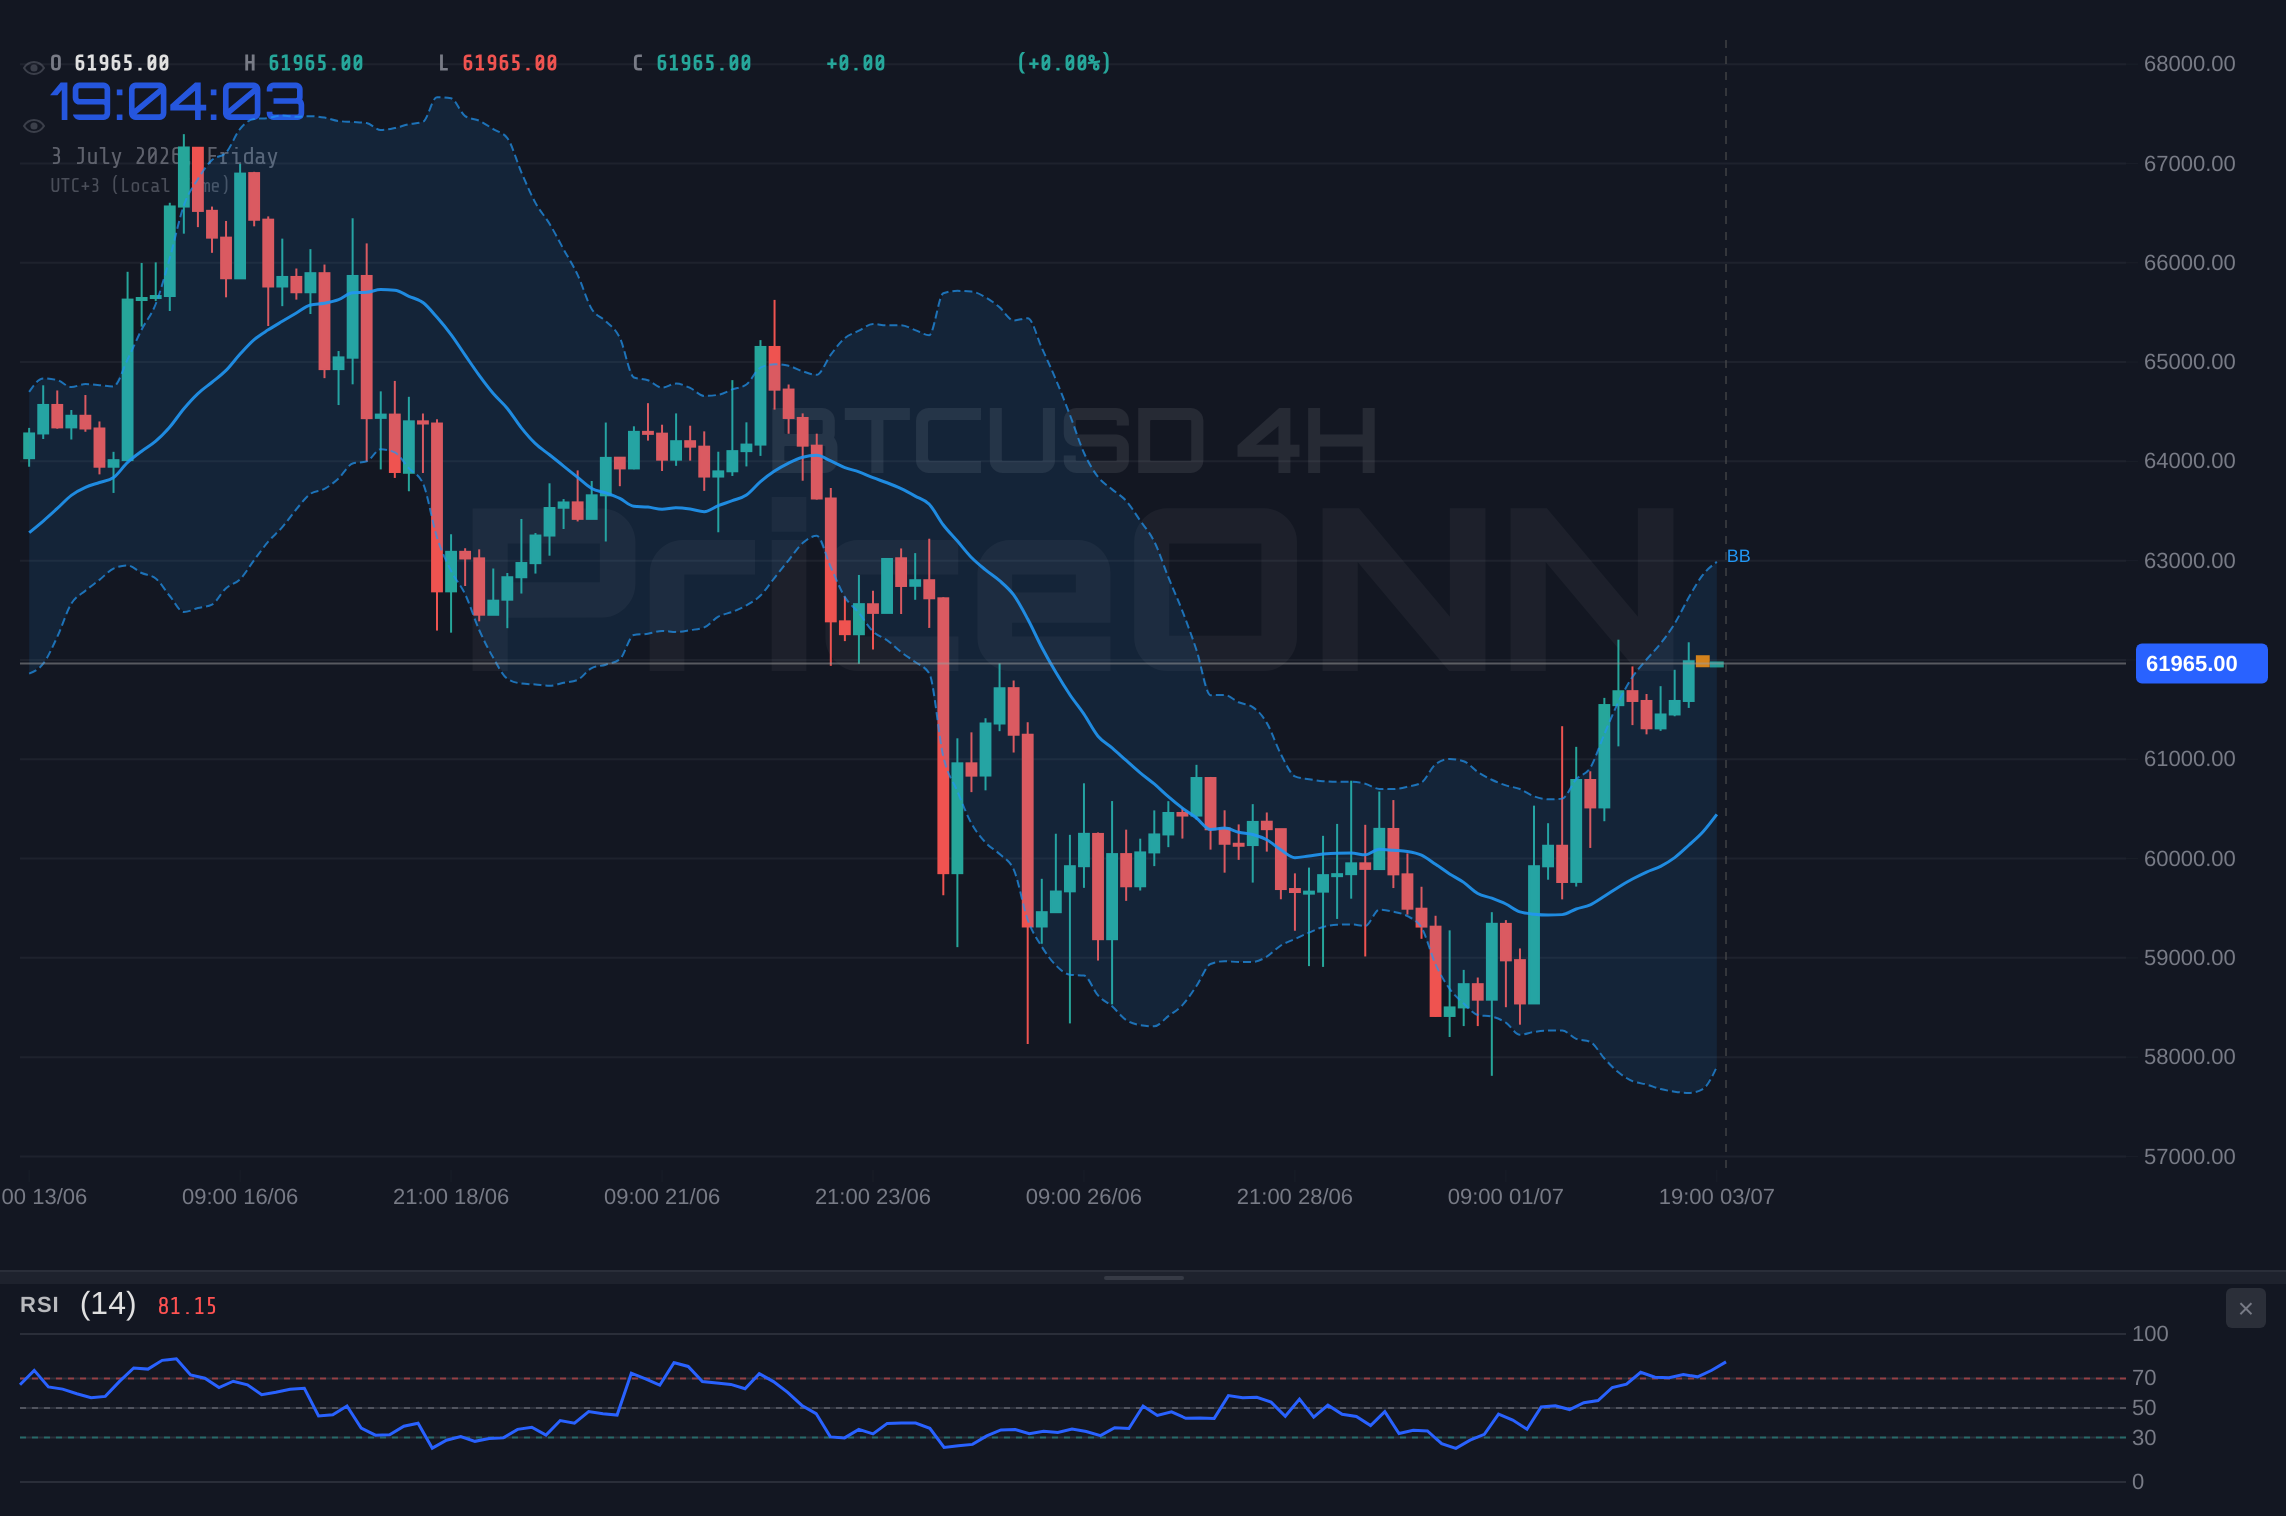
Contrast this with the 4-hour chart, which also paints a bullish picture with a power score of 93%. Here, the ADX at 35.14 reinforces the notion of a strong upward trend. The RSI at 64.39 is comfortably in neutral territory, showing a clear upward inclination. However, even here, the Stochastic Oscillator (%K at 78.94, %D at 81.54) is flashing a potential short-term reversal signal, hovering in the upper bounds of its range and showing %K below %D. This suggests that while the larger trend remains intact, the immediate path forward might involve some consolidation or a minor retracement before any sustained move higher. The crucial support on this timeframe is identified at $61,379.67.
The daily chart, however, introduces a note of caution. While the overall trend is classified as bearish with a power score of 92%, the ADX at 34.65 still indicates a strong trend, albeit a downward one. The RSI at 45.44 is in the neutral zone but leaning towards a bearish inclination. The MACD is positive, sitting above its signal line, suggesting underlying buying pressure, yet the Bollinger Bands are below the middle band, indicating a bearish bias. This divergence between the daily trend and some positive momentum indicators creates a complex picture. It implies that while the longer-term outlook might be pressured, the current price action around $61,936 could be a battleground between short-term bullish impulses and longer-term bearish pressures.
The Macroeconomic Tug-of-War: DXY and Rate Hike Speculation
The price action in BTCUSD cannot be viewed in isolation. The broader macroeconomic environment, particularly the performance of the US Dollar Index (DXY) and speculation surrounding Federal Reserve monetary policy, plays a significant role. Currently, the DXY is exhibiting mixed signals across timeframes. On the 1-hour chart, it shows a bullish trend with an ADX of 31.76, but a negative MACD histogram suggests waning upward momentum. The 4-hour chart, however, depicts a clear bearish trend (ADX: 27.22) with negative MACD momentum, while the daily chart leans bullish again with a strong ADX of 39.37 and positive MACD. This fluctuating DXY performance creates an environment of uncertainty, directly impacting risk assets like Bitcoin.
Historically, a strengthening DXY often correlates with a decline in risk assets as global capital flows towards perceived safe havens. Conversely, a weakening dollar can fuel demand for assets like Bitcoin. The current mixed signals from the DXY suggest that this correlation might be less pronounced in the short term, leading to more independent price discovery for BTCUSD. Furthermore, recent economic data, such as the cooling US labor market mentioned in the July 3rd forex news, has lowered the odds of aggressive Fed rate hikes. The Dow Jones futures climbing and S&P 500 futures rising suggest a growing risk appetite in traditional markets, which could spill over positively into cryptocurrencies.
However, the narrative is complex. While some data points suggest a Fed pause or even potential cuts later in the year, other economic indicators might still point towards persistent inflation, keeping the possibility of further tightening on the table. This ambiguity is reflected in the conflicting signals across BTCUSD's own technical indicators. The market is essentially waiting for clearer direction from central bank policy and inflation data. If the Fed pivots towards a more dovish stance sooner than expected, it could provide a significant tailwind for Bitcoin. Conversely, any signs of sticky inflation could lead to a risk-off sentiment, pressuring BTCUSD and potentially strengthening the dollar.
Correlation Analysis: Equities, Oil, and the Bitcoin Compass
Beyond the DXY, the performance of major equity indices like the S&P 500 and Nasdaq 100 provides crucial context for Bitcoin's risk-on/risk-off appetite. The S&P 500 is showing a bullish trend on the 1-hour and 4-hour charts, but a bearish trend on the daily chart, with an ADX of 47.51 indicating a strong downward trend. Similarly, the Nasdaq 100 exhibits a strong bullish trend on the 1-hour chart, but a bearish trend on the 4-hour chart (ADX: 25.71) and a neutral sentiment on the daily chart. This mixed picture in equities mirrors the uncertainty seen in BTCUSD, suggesting that institutional investors are navigating a complex market environment.
The recent news about Dow Jones futures climbing and S&P 500 futures rising suggests a short-term positive sentiment in the stock market. This could translate into increased buying pressure for Bitcoin, especially if the trend continues. However, the underlying bearish trend on the daily charts for both indices warrants caution. A significant shift in equity market sentiment, perhaps triggered by upcoming economic data or geopolitical events, could quickly reverse the current gains and drag Bitcoin lower.
Oil prices, specifically Brent and WTI, also offer clues regarding inflation expectations and geopolitical risks. Brent crude is showing a bearish trend on both 4-hour (ADX: 32.37) and daily (ADX: 42.01) charts, despite a short-term bullish signal on the 1-hour. WTI exhibits a similar pattern, with bearish trends on the 4-hour (ADX: 31.87) and daily (ADX: 38.84) charts. Falling oil prices can sometimes signal weakening global demand, which might be a concern for risk assets. However, they can also ease inflationary pressures, potentially supporting a Fed pivot. The current price action in oil, with bearish undertones despite short-term rallies, suggests that inflationary concerns might be moderating, but the market remains sensitive to supply-side disruptions or geopolitical tensions in oil-producing regions.
Key Levels and Trading Scenarios: Charting the Path Forward
The current price of $61,936 for BTCUSD places it squarely between critical technical levels that are shaping short-term trading strategies. On the 1-hour chart, immediate support is found at $61,821.67, followed by $61,472.33. Resistance is eyed at $62,401.67, with a more significant hurdle at $62,632.33. The 4-hour chart reinforces these levels, identifying support at $61,379.67 and resistance at $61,847.67. The daily chart presents wider ranges, with support at $60,049.33 and resistance at $62,664.33. These levels are not arbitrary; they represent areas where significant buying or selling pressure has historically emerged, making them crucial for defining trading strategies.
The ADX readings across timeframes (30.23 on 1H, 35.14 on 4H, 34.65 on 1D) consistently point towards strong trending conditions, suggesting that price movements, once initiated, could be substantial. However, the conflicting signals from RSI, MACD, and Stochastic across these timeframes indicate that the market is currently in a state of flux, seeking a clear direction. The strong trend signals, combined with these internal conflicts, suggest that we might be on the cusp of a significant breakout or breakdown, but the immediate catalyst remains unclear.
Bearish Scenario: Testing the Lower Bounds
60% ProbabilityNeutral Scenario: Consolidation and Range-Bound Trading
25% ProbabilityBullish Scenario: Breaking the Resistance Barrier
15% ProbabilityThe Road Ahead: Data Dependency and Trader Vigilance
Looking forward, the trajectory of BTCUSD will likely remain heavily influenced by macroeconomic data releases and central bank communications. Any indication of persistent inflation could spook markets and dampen risk appetite, potentially triggering the bearish scenario outlined above. Conversely, signs of cooling inflation or a more dovish Fed stance could fuel a rally, pushing Bitcoin towards its higher resistance targets. The strength of the trend indicators across multiple timeframes suggests that when a decisive move does occur, it could be significant. Therefore, maintaining vigilance and adhering to risk management principles will be paramount for traders.
The conflicting signals between short-term bullish momentum and longer-term bearish pressures, coupled with the mixed signals from correlated assets like the DXY and equities, create a complex trading environment. It's a market that rewards patience and disciplined execution. Scalpers might look for short-term opportunities within the immediate $61,821.67 to $62,401.67 range, while swing traders will likely wait for a clear break of either the support or resistance levels to establish positions. Long-term investors, meanwhile, may view any significant dips as potential accumulation opportunities, provided the fundamental long-term thesis for Bitcoin remains intact.
The current price action around $61,936 is not just a number; it's a battleground where competing forces are at play. The strength of the trend indicated by ADX is undeniable, but the internal conflicts within momentum indicators necessitate a cautious approach. Traders must remain adaptable, ready to adjust their strategies based on incoming data and price action. The key takeaway is that while short-term fluctuations are expected, the longer-term direction will be shaped by macro trends and the eventual resolution of current economic uncertainties.
Frequently Asked Questions: BTCUSD Analysis
What happens if BTCUSD breaks below the $61,379.67 support level?
If BTCUSD breaks decisively below the $61,379.67 support, the bearish scenario becomes more probable. This could trigger a move towards the next key support at $60,911.67, and potentially even the psychological barrier at $60,049.33. This breakdown would signal a failure of current bullish attempts and a potential continuation of the daily chart's bearish trend.
Should I buy BTCUSD at current levels of $61,936 given the mixed RSI and MACD signals?
Buying at current levels of $61,936 requires careful risk management due to mixed signals. While the 1-hour and 4-hour charts show bullish trends, the negative MACD histogram and daily chart's bearish lean warrant caution. A more prudent approach might be to wait for a confirmed breakout above $62,401.67 resistance or a clear bounce from $61,821.67 support, with confirmation from other indicators.
Is the RSI at 59.2 a sell signal for BTCUSD right now?
An RSI of 59.2 on the 1-hour chart is not typically considered a sell signal; it indicates neutral territory with a slight upward bias. It suggests that the asset is neither overbought nor oversold, leaving room for further price appreciation. However, traders should monitor if it approaches the 70+ zone, which historically signals overbought conditions and potential pullbacks.
How will the upcoming economic data affect BTCUSD this week?
Upcoming economic data releases, particularly those related to inflation and employment in the US, will be crucial. Stronger-than-expected data could reignite fears of further Fed rate hikes, pressuring BTCUSD downwards. Conversely, weaker data may support a Fed pause or pivot, potentially fueling a rally towards the $62,664.33 resistance level.
Volatility creates opportunity - those prepared will be rewarded. The current market environment for BTCUSD demands a balanced approach, combining technical analysis with an awareness of macro-economic drivers. By understanding the key levels, potential scenarios, and the influence of broader market forces, traders can navigate these choppy waters more effectively and position themselves for future opportunities.
| Indicator | Value | Signal | Interpretation |
|---|---|---|---|
| RSI (14) | 59.2 | Neutral | Room for upward movement, no immediate overbought conditions. |
| MACD Histogram | -0.01 | Bearish Momentum | Suggests weakening upward pressure on 1H chart. |
| Stochastic (%K/%D) | 71.19 / 78.15 | Bearish Crossover | Potential short-term reversal signal on 1H chart. |
| ADX (14) | 30.23 | Strong Trend | Indicates a strong trending market on 1H chart. |
| Bollinger Bands | Middle Band | Above Band | Price trading above the middle band, suggesting bullish bias on 1H. |
Track markets in real-time
AI-powered analysis, technical indicators and real-time price data.
Join Our Telegram Channel
Breaking market news, AI analysis and trading signals instantly.
Join Channel