As the weekend trading session winds down, Bitcoin (BTCUSD) finds itself consolidating around the critical psychological mark of $59,943. This level, which has seen considerable action throughout the past week, represents a pivotal point in the current market cycle. The digital asset has been navigating a complex landscape, influenced by a confluence of technical indicators that paint a mixed picture and macroeconomic undercurrents that continue to shape risk appetite globally. With the past week characterized by indecision and a lack of clear directional conviction, traders are keenly observing key price points to gauge the potential trajectory for BTCUSD in the coming days. The prevailing sentiment appears to be one of cautious observation, as the market digests recent price action and awaits clearer signals from both the on-chain data and the broader financial ecosystem.
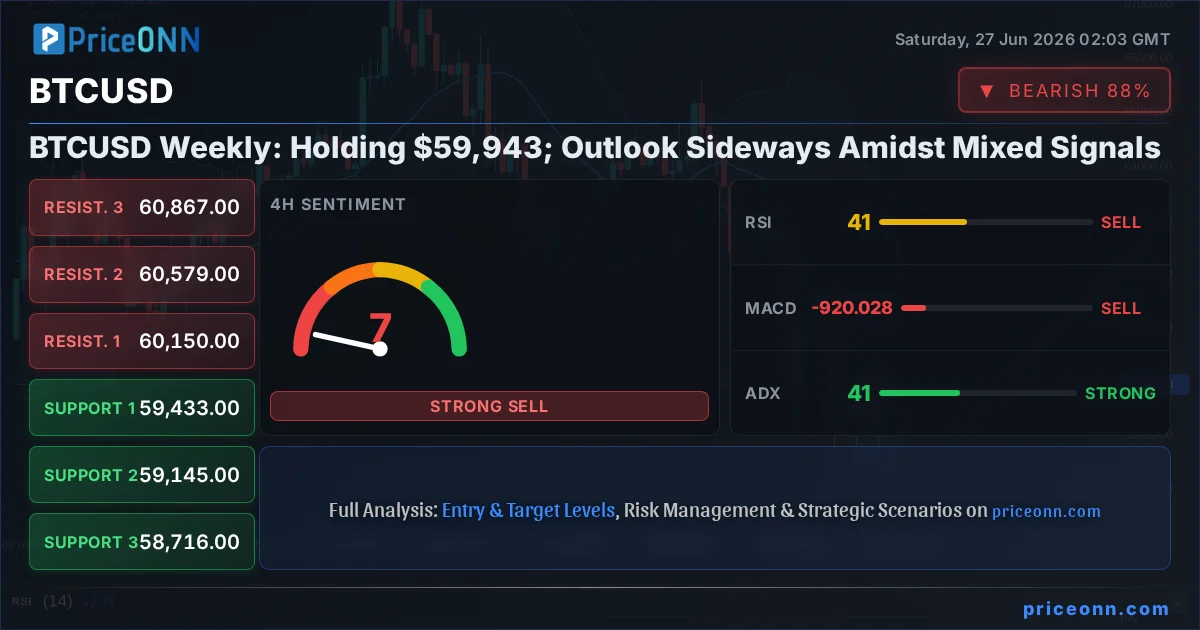
- Bitcoin is trading at $59,943, a crucial psychological level tested multiple times this week.
- The 1D RSI at 31.85 indicates oversold conditions, suggesting potential for a bounce, but MACD remains negative.
- Key support is identified at $57,740, with a break below potentially targeting $56,020.
- Resistance looms at $61,573, followed by $63,686; a decisive break above these levels is needed for a bullish shift.
- The DXY at 101.38 shows a weakening dollar, which could indirectly support risk assets like BTCUSD if sustained.
The Indecision Zone: Navigating the $59,943 Labyrinth
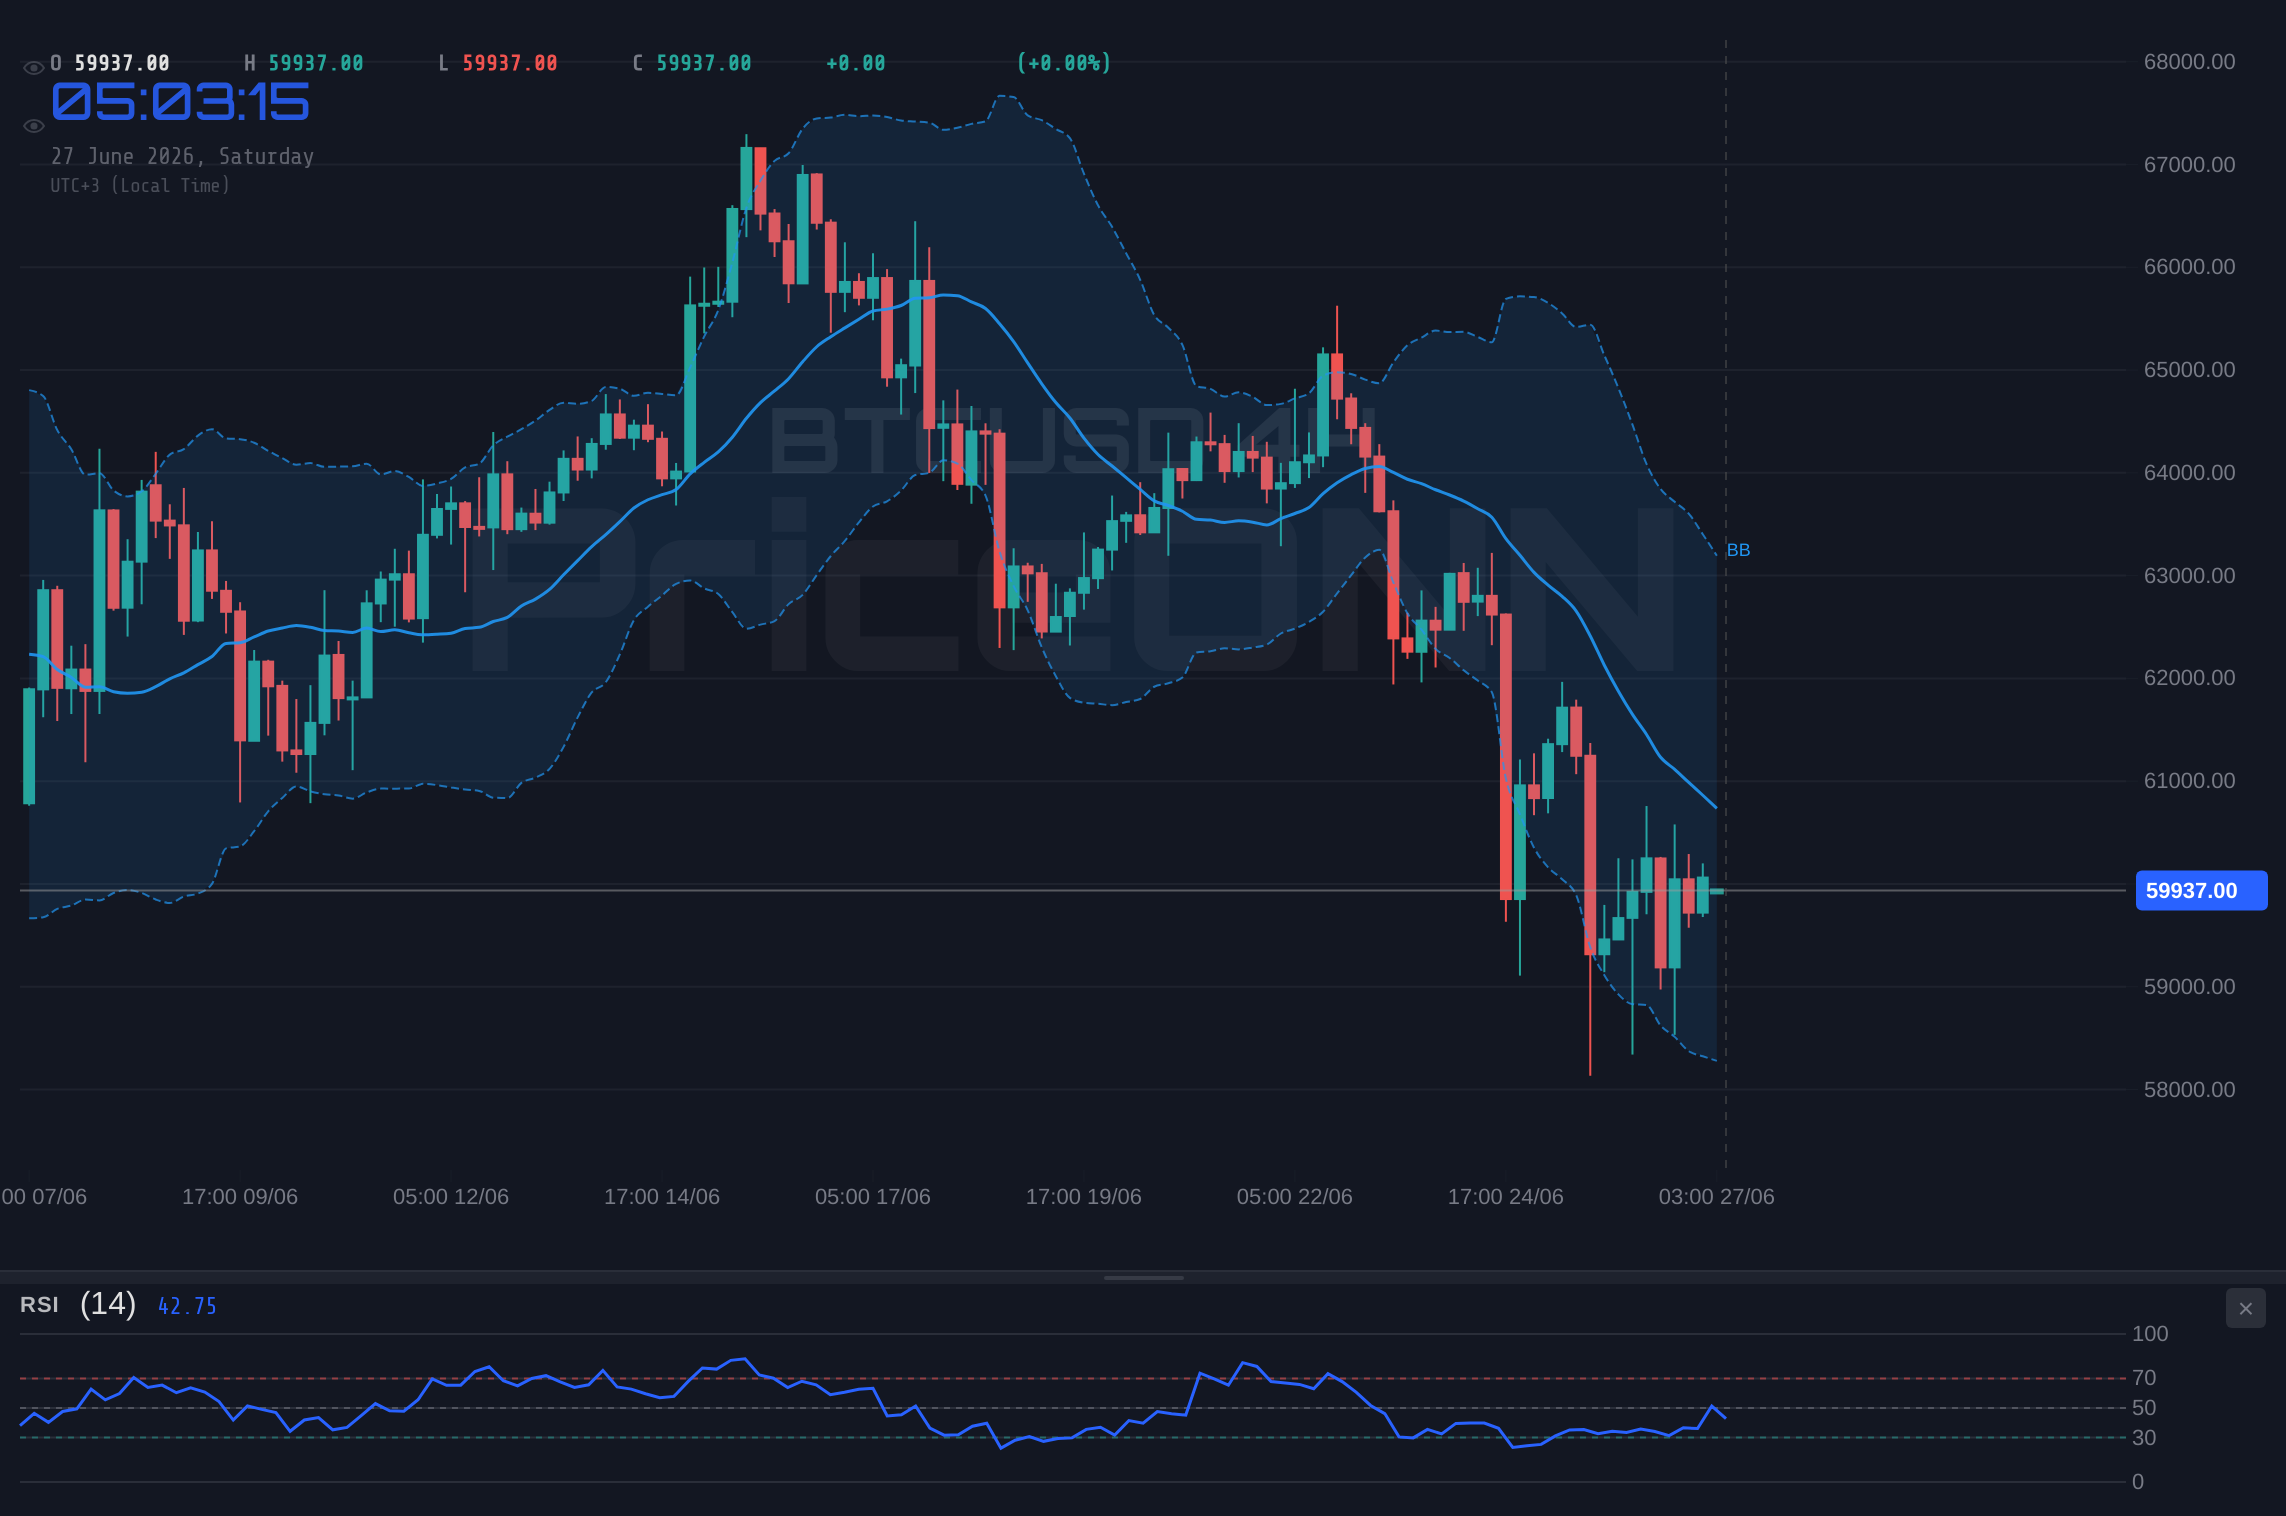
The past week for Bitcoin has been a study in consolidation, with the price action largely revolving around the $59,943 mark. This pivotal level has acted as both a battleground and a pivot point, reflecting the market's uncertainty about the immediate future direction. On the daily chart, the Relative Strength Index (RSI) at 31.85 paints a picture of oversold conditions, historically a precursor to potential upward corrections. However, this bullish divergence is currently at odds with the MACD, which continues to print negative momentum with the MACD line below its signal line. This technical conflict underscores the current indecision; while buyers might be showing interest in the lower price territory, sellers are still showing strength, preventing a sustained rally. The lack of strong directional conviction suggests that liquidity might be thinning, or that market participants are waiting for a more significant catalyst to break the current stalemate. The ADX at 33.79, while indicating a strong downtrend, is also showing signs of weakening momentum in its directional strength, further hinting at a potential period of sideways consolidation before the next significant move.
This period of sideways movement, often referred to as a 'range-bound' market, can be frustrating for traders seeking clear trends. However, it also presents specific opportunities for those who can identify the boundaries of this range and trade within them, or for those who are patient enough to wait for a definitive breakout. The market sentiment, as reflected in the overall signals across different timeframes, leans towards caution. The 1-hour and 4-hour charts show conflicting signals, with the 1-hour leaning towards a sell and the 4-hour showing a mix. This temporal divergence in signals further emphasizes the current lack of a strong, unified trend. The key for traders is to remain disciplined, avoid chasing the price in a choppy market, and wait for confirmation of a breakout or breakdown from this consolidation phase. The $59,943 level is not just a number; it's a psychological anchor around which the market's immediate fate is being decided.
Decoding the Mixed Signals: RSI vs. MACD on the Daily Chart
Delving deeper into the daily technicals, the divergence between the RSI and MACD on the BTCUSD chart at the $59,943 level is particularly noteworthy. The RSI, currently at 31.85, is firmly within the oversold territory. Historically, readings below 30 often precede significant price reversals as selling pressure exhausts itself and buyers step in. This suggests that from a purely momentum standpoint, there is room for a bounce. However, the MACD tells a different story. The negative momentum persists, with the MACD line stubbornly below its signal line and the histogram showing negative values. This indicates that while the selling might be slowing down, the underlying trend is still bearish, and the upside momentum is not yet strong enough to overcome the prevailing downward pressure. This conflict means that a simple 'buy' signal based on the oversold RSI would be premature. Confirmation is needed, ideally a bullish crossover on the MACD or a sustained break above a key resistance level, to validate any significant upward move. Without such confirmation, the risk of a 'bull trap' – where prices briefly rise only to fall back down – remains elevated.
The Stochastic Oscillator also adds to the complexity. With K at 21.19 and D at 26.67, it is also in oversold territory, reinforcing the RSI's signal. However, the fact that %K is below %D suggests that even in this oversold region, the downward momentum is still slightly dominant. This reinforces the need for caution. The ADX at 33.79 indicates a strong existing trend, but the slight downward tick in its value might signal that this trend's strength is waning. This doesn't necessarily mean a reversal is imminent, but it does suggest that the market might be entering a phase where the trend is losing steam, potentially leading to a period of consolidation or a less aggressive directional move. Traders looking for opportunities must weigh these conflicting signals carefully, understanding that a strong move in either direction will likely require a fundamental catalyst or a decisive technical break.
The Bearish Scenario: What If Support Crumbles at $59,943?
While the oversold RSI hints at potential relief, the dominant bearish sentiment on the longer timeframes cannot be ignored. The daily trend is firmly classified as 'Düşüş' (Downtrend) with a strength of 92%, and the MACD continues to exhibit negative momentum. If Bitcoin fails to hold the $59,943 psychological support, the next logical downside targets come into play. The immediate support level identified in the data is $57,740. A decisive close below $59,943, especially on increased volume, would likely trigger stop-loss orders and attract further selling pressure, pushing the price towards this $57,740 mark. This level has acted as a support in the recent past, and its breach would signify a continuation of the downtrend, potentially opening the path to the subsequent support at $56,020. Breaking below $56,020 would signal a more significant capitulation, potentially leading to a sharp decline towards the $53,907 level, which represents the third tier of support on the daily chart. The ADX at 33.79 still points to a strong trend, suggesting that if these support levels break, the move could be swift and substantial, driven by the prevailing bearish sentiment.
The implications of such a bearish scenario extend beyond just price action. A sustained drop below $59,943 could spook risk-sensitive assets, potentially correlating with a strengthening US Dollar Index (DXY), which is currently hovering around 101.38 but shows signs of weakening on the hourly and daily charts. If the dollar strengthens significantly on a BTCUSD breakdown, it would further dampen the appetite for riskier assets. On-chain metrics would also likely turn bearish. We might see an increase in exchange inflows as holders attempt to exit positions, a decrease in active addresses as speculative interest wanes, and a potential rise in whale selling if large holders decide to de-risk. The narrative would shift from 'potential recovery' to 'crypto winter fears resurfacing,' impacting altcoin markets even more severely. Therefore, the $59,943 level is not just a technical line; it's a sentiment barometer for the broader crypto market.
The Bullish Scenario: Can $59,943 Hold as a Launchpad?
Despite the prevailing bearish trend on longer timeframes, the oversold conditions indicated by the daily RSI (31.85) and Stochastic (K=21.19, D=26.67) present a case for a potential bullish reversal, provided certain conditions are met. For BTCUSD to shift gears from consolidation to a sustained uptrend, it must first decisively break above the immediate resistance level. Currently, the closest resistance is at $60,215 on the 1-hour chart, followed by $60,368 and then the more significant psychological and technical barrier at $60,536. A sustained price action above $60,536, ideally confirmed by increasing volume and a bullish MACD crossover on the 4-hour or daily chart, would be the first sign that the bears are losing control. If this bullish momentum continues, the next targets would be the higher resistance levels at $61,573, then $63,686, and potentially aiming for the $65,406 level on the daily chart. This bullish scenario would be bolstered if the DXY continues its downtrend and risk assets, like the S&P 500 (currently at 6572.87 and showing a strong daily uptrend despite some 1H bearish signals), experience a broad-based rally.
On-chain data would need to support this bullish narrative. An increase in active addresses, a decrease in exchange inflows (indicating holders are not rushing to sell), and significant whale accumulation would be crucial confirmations. Furthermore, positive developments in the broader crypto ecosystem, such as increased institutional adoption of Bitcoin ETFs, favorable regulatory news, or significant progress in Layer 2 scaling solutions for networks like Ethereum, could provide the necessary fundamental tailwind. The current positive overall signal on the 1-hour timeframe (Al: 5, Sat: 3, Nötr: 0) suggests short-term buying interest, which, if sustained and confirmed by longer timeframes, could initiate this bullish move. However, the strong bearish trend on the daily timeframe means that any upside move will likely face significant headwinds and require substantial buying pressure to overcome.
The Waiting Game: Consolidation Around $59,943
The most probable scenario, given the current conflicting signals and lack of clear catalysts, is a continuation of the sideways trading range. The price action around $59,943 suggests a market in equilibrium, where neither buyers nor sellers have a decisive advantage. This neutral outlook is supported by the mixed signals across different timeframes and indicators. The daily chart shows oversold conditions (RSI 31.85) hinting at a bounce, but the MACD remains bearish. The hourly chart shows some buying interest (Overall Signal: Sell, but Al: 3, Sat: 5), while the 4-hour shows a strong downtrend (ADX 41.35) but also potential for a bounce (Stochastic K > D). This lack of clarity keeps the market stuck in a range. Such periods are characterized by lower trading volumes and muted volatility, making it difficult to establish strong directional trades.
In this neutral scenario, price action would likely oscillate between the identified support and resistance levels. We could see price test the $57,740 support, find buyers, and rally back towards $60,000-$61,000. Conversely, any attempt to break above $61,573 resistance might be met with selling pressure, pushing the price back down within the range. This 'chop' can lead to whipsaws for traders caught on the wrong side. The key for this scenario is the market's inability to commit to a direction. It's a waiting game, where participants are looking for a trigger – either a significant macroeconomic event, a substantial shift in on-chain metrics, or a clear technical breakout – to break the deadlock. Until then, expect BTCUSD to remain range-bound, with $59,943 acting as the central pivot.
What If the Range Holds? Trading Tactics for a Sideways Market
Trading within a range requires a different strategy than trend trading. The primary tactic involves buying near the lower boundary of the range and selling near the upper boundary. For BTCUSD, this means looking for buying opportunities as the price approaches the $57,740 support level, with a tight stop-loss just below it, perhaps targeting the $59,943 area or even higher if momentum picks up. Conversely, selling opportunities might arise as the price tests the resistance zone around $61,573, aiming for a move back towards the middle of the range or the $59,943 pivot. However, this strategy is fraught with risk, as a breakout can occur suddenly, invalidating the range and leading to significant losses if positions are not managed tightly. The key is to use smaller position sizes, set strict stop-losses, and be prepared to exit quickly if the range breaks. Confirmation from other indicators, such as a bounce off support accompanied by a bullish RSI crossover on a shorter timeframe, or a rejection at resistance with a bearish MACD divergence, can increase the probability of success within the range.
Alternatively, traders might choose to sit on the sidelines during consolidation phases, waiting for a clearer trend to emerge. This approach prioritizes capital preservation and avoids the frustration and potential losses associated with choppy, range-bound markets. The decision to trade within the range or wait for a breakout depends heavily on individual risk tolerance, trading style, and conviction in identifying the range's boundaries. Given the current conflicting signals and the ADX suggesting a strong trend that might be losing steam, patience might indeed be the most rewarding strategy. The market is currently in a 'wait-and-see' mode, and forcing trades in such an environment often leads to suboptimal outcomes.
The Most Likely Path Forward: A Probabilistic View
Assessing the current technical landscape, the most probable scenario for BTCUSD in the immediate short-term appears to be continued consolidation, leaning towards a neutral-to-slightly-bearish bias due to the longer-term downtrend. The daily chart's oversold RSI (31.85) offers a glimmer of hope for a bounce, but the persistent negative MACD momentum and the strong daily downtrend (ADX 33.79) suggest that any upward movement might be corrective rather than a full trend reversal. Therefore, I assign a higher probability to the 'Waiting Game' scenario. Let's estimate the probabilities: The neutral, range-bound scenario holds the highest probability, perhaps around 60-65%. This is driven by the current indecision, mixed signals, and lack of a clear catalyst. The bearish scenario, where support at $59,943 breaks decisively, carries a significant probability of 25-30%, given the dominant daily downtrend. The bullish scenario, requiring a strong break above key resistances like $61,573 and confirmation from longer timeframes, currently seems the least likely, with a probability of 10-15%. This assessment is dynamic and can change rapidly with new data or market events.
The key is that the market is seeking direction. The current consolidation around $59,943 is a temporary state. The conflicting indicators suggest that the market is at a crossroads, and the next significant move will likely be driven by either a fundamental shock or a technical breakout that forces a consensus among market participants. Until then, traders should focus on managing risk within the identified range, waiting for clear signals, and avoiding the temptation to predict the next big move prematurely. The strength of the dollar, inflation expectations, and any regulatory news will be critical factors to monitor as they could provide the necessary impetus for a directional shift.
What I'm Watching This Week: Key Triggers for BTCUSD
Looking ahead to the coming week, my focus will be on several key triggers that could break the current consolidation pattern for BTCUSD. Firstly, I'll be watching the price action around the immediate support at $57,740 and resistance at $60,215. A clear, decisive close above $60,215, particularly on increased volume and accompanied by a bullish MACD signal on the 4-hour chart, would be the first major bullish signal, potentially opening the door for a move towards $61,573. Conversely, a sustained break and daily close below $57,740 would confirm the continuation of the bearish trend, likely leading to a test of $56,020. Secondly, I am monitoring the DXY. If the Dollar Index continues its decline below 101.07, it could provide a tailwind for risk assets like Bitcoin, potentially fueling a move higher. A DXY rally, however, could put additional pressure on BTCUSD. Finally, I'll be keeping an eye on broader market sentiment, particularly the performance of the S&P 500 and Nasdaq. If major equity indices show renewed strength, it could spill over into the crypto market. Conversely, a significant sell-off in equities would likely drag Bitcoin down with it.
The market is currently in a delicate balance, with the $59,943 price point acting as the fulcrum. The interplay between oversold daily conditions and persistent bearish momentum on longer timeframes creates a high degree of uncertainty. Traders should exercise extreme caution, prioritizing risk management and waiting for clear confirmation before committing to significant positions. The absence of a clear trend means that volatility can spike quickly in either direction, making stop-losses essential. The coming week's economic calendar and any significant geopolitical developments will be crucial in determining whether this consolidation phase continues or a new trend begins to form.
Bearish Breakdown: The Path to Lower Lows
30% ProbabilityRange-Bound Consolidation: The Waiting Game
60% ProbabilityBullish Breakout: Reclaiming Higher Ground
10% ProbabilityFrequently Asked Questions: BTCUSD Analysis
What happens if BTCUSD breaks below the $57,740 support level?
A daily close below $57,740 would invalidate the current consolidation and signal a continuation of the bearish trend. This could trigger further selling pressure, targeting the next support at $56,020. The ADX at 33.79 indicates a strong trend is in place, suggesting a breakdown could be swift.
Should I buy BTCUSD at current levels around $59,943 given the RSI at 31.85?
Buying solely based on the oversold RSI at 31.85 is risky, as the MACD remains bearish and the daily trend is down. A low-probability bullish scenario exists if price holds above $59,943 and breaks resistance at $60,215. However, a more prudent approach is to wait for confirmation, such as a bullish MACD crossover or a sustained break above key resistance levels.
Is the MACD signal at -1.05 a sell signal for BTCUSD on the daily chart?
Yes, a negative MACD value of -1.05 with the MACD line below its signal line indicates bearish momentum on the daily chart. While the RSI is oversold, this MACD reading suggests that the underlying trend is still down, and any potential bounce might be corrective rather than a sustained uptrend. Confirmation from price action breaking key resistance is needed to challenge this bearish signal.
How will the weakening DXY around 101.38 affect BTCUSD this week?
A sustained downtrend in the DXY, currently at 101.38, can be a positive catalyst for risk assets like BTCUSD. It suggests a potential shift in global liquidity or risk appetite. If the dollar weakens further, it could provide the necessary tailwind for Bitcoin to attempt a move towards its resistance levels, especially if accompanied by positive on-chain developments.
Technical Outlook Summary
| Indicator | Value | Signal | Interpretation |
|---|---|---|---|
| RSI (14) | 31.85 | Oversold | Suggests potential for bounce, but needs confirmation. |
| MACD Histogram | -1.05 | Negative Momentum | Indicates prevailing bearish trend remains dominant. |
| Stochastic | K: 21.19, D: 26.67 | Oversold | Confirms oversold conditions, but %K |
| ADX | 33.79 | Strong Trend | Indicates a strong trend, but slight downtick suggests waning strength. |
| Bollinger | Middle Band | Watch | Price is below the middle band, indicating bearish pressure. |
Key Levels
Support Levels
Resistance Levels
Track markets in real-time
AI-powered analysis, technical indicators and real-time price data.
Join Our Telegram Channel
Breaking market news, AI analysis and trading signals instantly.
Join Channel