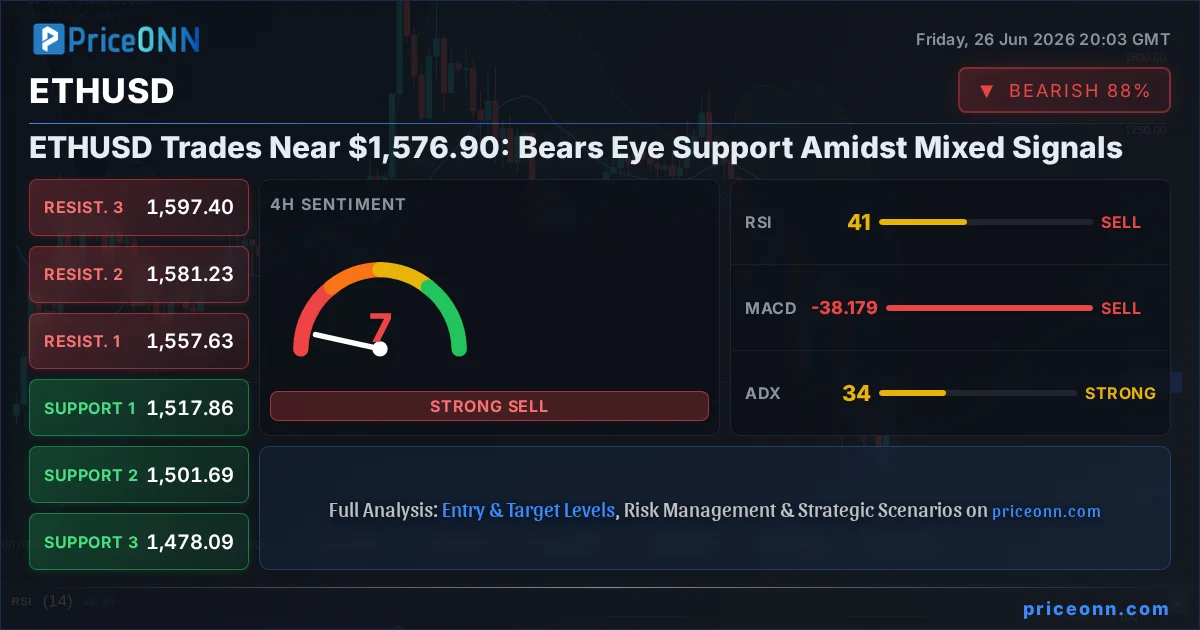
ETHUSD finds itself navigating choppy waters, currently trading near the $1,576.90 mark. This price point, while seemingly stable on the surface, masks a complex interplay of technical signals and underlying market sentiment. The question on every trader's mind is whether this current price action represents a consolidation before the next significant move or a precursor to a deeper retracement. With mixed signals emerging from various timeframes and indicators, understanding the immediate path forward requires a deep dive into the data.
- ETHUSD RSI at 52.19 on 1H signals neutral momentum, but 4H RSI at 40.5 indicates a bearish lean.
- Critical support for ETHUSD is identified at $1,549.55, while resistance looms around $1,595.87.
- The 1D MACD shows positive momentum, but the overall trend strength on the daily chart is a strong 97% bearish.
- Correlation with DXY at 101.38 shows a mixed relationship, suggesting other factors are currently dominating ETHUSD's price action.
The cryptocurrency market, and Ethereum in particular, is at a fascinating juncture. After a period of significant price discovery, we are now seeing a divergence in technical indicators across different timeframes. On the hourly chart, ETHUSD shows a degree of resilience, with RSI at 52.19 suggesting a neutral-to-slightly bullish leaning. The MACD indicator on this timeframe is also displaying positive momentum, with the MACD line above its signal line. This might tempt short-term traders looking for quick gains, as the Stochastic Oscillator K line at 77.67 crosses above the D line at 72.61, indicating a potential for upward movement within this short-term window. However, this optimism is quickly tempered when we zoom out.
Moving to the 4-hour timeframe, the picture becomes decidedly more cautious. The RSI drops to 40.5, firmly in neutral territory but leaning towards a bearish sentiment. This suggests that the bullish momentum seen on the hourly chart might be unsustainable or a trap for unwary buyers. The MACD on the 4-hour chart is below its signal line, indicating negative momentum, a direct contradiction to the hourly view. Furthermore, the ADX at 34.27 points to a strong downtrend, despite the Stochastic Oscillator showing a buy signal with K=32.83 and D=25.93. This conflict between oscillators and trend strength indicators highlights the current indecision in the market. The overall trend strength on the 4H is a significant 92% bearish, which cannot be ignored.
The Daily Grind: A Bearish Undercurrent
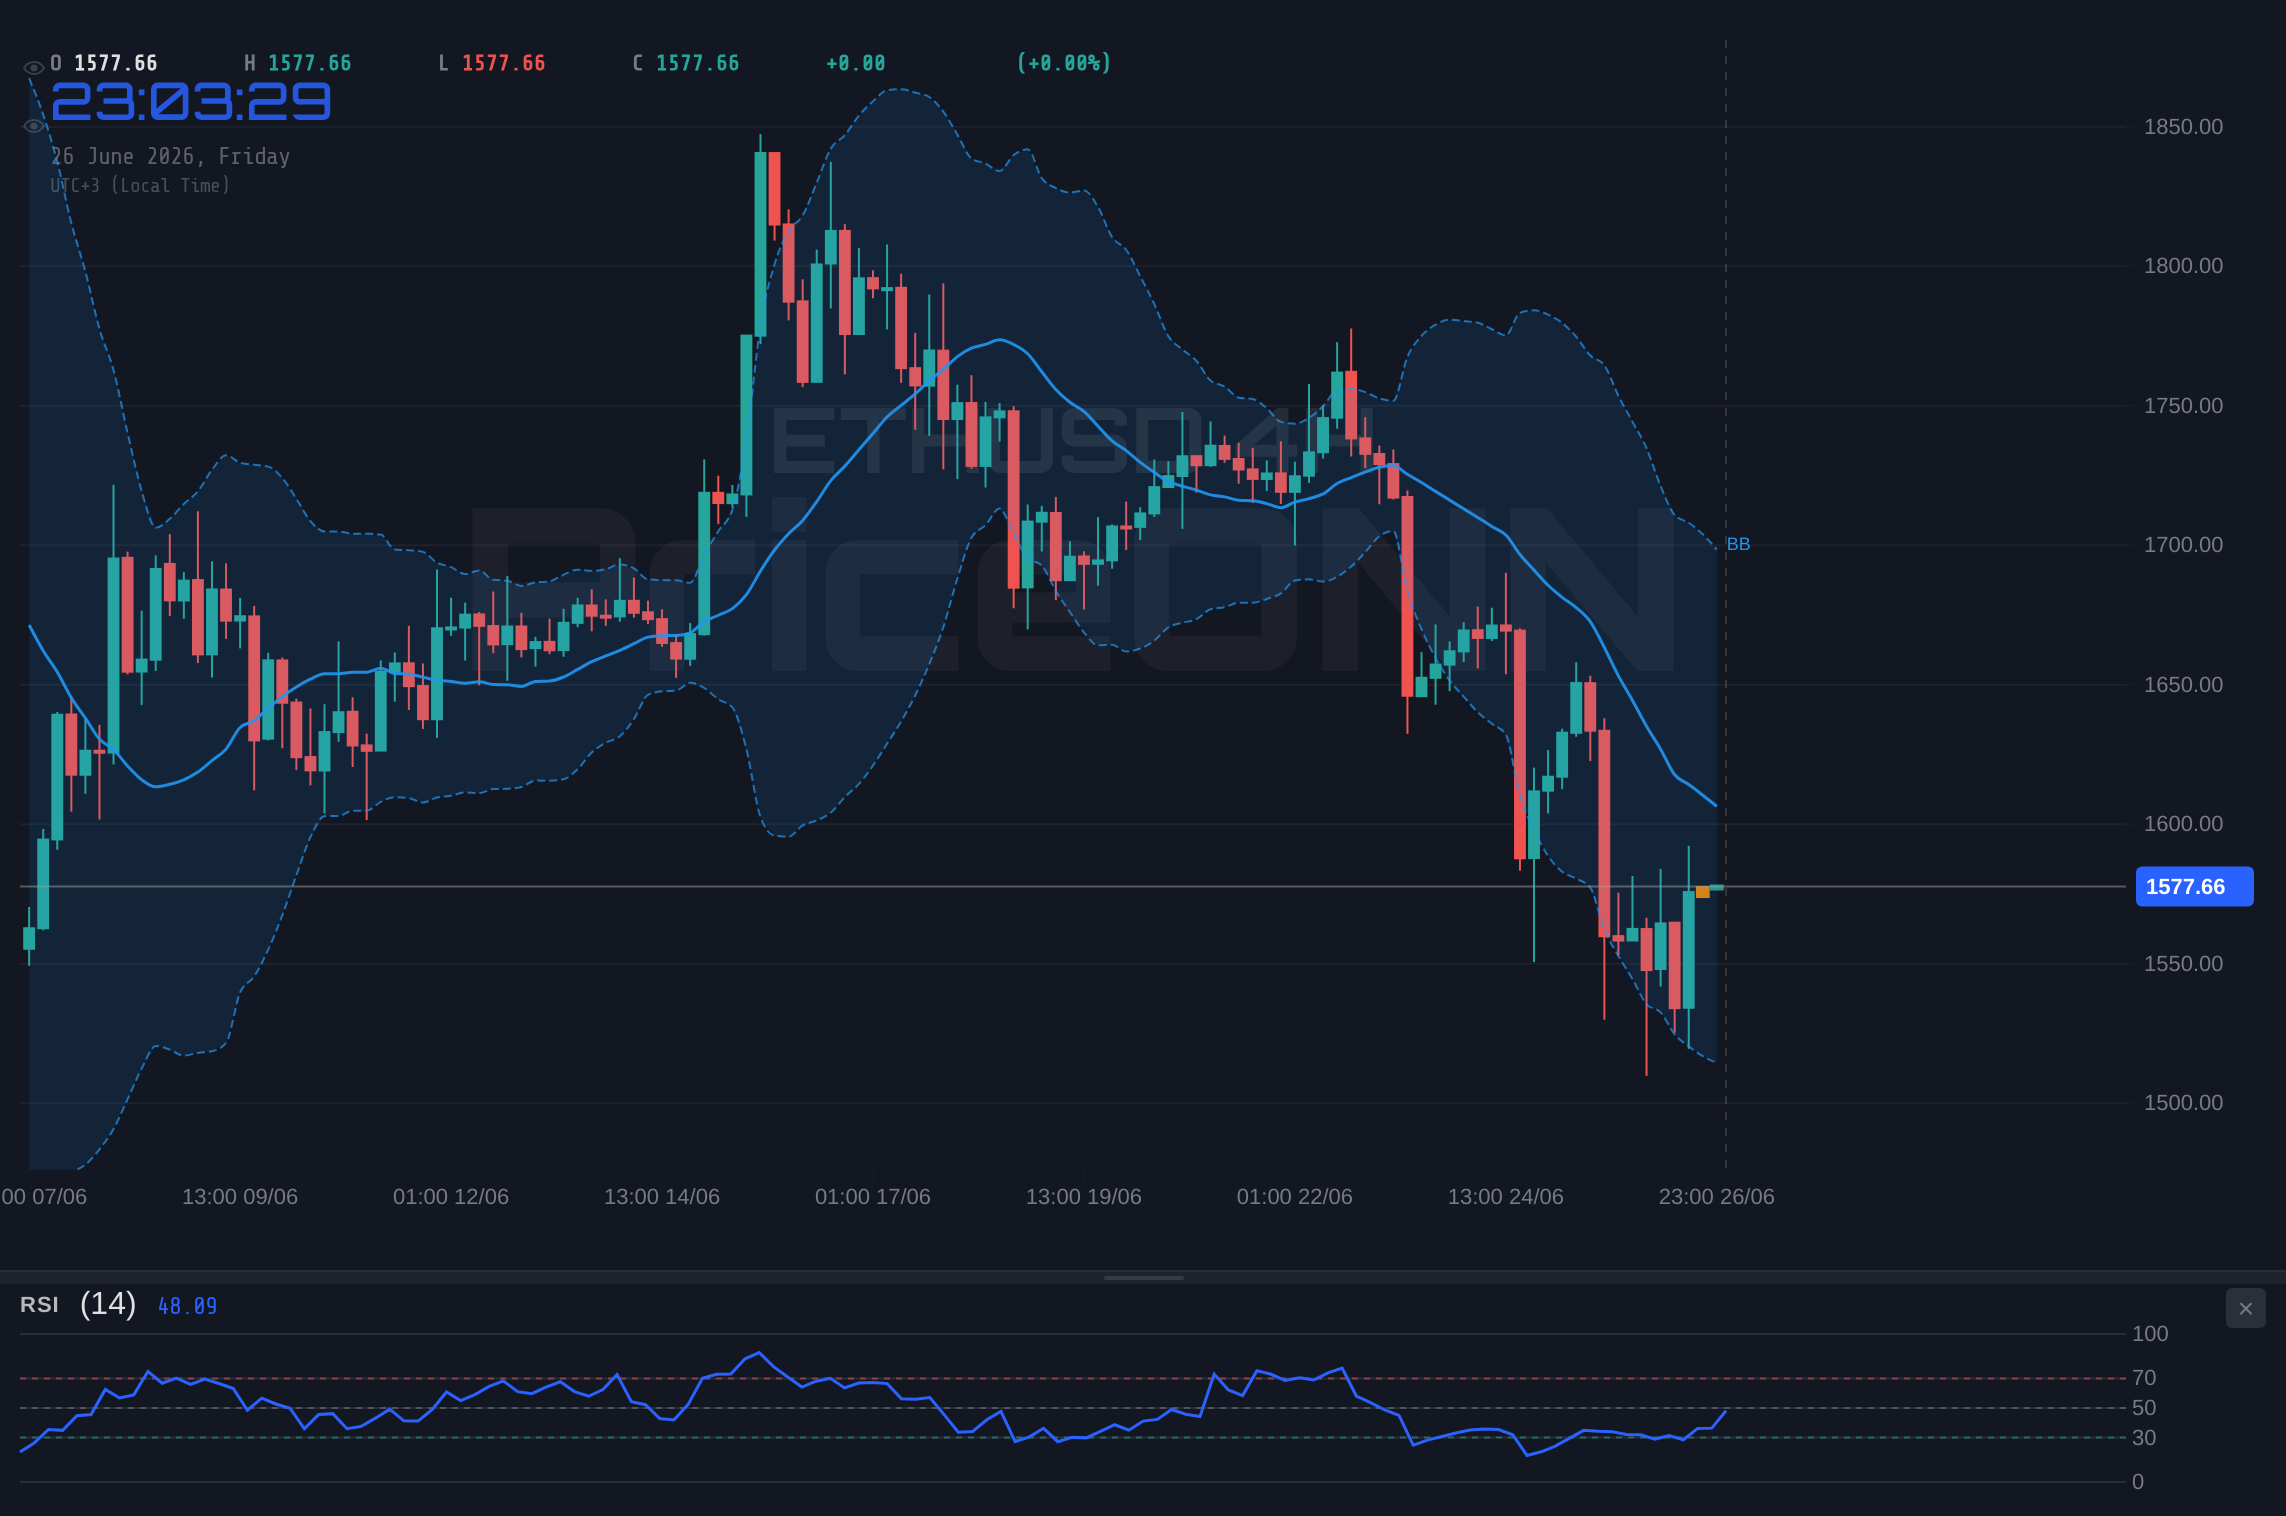
When we step back to the daily chart, the dominant narrative shifts towards a strong bearish bias. The ETHUSD price is firmly below its middle Bollinger Band, and the band itself is widening, suggesting increasing volatility to the downside. The RSI at 33.04 is approaching oversold territory, which historically could signal a buying opportunity. However, this must be viewed in conjunction with other indicators. The MACD on the daily chart is still firmly in negative territory, below its signal line, and the histogram shows diminishing negative momentum, but it has not yet crossed over to signal a bullish reversal. The Stochastic Oscillator is also deep in oversold territory, with K=18.86 and D=27.76, suggesting that a bounce is possible, but the overall trend strength, measured by ADX at 34.11, remains strong and bearish.
This multi-timeframe divergence is a classic sign of a market in transition or consolidation. The hourly chart might be reacting to short-term order flow or minor news events, while the daily chart reflects the prevailing macro and crypto-specific fundamentals. The fact that the 1D trend strength is a commanding 97% bearish is a critical data point. It suggests that any upward moves, especially those seen on the hourly chart, could be mere retracements within a larger downtrend, often referred to as 'dead cat bounces' in trading parlance. Traders must be wary of getting caught on the wrong side of this dominant daily trend. The risk/reward for chasing short-term bullish signals against a strong daily downtrend is typically unfavorable.
Navigating the Levels: Where Does ETHUSD Go Next?
The immediate price action for ETHUSD is heavily influenced by key support and resistance levels. On the hourly chart, we see immediate resistance at $1,580.43, followed by $1,589.66 and the more significant $1,595.87. A clear break and hold above these levels would be necessary to invalidate the short-term bearish outlook and potentially signal a move higher. Conversely, immediate support is found at $1,564.99, with further levels at $1,558.78 and $1,549.55. A decisive break below $1,549.55 would likely accelerate selling pressure, targeting lower levels on the daily chart. The daily support levels are considerably lower, at $1,506.14, $1,454, and $1,378.06, highlighting the significant downside risk if the current bearish trend continues.
The current price of $1,576.90 sits precariously between these short-term levels. The ADX on the hourly chart at 18.8 suggests a weak trend, meaning price action could be choppy and range-bound until a catalyst emerges. However, the 4-hour ADX at 34.27 points to a strong downtrend, and the daily ADX at 34.11 reinforces this. This conflict implies that while short-term price action might be indecisive, the underlying pressure remains bearish. The prevailing market sentiment, as reflected in the daily indicators, suggests that any rallies are likely to be met with selling pressure, especially as price approaches the higher resistance zones.
Correlation and Macro Context: DXY and Equities
Understanding ETHUSD's price action also requires considering its correlation with broader market indicators. The US Dollar Index (DXY) is currently trading around 101.38, showing a slight daily decline of 0.1%. On the 1-hour chart, DXY shows a neutral trend with a slight bullish bias, while the 4-hour shows a strong bearish trend and the daily chart a strong bullish trend. This mixed picture for the dollar adds another layer of complexity. Historically, a weakening dollar can be bullish for crypto assets like ETHUSD, as it often correlates with increased risk appetite. However, the current data shows a somewhat mixed correlation, suggesting that other factors are currently weighing more heavily on ETHUSD's price than the dollar's movement alone.
The performance of major stock indices like the S&P 500 and Nasdaq provides further context. The S&P 500 is up 0.74% to 6572.87, showing a strong bullish trend on the 1-hour and 4-hour charts, but a bearish trend on the daily. The Nasdaq 100, on the other hand, is down 1.26% to 29081.79, exhibiting a bearish trend across most timeframes. This divergence in equity markets suggests a cautious approach to risk assets. A decline in the Nasdaq, often a bellwether for tech and growth-oriented assets, could spill over into the crypto market, including ETHUSD. The fact that the Nasdaq is showing a strong bearish trend on the 4-hour chart (ADX 46.85) is a concern for ETHUSD bulls, as crypto often follows the tech-heavy index.
The Energy Factor: Inflationary Signals?
Oil prices, particularly Brent crude, are also a crucial indicator for inflation expectations and geopolitical risk. Brent is currently trading down 2.87% at $72.75, with a strong bearish trend indicated across the hourly and daily charts. This decline in oil prices could signal easing inflation concerns, which might reduce the urgency for central banks like the Federal Reserve to maintain aggressive monetary policies. Lower inflation expectations can sometimes translate into increased risk appetite, potentially benefiting assets like ETHUSD. However, the significant drop in oil prices could also reflect weakening global demand, which would be a negative macroeconomic signal for all risk assets.
The WTI crude oil price is also down 2.65% at $70.03, mirroring the trend in Brent. Both energy benchmarks show strong bearish signals on the 4-hour and daily charts, with RSI in oversold territory. This suggests that the energy market anticipates lower demand or a de-escalation of geopolitical tensions that might have previously supported prices. For ETHUSD, this scenario could be interpreted in two ways: either reduced inflation fears allow for a more dovish stance from central banks, supporting risk assets, or it points to a broader economic slowdown, which would dampen demand for speculative assets like cryptocurrencies.
Crypto-Specific Fundamentals: What's Happening Under the Hood?
Beyond the macro and technical picture, the health of the Ethereum ecosystem itself plays a vital role. While specific on-chain metrics like active addresses, whale movements, or exchange flows were not provided in the market data, we can infer potential trends. The current price action, particularly the bearish signals on the daily chart, suggests that cumulative selling pressure might be outweighing buying interest. If exchange inflows are increasing, it would indicate more supply entering the market, potentially pushing prices lower. Conversely, declining exchange balances and increasing whale accumulation would be bullish signals.
Developments in the DeFi and NFT space also influence ETHUSD. A decline in Total Value Locked (TVL) in DeFi protocols on Ethereum, or a significant drop in NFT trading volumes, would indicate reduced network activity and demand for ETH. This would reinforce the bearish technical outlook. Conversely, innovative new DeFi applications, a surge in NFT sales, or positive developments in Ethereum's scalability solutions (like Layer 2 adoption) could provide a fundamental tailwind. Regulatory news remains a constant factor; any clarity or new developments regarding crypto regulations, particularly in major jurisdictions like the US or EU, can trigger significant price movements.
The dominance of Bitcoin (BTCUSD) over the altcoin market is another crucial factor. Although BTCUSD data wasn't provided, if Bitcoin is showing strength while ETHUSD is struggling, it might indicate a 'flight to safety' within the crypto market, with investors preferring the perceived stability of Bitcoin. If ETHUSD is underperforming Bitcoin significantly, it suggests a lack of confidence in Ethereum's specific prospects or a broader risk-off sentiment within crypto. Institutional adoption trends, such as the approval of crypto ETFs or increased corporate treasuries holding ETH, can also provide significant boosts, but the current price action doesn't seem to be driven by such positive news.
The Trade Decision: A Watchful Stance
Given the conflicting signals across different timeframes and the strong bearish undertone on the daily chart, the most prudent approach for ETHUSD currently is a 'WATCH_ZONE' strategy. The technical picture does not yet present a clear, high-conviction trading setup. The hourly chart offers short-term bullish signals, but these are overshadowed by the dominant daily bearish trend and the weak trend strength indicated by the ADX on lower timeframes. Chasing short-term moves against the prevailing daily trend carries significant risk, especially when the longer-term indicators are flashing cautionary signs.
For a valid bullish setup to emerge, we would need to see a clear break and sustained hold above the key daily resistance level of $1,634.22. This would need to be accompanied by a shift in daily indicators – a bullish MACD crossover, RSI moving decisively above 50, and ideally, an increase in ADX to confirm a new uptrend. On the flip side, a bearish setup would be confirmed by a decisive break below the daily support at $1,506.14. This would likely be signaled by all indicators turning bearish, with the ADX remaining strong. Until such clear signals emerge, it is advisable to remain on the sidelines and observe how price action develops around the current levels.
Looking Forward: What to Watch Next
The immediate future for ETHUSD will likely be dictated by its ability to hold the crucial support at $1,549.55. A failure here could lead to a rapid descent towards the $1,506.14 level, especially if broader risk sentiment deteriorates. Conversely, a sustained push above the hourly resistance cluster around $1,580-$1,595 could provide a brief respite, but the daily bearish trend would need to be overcome for any significant upside continuation. Traders should closely monitor the Nasdaq 100's performance, as its bearish trend could exert downward pressure on ETHUSD. Any significant shifts in DXY or oil prices should also be noted for their potential impact on inflation expectations and risk appetite.
The interplay between short-term bullish signals and the dominant daily bearish trend creates a high degree of uncertainty. This is a market where patience is paramount. Waiting for confirmation of a clear trend direction, rather than trying to anticipate the turn, is the wisest course of action. The current price action around $1,576.90 offers little clarity, and forcing a trade here could lead to unnecessary risk. The market is cyclical, and opportunities will arise. For now, observing the levels and waiting for a more defined setup is the strategy that aligns with sound risk management principles.
Frequently Asked Questions: ETHUSD Analysis
What happens if ETHUSD breaks below the $1,549.55 support level?
A break below $1,549.55 on ETHUSD would likely trigger further selling pressure, targeting the daily support at $1,506.14. This would confirm the prevailing bearish trend indicated by daily MACD and ADX, suggesting a continuation of the downtrend.
Should I buy ETHUSD at current levels of $1,576.90 given the hourly bullish signals?
Buying at $1,576.90 based solely on hourly bullish signals is risky due to the strong daily bearish trend (97% strength). A high-probability setup would require a confirmed daily trend reversal, with price holding above $1,634.22 resistance.
Is the RSI at 40.5 on the 4-hour chart a sell signal for ETHUSD?
An RSI of 40.5 on the 4-hour chart suggests a bearish lean but isn't an outright sell signal on its own. It indicates downward momentum is present, aligning with the strong daily downtrend, but confirmation from other indicators like MACD and ADX is crucial.
How will the Nasdaq 100's bearish trend affect ETHUSD this week?
The Nasdaq 100's bearish trend (4H ADX 46.85) can negatively impact ETHUSD, as crypto often follows tech stocks. If the Nasdaq continues to fall, it could exacerbate selling pressure on ETHUSD, potentially pushing it towards its lower support levels.
Bearish Scenario: Downward Pressure Mounts
65% ProbabilityNeutral Scenario: Consolidation Zone
25% ProbabilityBullish Scenario: Reversal Attempt
10% ProbabilityTrack markets in real-time
AI-powered analysis, technical indicators and real-time price data.
Join Our Telegram Channel
Breaking market news, AI analysis and trading signals instantly.
Join Channel