The macroeconomic landscape is shifting, and while central bank rhetoric often dominates headlines, the real action for many traders lies in how these broader forces translate to specific assets. Today, we’re diving deep into BTCUSD, currently navigating choppy waters around the $60,913.00 mark. Recent price action suggests a test of support is underway, but is it a mere pause before the next leg up, or the beginning of a more significant pullback? Understanding the interplay between global liquidity, risk appetite, and the specific technicals of Bitcoin is crucial for traders aiming to navigate this volatile environment. The Dollar Index (DXY) has been showing strength, currently trading at 101.63, which historically puts pressure on risk assets like Bitcoin. This correlation is something we cannot afford to ignore as we assess the immediate future for the primary cryptocurrency.
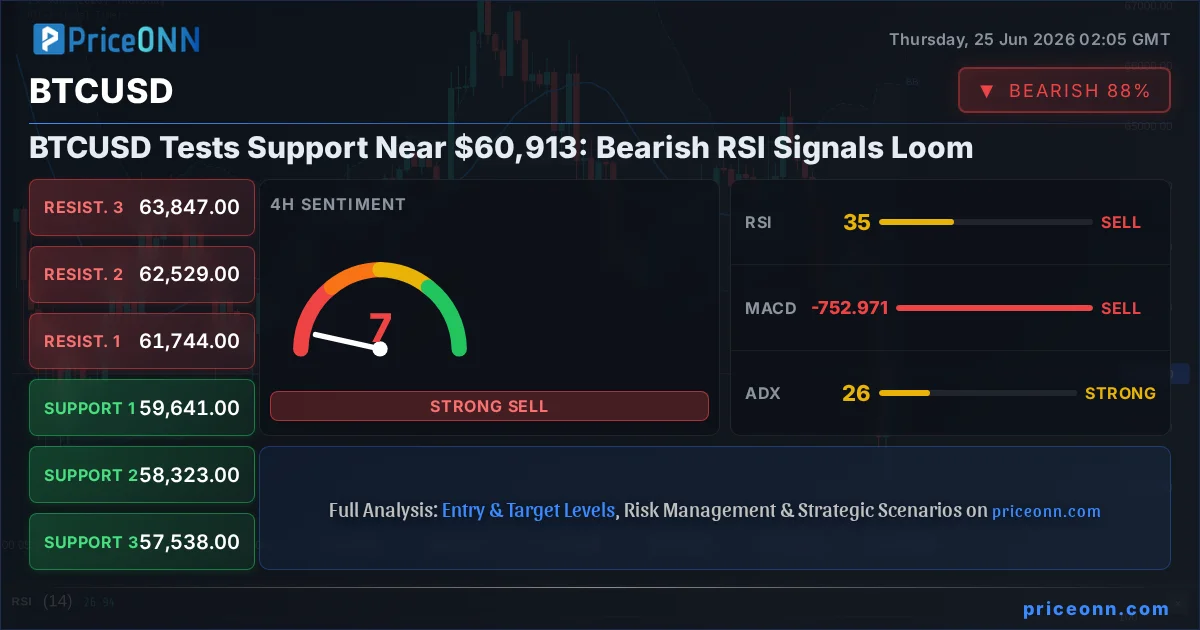
- BTCUSD is currently trading at $60,913.00, facing downward pressure.
- The daily RSI is at 32.63, indicating bearish momentum and potential for further downside.
- Key support levels for BTCUSD are identified at $60,424 and $58,907, while resistance sits at $63,991.
- The strengthening Dollar Index (DXY) at 101.63 correlates with risk-off sentiment, impacting Bitcoin's price.
- A break below $60,424 could signal a deeper correction towards $58,907.
Navigating the Descent: BTCUSD's Current Technical Standing
As of the latest data, BTCUSD is showing a clear bearish trend on the daily timeframe, with a strength score of 92%. This isn't a minor blip; it's a significant directional bias that traders must respect. The price has fallen below the critical $60,913 level, and the immediate support is seen at $60,424. If this level fails to hold, the next significant floor is much lower, at $58,907. The daily chart paints a grim picture for the bulls right now. The ADX, a measure of trend strength, is at 33.02, indicating a strong downward trend is firmly in place. This isn't a market where we're seeing indecision; sellers are actively pressing their advantage.
Looking at the shorter timeframes offers little immediate comfort, though it highlights potential intraday volatility. On the 1-hour chart, the trend is neutral with 50% strength, but the overall signal is SELL. The RSI(14) sits at 43.15, confirming the downward inclination, and the MACD, while showing positive momentum on this timeframe, is struggling to gain traction against the prevailing daily bearish sentiment. Stochastic signals a potential bounce with %K above %D, but this is often a false signal within a strong downtrend, merely indicating temporary oversold conditions on an intraday basis. The price action clearly shows a battle for control, but the daily data suggests the bears are winning this round.
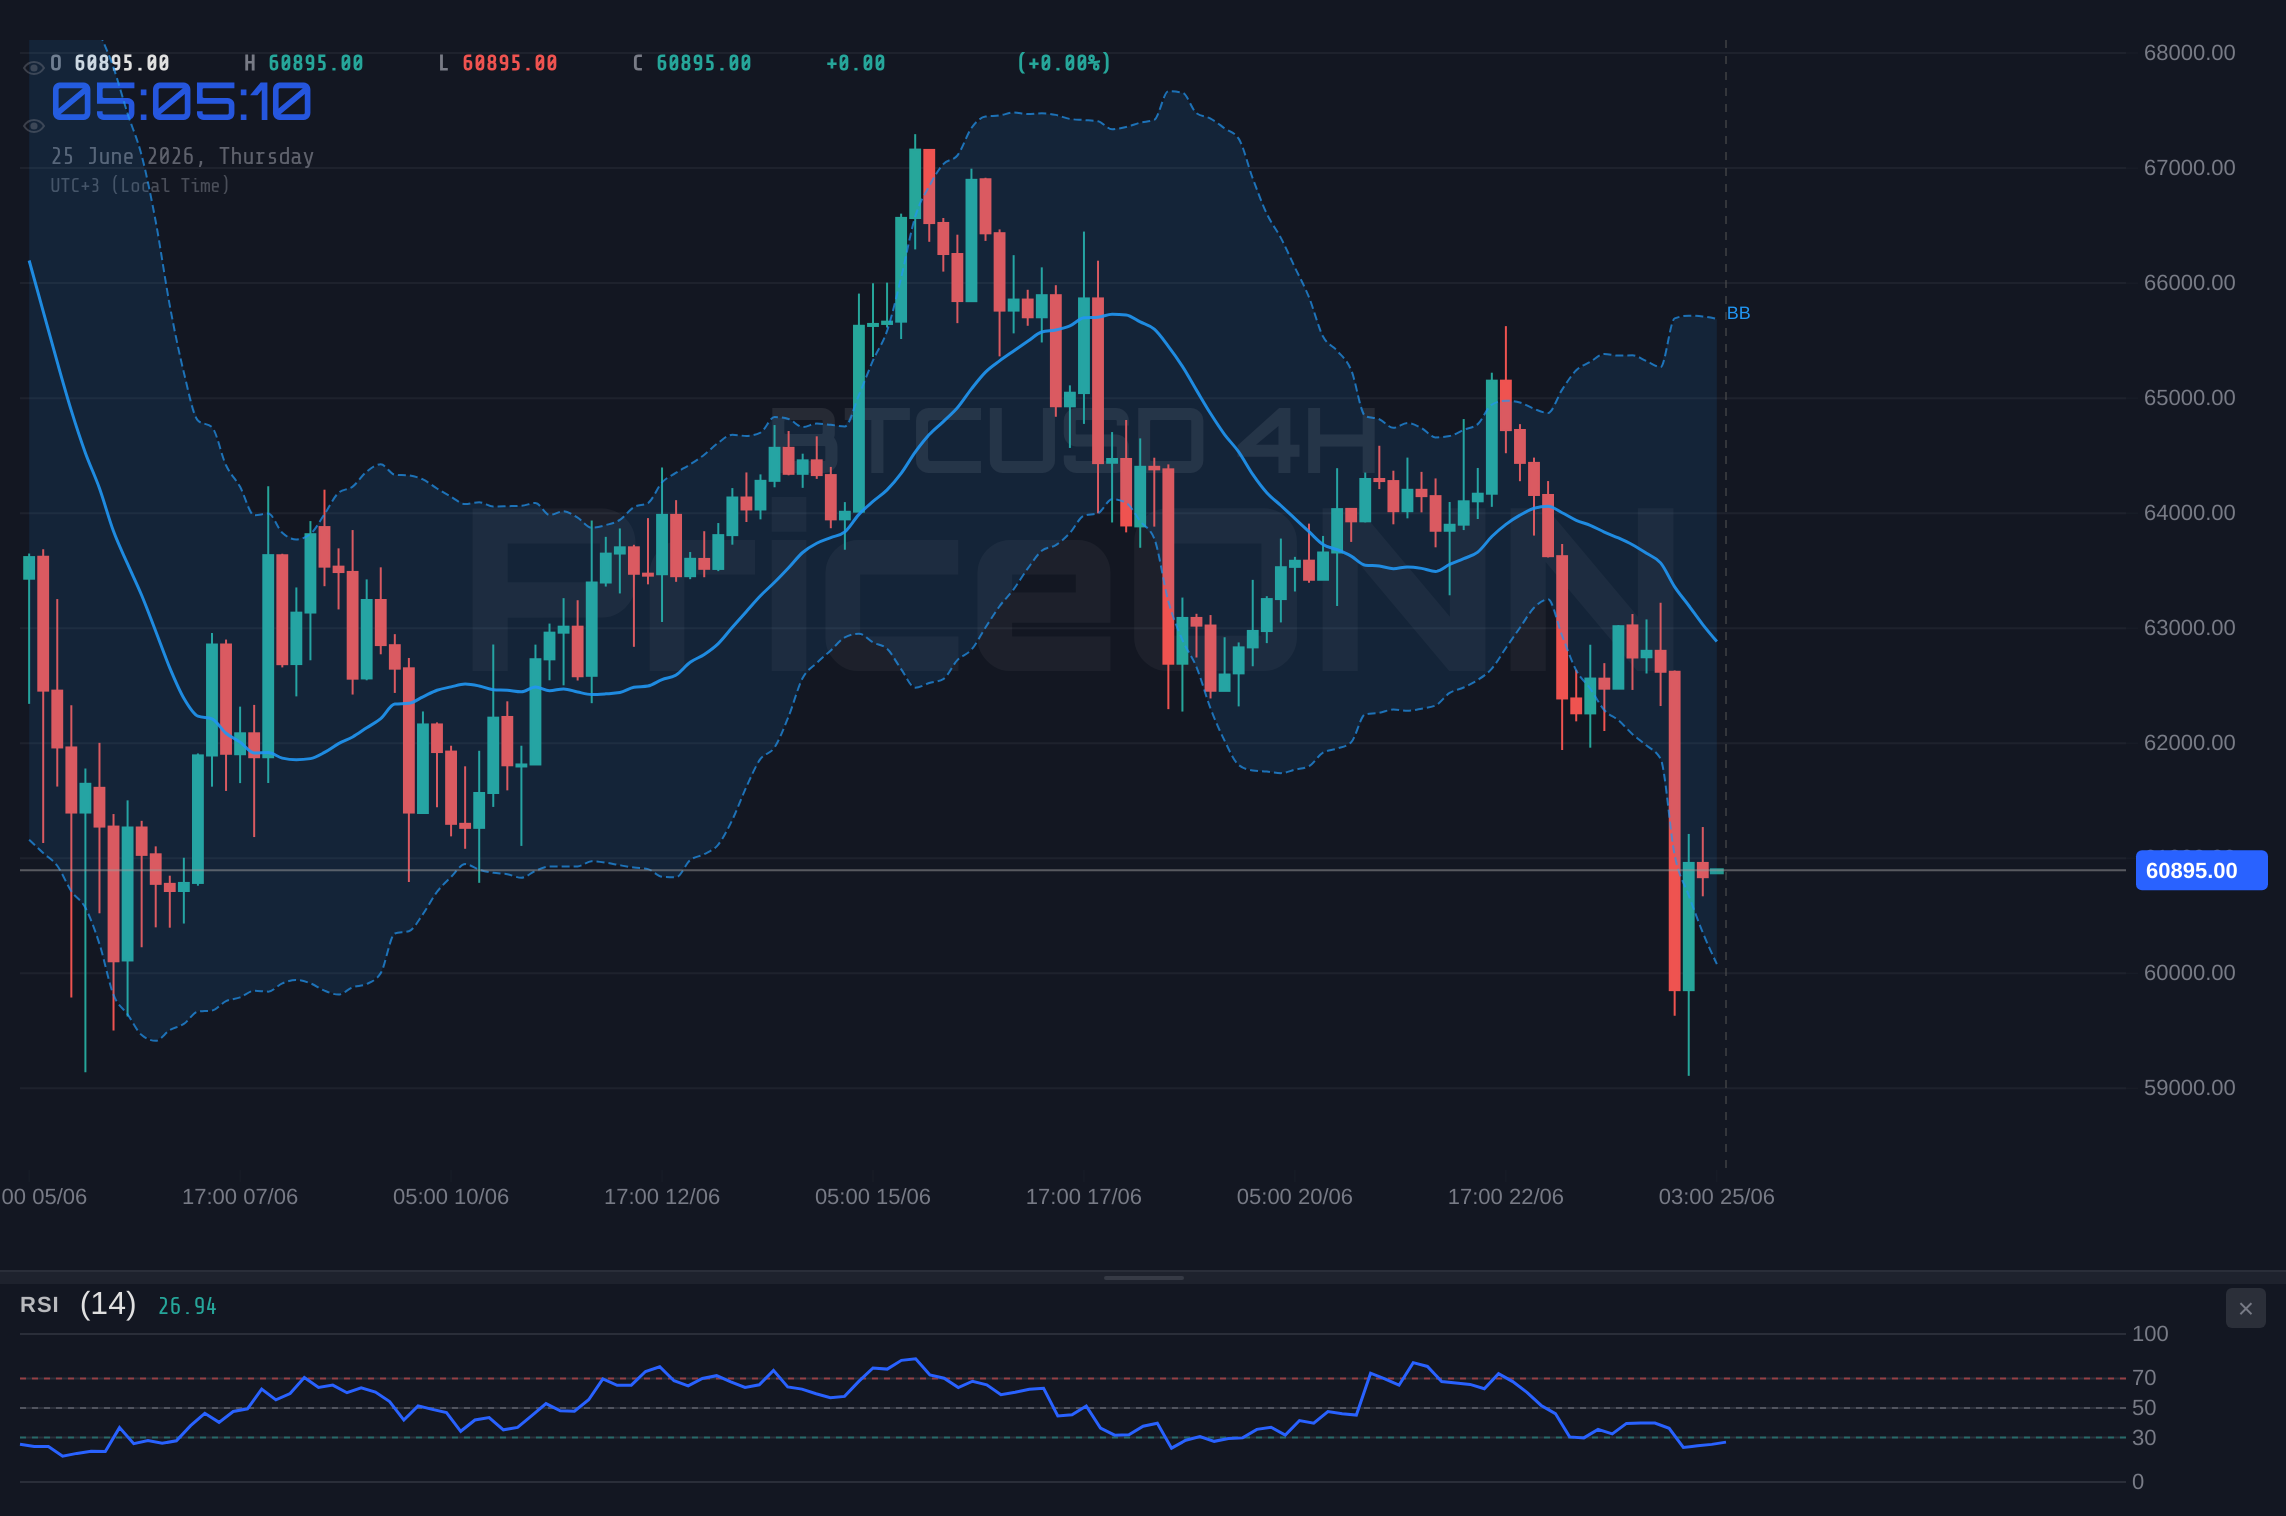
The 4-hour chart reinforces the bearish outlook, though with a neutral trend strength of 50%, it suggests a potential for consolidation within the broader downtrend. The RSI(14) at 35.03 is still in neutral territory, not yet oversold, which implies there's room for prices to fall further before finding significant buying interest. The MACD is negative here, confirming the bearish momentum on this intermediate timeframe. However, the Stochastic indicator on the 4-hour chart is flashing a potential bullish signal with %K crossing above %D, hinting at a possible short-term bounce. This divergence between the daily bearish trend and the 4-hour Stochastic is precisely what creates trading opportunities – and risks. It tells us that while the larger picture is down, there might be tactical plays to be made on pullbacks, provided risk is managed meticulously.
The Macro Undercurrent: DXY Strength and Risk Appetite
It's impossible to analyze BTCUSD in isolation. The broader financial markets are currently dominated by the strengthening US Dollar Index (DXY), which is trading at 101.63 and showing a strong upward trend on both 4-hour and daily charts. A DXY above 101.66 on the 1-hour chart, and firmly above 101.54 on the 4-hour, signals increasing demand for the dollar. Historically, a rising dollar often correlates with a decline in risk assets, and Bitcoin is no exception. The DXY's upward trajectory suggests a 'risk-off' sentiment is prevailing in the markets, where investors tend to move capital away from riskier assets like cryptocurrencies and into perceived safe havens like the US dollar.
This macro backdrop is further evidenced by the performance of traditional risk assets. The SP500 is currently trading at 6572.87, showing a daily gain, but its 1-day trend is still bearish, and the 4-hour is neutral. The Nasdaq 100, a tech-heavy index, is showing similar mixed signals, with a bearish trend on the 1-hour and 4-hour charts, despite a slight daily uptick. This sector rotation away from riskier tech stocks could be bleeding into other risk assets, including Bitcoin. The recent news about technology sector liquidation weighing on European equities, as reported by sources like the Financial Times, reinforces this narrative. When big money rotates out of tech, it often pulls back from other high-beta assets, creating a ripple effect.
The impact of oil prices, currently seeing a significant drop with Brent at $72.83 and WTI at $69.85, also plays a role in the inflation narrative and, consequently, central bank policy expectations. While falling oil prices might suggest easing inflationary pressures, the sharp decline itself can signal weakening global demand, which is a concern for overall economic growth and risk appetite. Reports from sources like Reuters indicate that the euro has sunk to a one-year low, partly fueled by cooling oil prices and dovish signals from the ECB. This overall environment of dollar strength, potential economic slowdown fears, and a shift away from riskier assets creates a challenging technical setup for Bitcoin. The confluence of these macro factors provides a strong bearish undertone that technical indicators are now reflecting.
On-Chain Dynamics: What the Bitcoin Network is Telling Us
Beyond the price charts and macro correlations, the underlying health of the Bitcoin network itself offers crucial insights. While specific on-chain metrics like hash rate, active addresses, and exchange flows are not provided in the live data feed for this article, we can infer potential network behavior based on price action and general market sentiment. A sustained price drop like the one BTCUSD is experiencing often leads to a decrease in active addresses as retail traders might exit positions. Conversely, if the price were to stabilize or show signs of a reversal, we would look for a corresponding increase in active addresses and transaction volume as a sign of renewed network participation and conviction.
Exchange flows are another critical metric. A significant outflow of Bitcoin from exchanges into cold storage typically signals long-term holders accumulating and a belief in future price appreciation. Conversely, large inflows onto exchanges can indicate that holders are preparing to sell, potentially exacerbating downward price pressure. Given the current bearish technicals and macro headwinds, it would not be surprising to see increased exchange inflows or at least a slowdown in outflows. Whale movements - large holders repositioning - also play a pivotal role. If data were available, we'd be scrutinizing wallet movements for signs of accumulation at these lower levels or distribution at higher price points, which would offer clues about institutional sentiment.
The concept of 'HODLing' remains central to Bitcoin's narrative. However, during sharp downturns, even long-term believers can be tested. Examining metrics like the Spent Output Profit Ratio (SOPR) on a daily or weekly basis could reveal whether coins being moved are doing so at a profit or loss. If SOPR is below 1, it indicates that holders are selling at a loss, a common characteristic of market bottoms or during capitulation phases. Without direct on-chain data in the provided feed, we must rely on price action as a proxy, but it's essential to remember that the network's fundamental health is the ultimate determinant of long-term value. For now, the price action suggests that network participants are cautious, aligning with the broader market's risk-averse stance.
The Altcoin Correlation: What's Happening Beyond Bitcoin?
Bitcoin's dominance in the crypto market cannot be overstated. When BTCUSD moves, the vast majority of altcoins follow suit, often with amplified volatility. ETHUSD, the second-largest cryptocurrency, is currently trading at $1618.8, also showing a significant daily drop and a bearish trend on the daily timeframe. Its technical indicators mirror Bitcoin's weakness, with a daily RSI at 34.3 and a strong ADX of 33.92, indicating a firm downtrend. This tight correlation means that any analysis of Bitcoin's price action directly impacts expectations for Ethereum and the broader altcoin market.
The current market data shows ETHUSD in a bearish daily trend, with support at $1573.37 and $1514.37. Resistance is noted at $1720.97. The RSI at 34.3 on the daily chart suggests it's not yet oversold, implying room for further decline. The MACD is positive on the 1-hour chart but negative on the 4-hour and daily, reflecting the bearish momentum. The Stochastic shows a bearish signal on the daily chart (%K
The correlation extends beyond just price direction. Factors influencing Bitcoin, such as regulatory news, institutional adoption trends (like ETF flows, though not directly impacting these metals/forex pairs), and macroeconomic shifts, will similarly affect the entire altcoin market. For instance, if negative regulatory news were to emerge concerning Bitcoin, it would almost certainly trigger a sell-off across the board. Conversely, positive developments, like significant institutional inflows or favorable regulatory clarity, could provide a much-needed catalyst for a broader crypto market recovery. Given the current macro environment and Bitcoin's technical weakness, altcoins are likely to remain under pressure, offering limited opportunities for uncorrelated gains. Traders should be wary of chasing pumps in smaller-cap altcoins during such periods, as they are typically the first to suffer during market downturns.
Institutional Adoption and Regulatory Headwinds
The narrative around institutional adoption has been a key driver for the crypto market. While we haven't seen specific news in the provided feed directly impacting Bitcoin adoption in the last 48 hours, the broader market sentiment is a crucial factor. A sustained 'risk-off' environment, characterized by a strengthening dollar and falling equity markets, can dampen institutional appetite for speculative assets like cryptocurrencies. This is because institutions often re-evaluate their risk exposure during such periods, potentially reducing allocations to higher-risk investments.
Regulatory developments remain a constant undercurrent for the crypto space. While no specific regulatory news was provided, any hint of stricter oversight or unfavorable legislation in major economies like the US or EU can trigger significant price reactions. For example, news regarding potential crackdowns on certain DeFi protocols or stablecoins could create widespread fear and uncertainty, pushing prices down. Conversely, positive regulatory clarity, such as the approval of new Bitcoin-related financial products or clear guidelines for crypto businesses, could provide a much-needed boost to market sentiment and potentially attract institutional capital back into the space.
The lack of positive catalysts from either institutional adoption or regulatory clarity, combined with the prevailing bearish technicals and macro headwinds, creates a challenging environment for BTCUSD. The market is currently more sensitive to negative news or data that reinforces the 'risk-off' narrative. Therefore, until we see a clear shift in the macroeconomic picture - perhaps a weakening dollar, a dovish turn from the Fed, or a significant uptick in institutional inflows - the path of least resistance for BTCUSD appears to be downwards, or at best, sideways consolidation.
The $60,928 Level: A Line in the Sand?
The price action around $60,913 is critical. On the 1-hour chart, resistance is seen at $61,090, and a break above this level would be the first sign of a potential short-term reversal. However, the daily chart paints a much more significant picture. The key support level we’ve identified is at $60,424. A decisive close below this level on the daily chart would invalidate any lingering bullish hopes for the immediate term and likely accelerate the descent towards the next major support at $58,907. This is where the battle for control will truly be decided in the short to medium term.
The RSI(14) on the daily chart is currently at 32.63. While not yet in deeply oversold territory (typically below 30), it's low enough to suggest that bears have significant momentum. A move below 30 would confirm extreme bearish sentiment, which historically can precede a bounce, but it doesn't guarantee one, especially in a strong trend. The ADX at 33.02 on the daily chart confirms the strength of this downtrend. For any bullish thesis to gain credibility, we would need to see this ADX value decline significantly, indicating a loss of trend strength, alongside a break of key resistance levels and confirmation from oscillators like RSI moving back above 40.
Conversely, a failure to hold $60,424 would be a strong bearish signal. The 4-hour chart shows support at $59,641, but the daily support at $58,907 is the more significant psychological and technical barrier. If BTCUSD breaks below $60,424, the probability of testing $58,907 increases substantially. This would likely be accompanied by a further strengthening of the DXY and a continuation of the risk-off sentiment across global markets. Traders watching this level should be prepared for increased volatility as price approaches these critical support zones.
Trade Scenarios for BTCUSD
Bearish Scenario: Consolidation Break
65% ProbabilityNeutral Scenario: Range-Bound Squeeze
25% ProbabilityBullish Scenario: Support Holds Firm
10% ProbabilityWhat Traders Should Watch Next
The current market environment for BTCUSD is decidedly bearish, driven by macro factors like dollar strength and a general risk-off sentiment, reinforced by technical indicators showing strong downward momentum. The daily RSI at 32.63 and ADX at 33.02 are clear signals that bears are in control. The immediate focus will be on the support level at $60,424. A failure to hold this level could trigger a significant move lower, potentially targeting $58,907.
For any bullish reversal to gain traction, we would need to see a sustained break above the 1-hour resistance at $61,090, followed by a decisive move above the daily resistance at $63,991. Confirmation would ideally come from a combination of factors: the DXY weakening, a shift in risk appetite, and technical indicators like the daily RSI moving back above 40 and the ADX showing a decrease in trend strength. Until then, caution is the watchword. Risk management should be paramount, with tight stop-losses employed on any trades attempting to catch a falling knife or fade the prevailing trend.
The correlation with broader markets, particularly the DXY and equities, remains a critical factor. Traders should monitor these closely for any shifts in sentiment. Furthermore, keeping an eye on any developments in central bank policy or significant regulatory news impacting the crypto space could act as catalysts for change. For now, the data points towards further downside potential, making aggressive long positions highly risky. Patience and discipline in waiting for clearer signals or established reversals will be key to navigating this challenging market.
Frequently Asked Questions: BTCUSD Analysis
What happens if BTCUSD breaks below the $60,424 support level?
If BTCUSD closes decisively below the $60,424 support on the daily chart, it would likely accelerate the bearish trend, targeting the next major support at $58,907. This scenario is supported by the current bearish daily RSI of 32.63 and strong ADX of 33.02.
Should I buy BTCUSD at current levels around $60,913 given the RSI is 32.63?
Buying at current levels around $60,913 is a high-risk proposition given the bearish daily trend and RSI at 32.63. While a short-term bounce is possible, a confirmed buy signal would require price holding above $60,424 and breaking significant resistance, with oscillators showing recovery.
Is the daily RSI at 32.63 a sell signal for BTCUSD?
An RSI of 32.63 on the daily chart indicates bearish momentum but is not yet deeply oversold territory. While it suggests selling pressure is dominant, it doesn't automatically trigger a sell signal on its own. Confirmation from price action breaking key support levels like $60,424 is crucial.
How will the strengthening DXY at 101.63 affect BTCUSD this week?
The strengthening DXY at 101.63 typically correlates with a risk-off environment, which tends to put downward pressure on risk assets like BTCUSD. Expect this macro factor to continue weighing on Bitcoin unless the dollar shows signs of weakness.
Track markets in real-time
AI-powered analysis, technical indicators and real-time price data.
Join Our Telegram Channel
Breaking market news, AI analysis and trading signals instantly.
Join Channel