The relentless tug-of-war between bulls and bears in the Bitcoin market has reached a critical juncture, with BTCUSD hovering precariously around the $59,459 support level. This pivotal moment is amplified by a confluence of technical signals, most notably a bearish divergence on the Relative Strength Index (RSI), suggesting that the recent upward momentum might be losing steam. As traders and investors scrutinize every tick and pattern, the question on everyone's mind is whether this support will hold, or if the bears are poised to reclaim control and push prices lower. This analysis dives deep into the current technical landscape, weighing the arguments for both a bullish continuation and a bearish reversal, while also considering the broader market context and potential catalysts.
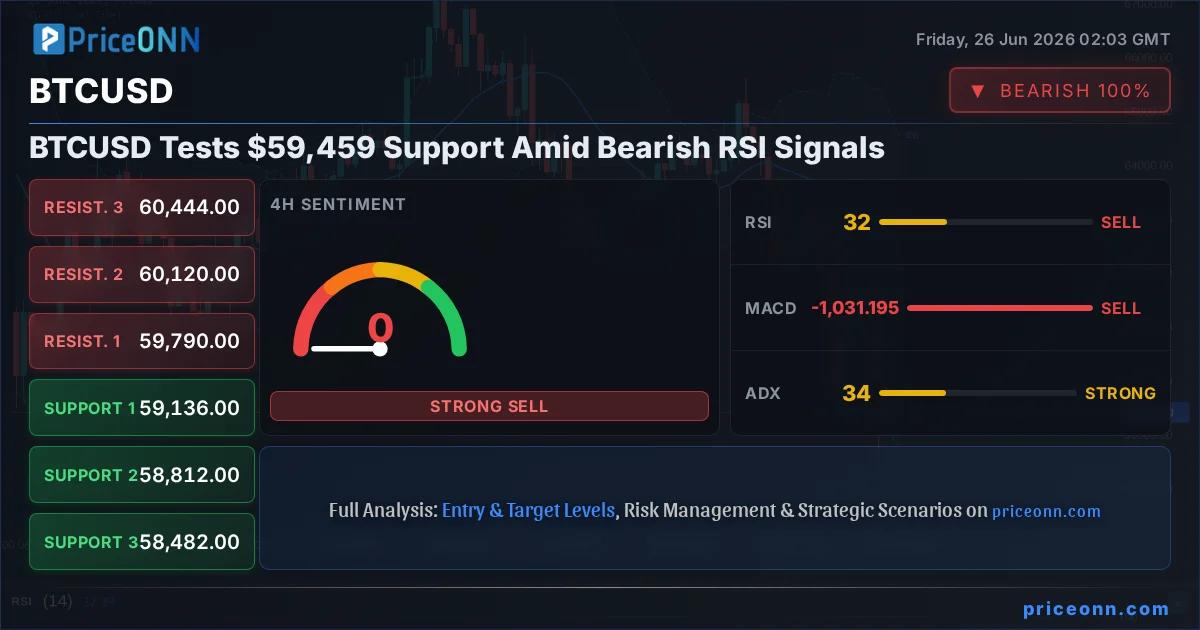
- The Relative Strength Index (RSI) at 40.91 on the 1H chart and 31.81 on the 4H chart suggests weakening bullish momentum and potential oversold conditions.
- BTCUSD is currently testing critical support at $59,459, with further levels at $59,305 and $58,482 on the lower timeframes.
- Resistance is forming around $59,837 and $60,103 on the 1H chart, and $60,444 on the 4H chart, defining the immediate trading range.
- The MACD histogram shows mixed signals across timeframes, with some positive momentum on the 1H but negative momentum on the 4H and 1D, indicating a lack of clear directional conviction.
- The overall trend on the 1D chart remains bearish (97% strength), despite short-term consolidation, highlighting the importance of the current support test.
The Bullish Case: Holding the Line at $59,459
Rally Continuation Amidst Technical Weakness
Despite the cautionary flags raised by the RSI, the bulls are not yet ready to concede defeat. On the 1-hour timeframe, the MACD is showing positive momentum, trading above its signal line, which often precedes a short-term uptick in price. This indicator, combined with the price action holding above the $59,459 support, suggests that the immediate pressure might be to the upside. Historically, a test of support, especially one that has seen previous buying interest, can act as a springboard for renewed upward movement. The 1H Stochastic, while showing a slight downward trend with %K at 47.64 and %D at 52.53, is not yet in deeply oversold territory, leaving room for a potential bounce.
Furthermore, the ADX on the 1H chart stands at 25.61, indicating a strong downtrend is in place. However, within a larger downtrend, short-term bounces can occur. The bulls will be looking to capitalize on any signs of capitulation from the bears or a sudden influx of buying pressure. A close above the immediate 1-hour resistance at $59,837 would be the first sign that the bulls are regaining traction. If this level is convincingly broken, the next target would be $60,103, and then potentially higher towards the 4-hour resistance at $60,444. This scenario hinges on the market's ability to absorb selling pressure and find new buyers willing to step in at these relatively lower prices, perhaps seeing them as a discount after the recent pullback.
On-Chain Metrics: Whispers of Accumulation?
While the price action presents a mixed picture, a closer look at on-chain metrics might offer clues about underlying accumulation. Active addresses, a key indicator of network usage and user engagement, will be crucial to monitor. A sustained increase in active addresses, even with moderate price action, could signal growing interest and belief in the network's future value. Similarly, whale movements - large holders buying or selling - can provide significant directional insight. If substantial buy orders are being executed from exchanges or large wallets, it could indicate that sophisticated market participants are accumulating positions, anticipating a bounce or a reversal.
Exchange flows are another vital piece of the puzzle. A net outflow of BTC from exchanges to cold storage wallets typically suggests a long-term bullish conviction, as holders are moving their assets to secure them. Conversely, a net inflow into exchanges often precedes selling pressure. Observing these flows in real-time can provide a valuable edge in understanding whether the current price action is a temporary pause or the beginning of a more significant trend shift. The market sentiment, often gauged through social media sentiment analysis and fear & greed indices, also plays a role. If sentiment begins to shift from extreme fear towards neutrality or greed, it can fuel further buying pressure.
Correlation and Macro Context: Aiding the Rebound?
The broader macroeconomic environment and correlation with other asset classes cannot be ignored. The Dollar Index (DXY) is currently showing a mixed trend, with a strong 4H upward trend but a neutral 1H movement at 101.57. A weakening DXY typically correlates with a stronger Bitcoin price, as it reduces the attractiveness of the US dollar as a safe-haven asset and potentially increases liquidity in riskier markets. Conversely, a strengthening DXY can exert downward pressure on BTCUSD. The current mixed signals from DXY mean it's not a clear tailwind or headwind for Bitcoin at this precise moment, but any decisive move in the dollar will likely impact BTCUSD.
Equities, represented by the SP500 and Nasdaq, are also providing a complex backdrop. The SP500's 1H trend is bullish, but its 1D trend is bearish, indicating internal conflict. The Nasdaq's overall trend is also bearish across multiple timeframes. A general risk-off sentiment in equities, as suggested by the bearish Nasdaq trend, could theoretically lead investors to seek safer assets, but Bitcoin has shown a complex correlation with equities, sometimes acting as a risk-on asset itself. If the broader market sentiment turns decisively positive, it could spill over into Bitcoin, providing the necessary fuel for a bullish reversal. However, if the tech sell-off accelerates, it might drag Bitcoin down with it, especially given its recent correlation with Nasdaq's movements.
The Bearish Case: $59,459 as a Liquidity Trap?
Divergent Indicators and Weakening Momentum
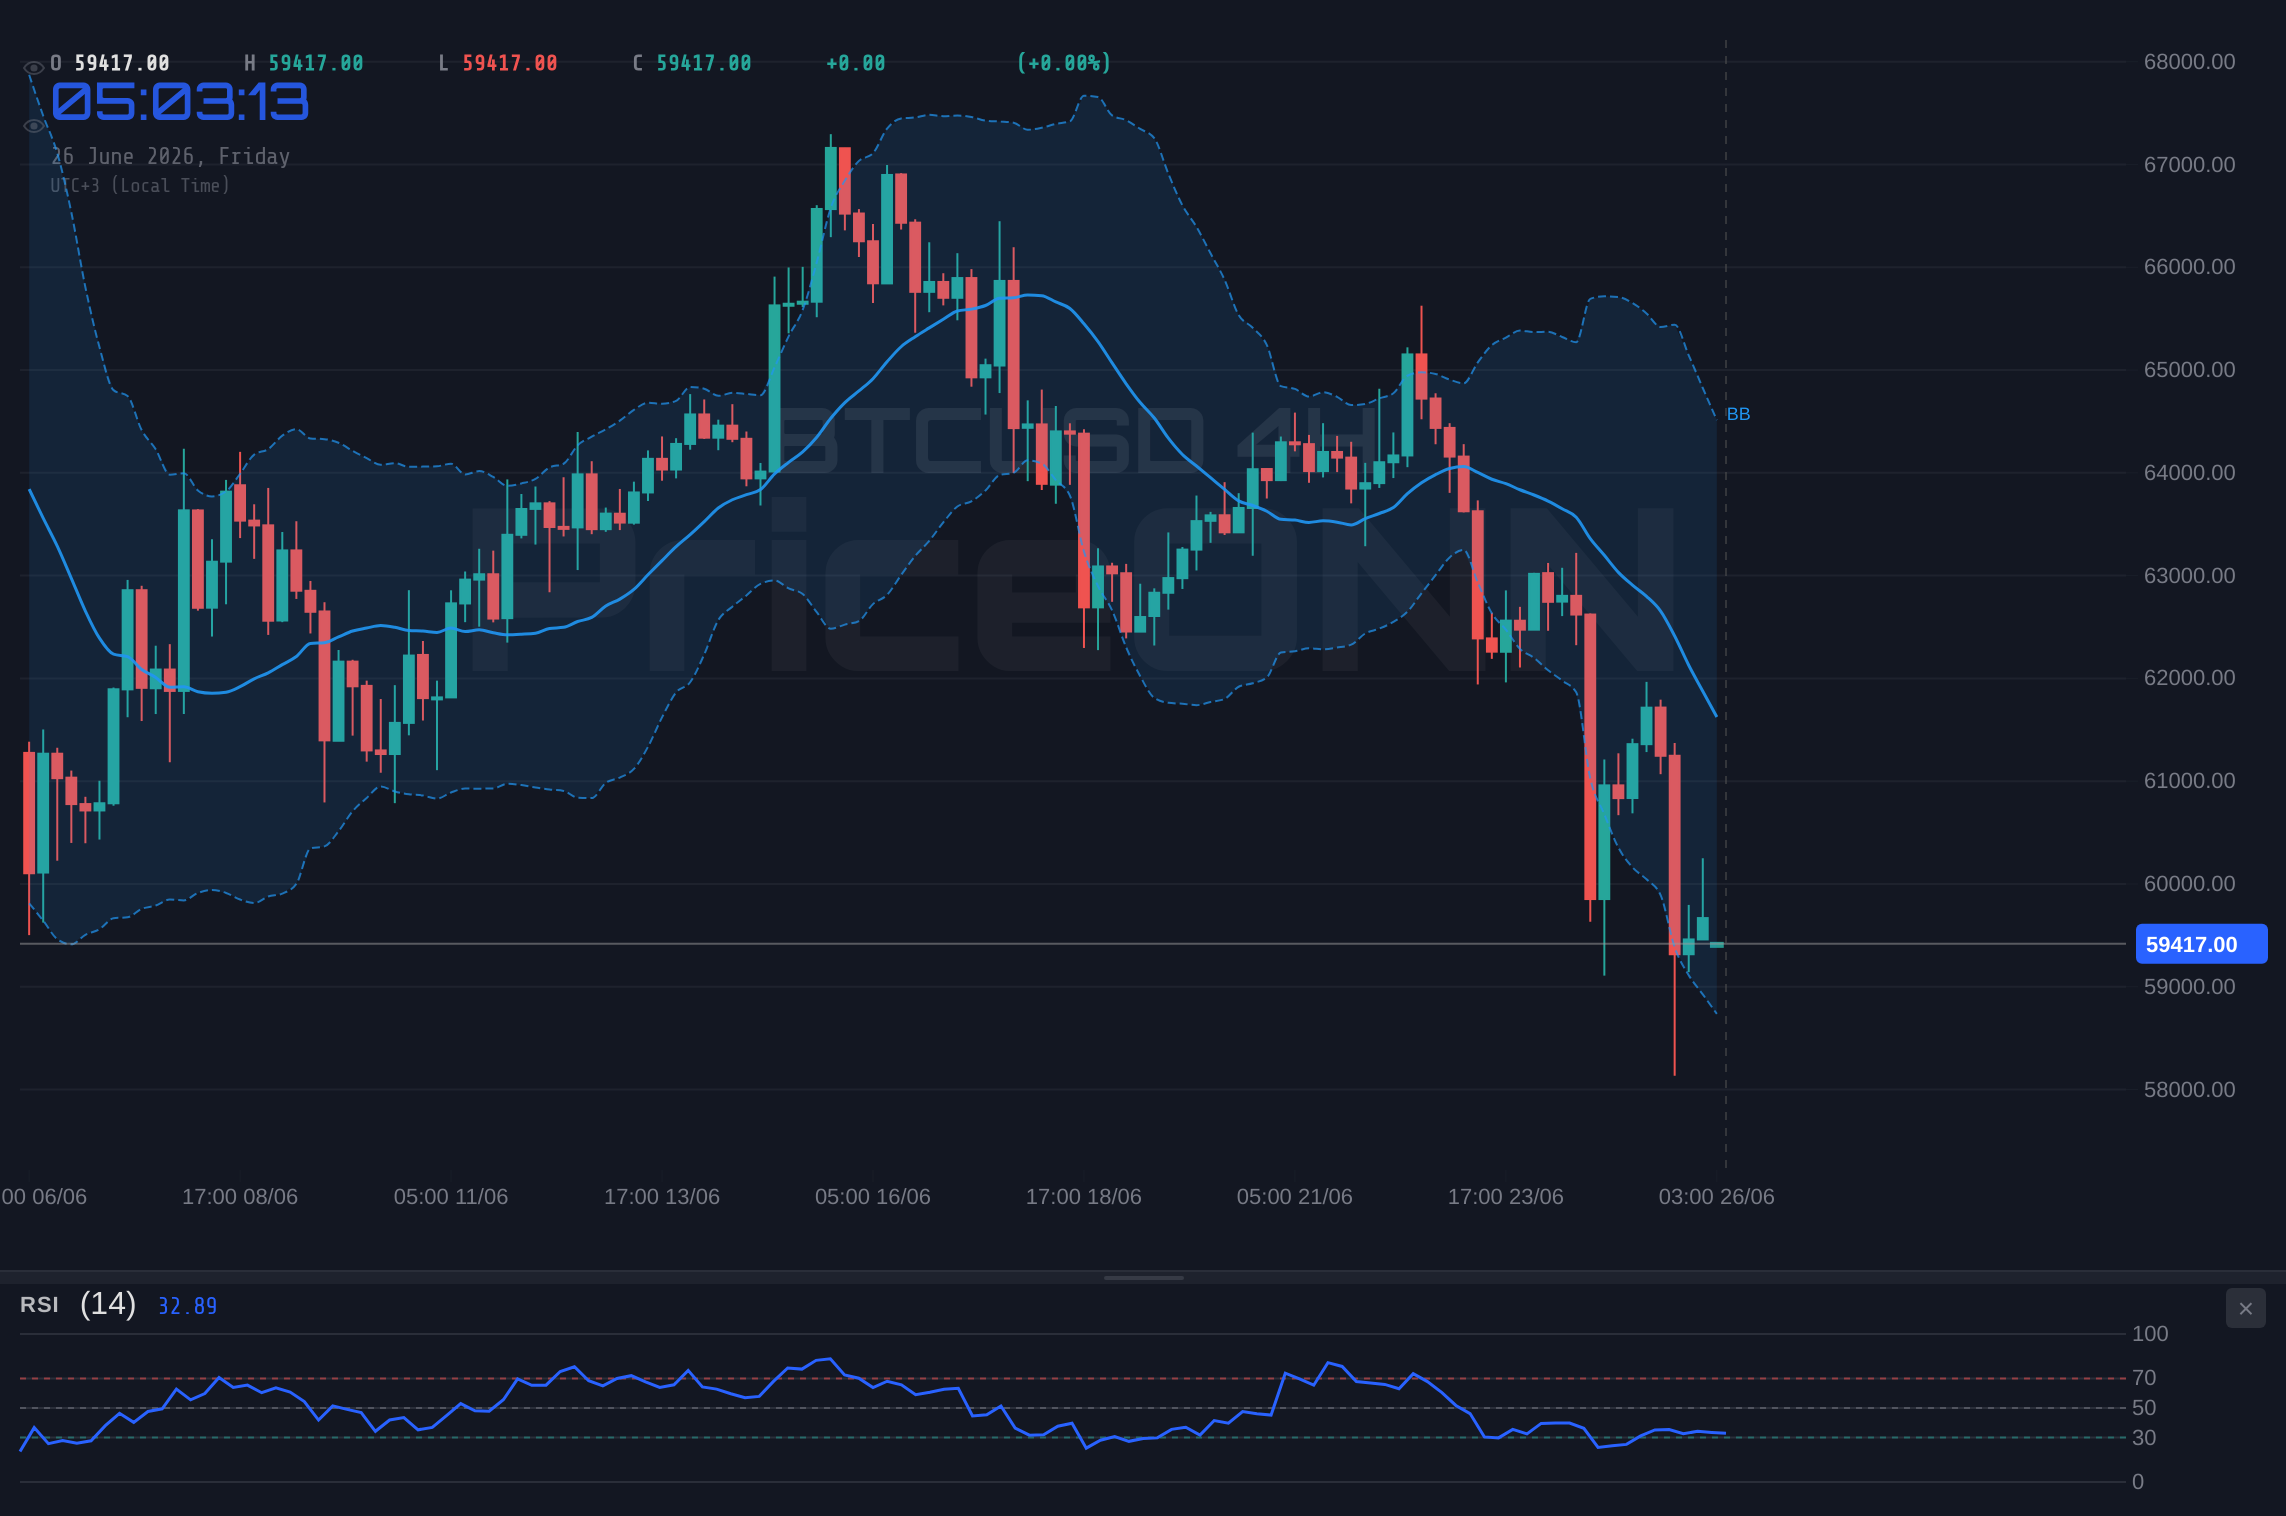
The most compelling argument for the bears stems from the stark divergence in technical indicators across different timeframes. While the 1-hour chart might offer fleeting glimmers of hope for bulls, the 4-hour and daily charts paint a decidedly bearish picture. The 4-hour RSI at 31.81 and the daily RSI at 29.56 are deep in oversold territory, but this doesn't automatically signal a buy. In a strong downtrend, RSI can remain oversold for extended periods, indicating sustained selling pressure rather than an imminent reversal. The MACD on both the 4H and 1D charts shows negative momentum, with the MACD line below its signal line, confirming the bearish bias.
The ADX indicator further solidifies the bearish outlook. On the 4H chart, ADX is at a strong 34.46, and on the daily chart, it's at 33.42, both indicating a robust downtrend. This suggests that the market is trending downwards with significant force, and any short-term price action against this trend is likely to be met with strong resistance. The Stochastic oscillator on the 4H and 1D charts also shows a bearish signal, with %K below %D and not yet in deeply oversold territory on the daily, leaving room for further downside. The Bollinger Bands on the 4H and 1D charts are below the middle band, indicating that the price is trading in the lower half of its recent range, a classic sign of bearish pressure.
Key Levels to Watch: The $59k Barrier
The immediate focus is on the $59,459 level. If this support fails to hold, the next significant floor is the 4-hour support at $58,812. A break below this level would signal a more aggressive push from the bears, potentially targeting the daily support at $56,983. The daily chart shows considerable room for downside, with significant support levels only appearing much lower. The current price action is essentially a battleground, and a decisive break below $59,459 could trigger a cascade of stop-loss orders, accelerating the downward move. The bears will be looking to defend any rallies towards the 1-hour resistance at $59,837 and $60,103, aiming to keep the price contained within the current downtrend.
The failure of the price to convincingly break above the 1-hour resistance levels during previous attempts also emboldens the bears. They will argue that the current price action is merely a dead cat bounce within a larger bearish structure. The lack of strong buying volume accompanying any upward movements, if observed, would further support this thesis. The bears' strategy would be to wait for the inevitable break of the $59,459 support, then enter short positions with targets set significantly lower.
On-Chain Red Flags: Exchange Inflows and Deteriorating Metrics
From an on-chain perspective, several red flags could be supporting the bearish argument. An increase in BTC inflows to exchanges, particularly from whale wallets, would be a significant concern. This suggests that large holders are moving their Bitcoin to exchanges, potentially to sell and reduce their exposure. A sustained net inflow trend could confirm that selling pressure is building. Furthermore, a decline in active addresses or transaction volumes, despite attempts at price recovery, would indicate waning network interest and a potential loss of fundamental support for Bitcoin's value.
Whale accumulation patterns have been mixed, but if data shows a consistent trend of whales offloading their holdings rather than accumulating, it would be a strong bearish signal. The derivatives market could also offer clues. A significant increase in open interest on short positions, coupled with a rise in funding rates for short positions, would indicate growing bearish sentiment among derivatives traders. Elevated futures premiums, if they start to contract or turn negative, could also signal a shift in market sentiment from bullish to bearish expectations.
Macroeconomic Headwinds: Rate Hikes and Risk Aversion
The macroeconomic environment presents potential headwinds for Bitcoin. The DXY's upward trend on the 4H chart at 101.57, although currently mixed on the 1H, suggests that the US dollar could strengthen further. A stronger dollar generally correlates with lower Bitcoin prices, as it makes dollar-denominated assets less attractive and can signal a flight to safety. If upcoming economic data, such as inflation reports or employment figures, suggest a more hawkish stance from the Federal Reserve, it could lead to renewed dollar strength and put further pressure on Bitcoin.
The bearish trend in the Nasdaq index (currently at 29205.05 on 1D) also raises concerns. A significant downturn in the tech sector, which has often shown a correlation with Bitcoin's price movements, could drag BTCUSD lower. If risk appetite continues to dwindle globally, investors might reduce their exposure to speculative assets like Bitcoin, favoring more traditional safe-haven assets. Geopolitical tensions, though not explicitly detailed in the provided data, can also contribute to a risk-off environment, further pressuring assets like Bitcoin.
The Verdict: A Tightrope Walk Above $59,459
Weighing the Evidence: Bulls vs. Bears
The technical picture for BTCUSD is currently divided, creating a tense standoff around the $59,459 support level. The 1-hour chart offers some solace to the bulls with positive MACD momentum and the price holding above this critical support. However, the overwhelming bearish signals from the 4-hour and daily charts - particularly the strong ADX, oversold RSI readings that persist, and negative MACD momentum - cannot be ignored. These longer-term indicators suggest that the prevailing trend is still down, and any rallies might be short-lived opportunities for bears to enter the market.
The divergence between short-term bullish signals and long-term bearish trends creates a volatile trading environment. The key question is whether the short-term strength can overcome the established bearish momentum. The RSI readings are particularly noteworthy; while oversold RSI can precede bounces, sustained bearish trends often see RSI linger in these zones. The bulls need to see a decisive break above immediate resistance levels, coupled with increasing volume and positive on-chain metrics, to invalidate the bearish thesis. Conversely, a failure to hold $59,459 and a subsequent break below $58,812 would strongly favor the bears, opening the door for a significant price decline.
What Traders Should Watch Next
The immediate future of BTCUSD hinges on the price action around $59,459. A sustained hold above this level, followed by a confirmed break above the 1-hour resistance at $59,837, could signal a short-term bullish reversal. Traders will be looking for confirmation through increasing volume and positive shifts in longer-term indicators like the 4H MACD. Conversely, a decisive close below $59,459, especially on the 4-hour chart, would be a strong bearish signal, likely leading to a test of lower support levels. The market will also be sensitive to macroeconomic news, particularly any shifts in Fed policy expectations or significant movements in the DXY and equity markets. Observing exchange flows and whale activity will be crucial for gauging the sentiment of larger market participants.
Frequently Asked Questions: BTCUSD Analysis
What happens if BTCUSD breaks below the $59,459 support level?
A breakdown below $59,459 on the 4H chart would likely trigger further selling pressure, potentially targeting the next support at $58,812. Bears would likely aim for the $56,983 level as the trend strength indicated by ADX is high.
Is the current RSI at 40.91 a buy signal for BTCUSD?
While the RSI is moving towards oversold territory on lower timeframes, it does not automatically constitute a buy signal. On longer timeframes like 4H and 1D, RSI is at 31.81 and 29.56 respectively, indicating sustained bearish momentum rather than an immediate reversal.
What does the MACD signal suggest for BTCUSD at $59,459?
The MACD shows mixed signals: positive momentum on the 1H chart suggests short-term potential, but negative momentum on the 4H and 1D charts points to the prevailing bearish trend. Confirmation of a clear trend shift would require a sustained MACD crossover on higher timeframes.
How will the current DXY strength affect BTCUSD near $59,459?
The DXY's 4H uptrend at 101.57 suggests potential dollar strength, which typically acts as a headwind for BTCUSD. If the dollar continues to strengthen, it could put additional downward pressure on Bitcoin, making the $59,459 support level even more critical to hold.
Track markets in real-time
AI-powered analysis, technical indicators and real-time price data.
Join Our Telegram Channel
Breaking market news, AI analysis and trading signals instantly.
Join Channel