Bitcoin's sharp descent to $60,366 signals a critical juncture for the cryptocurrency market. After a significant fall of 3.37% from its recent highs, the digital asset is now teetering on crucial support levels, prompting a closer look at what's driving this move and what traders should anticipate next. This analysis delves into the current technical landscape, correlating indicators, and potential scenarios shaping BTCUSD's immediate future, all while keeping a close eye on the broader macroeconomic narrative.
- BTCUSD RSI at 22.67 signals oversold conditions, but negative MACD momentum suggests caution.
- Critical support sits at $60,307.67, tested multiple times in the short term.
- A daily close below $60,307.67 could trigger further downside, targeting $58,907.
- Broader market risk-off sentiment, reflected in DXY's strength and equity pullbacks, is impacting BTCUSD correlation.
The cryptocurrency market, led by Bitcoin, has experienced a significant downturn, with BTCUSD shedding 3.37% to trade at $60,366. This sharp decline, occurring over a short period, has pushed the asset into oversold territory on several short-term timeframes, yet the underlying momentum indicators suggest that the selling pressure is far from over. The current price action is occurring against a backdrop of strengthening US Dollar and a palpable risk-off sentiment pervading global financial markets, making it imperative for traders to dissect the technicals and fundamentals with precision.
Looking at the 1-hour chart, the trend is unequivocally bearish, with a strength of 98%. The immediate support level is identified at $60,861.67, followed by $60,606.33 and $60,307.67. These are the lines in the sand that bulls must defend to prevent further capitulation. On the resistance side, the $61,415.67 level stands as the first hurdle, with $61,714.33 and $61,969.67 representing more significant price ceilings that would need to be breached to signal a potential reversal. The RSI(14) at 22.67 clearly indicates oversold conditions, suggesting that the selling momentum might be exhausting. However, the MACD remains in negative territory, with its histogram below the signal line, painting a picture of persistent downward pressure.
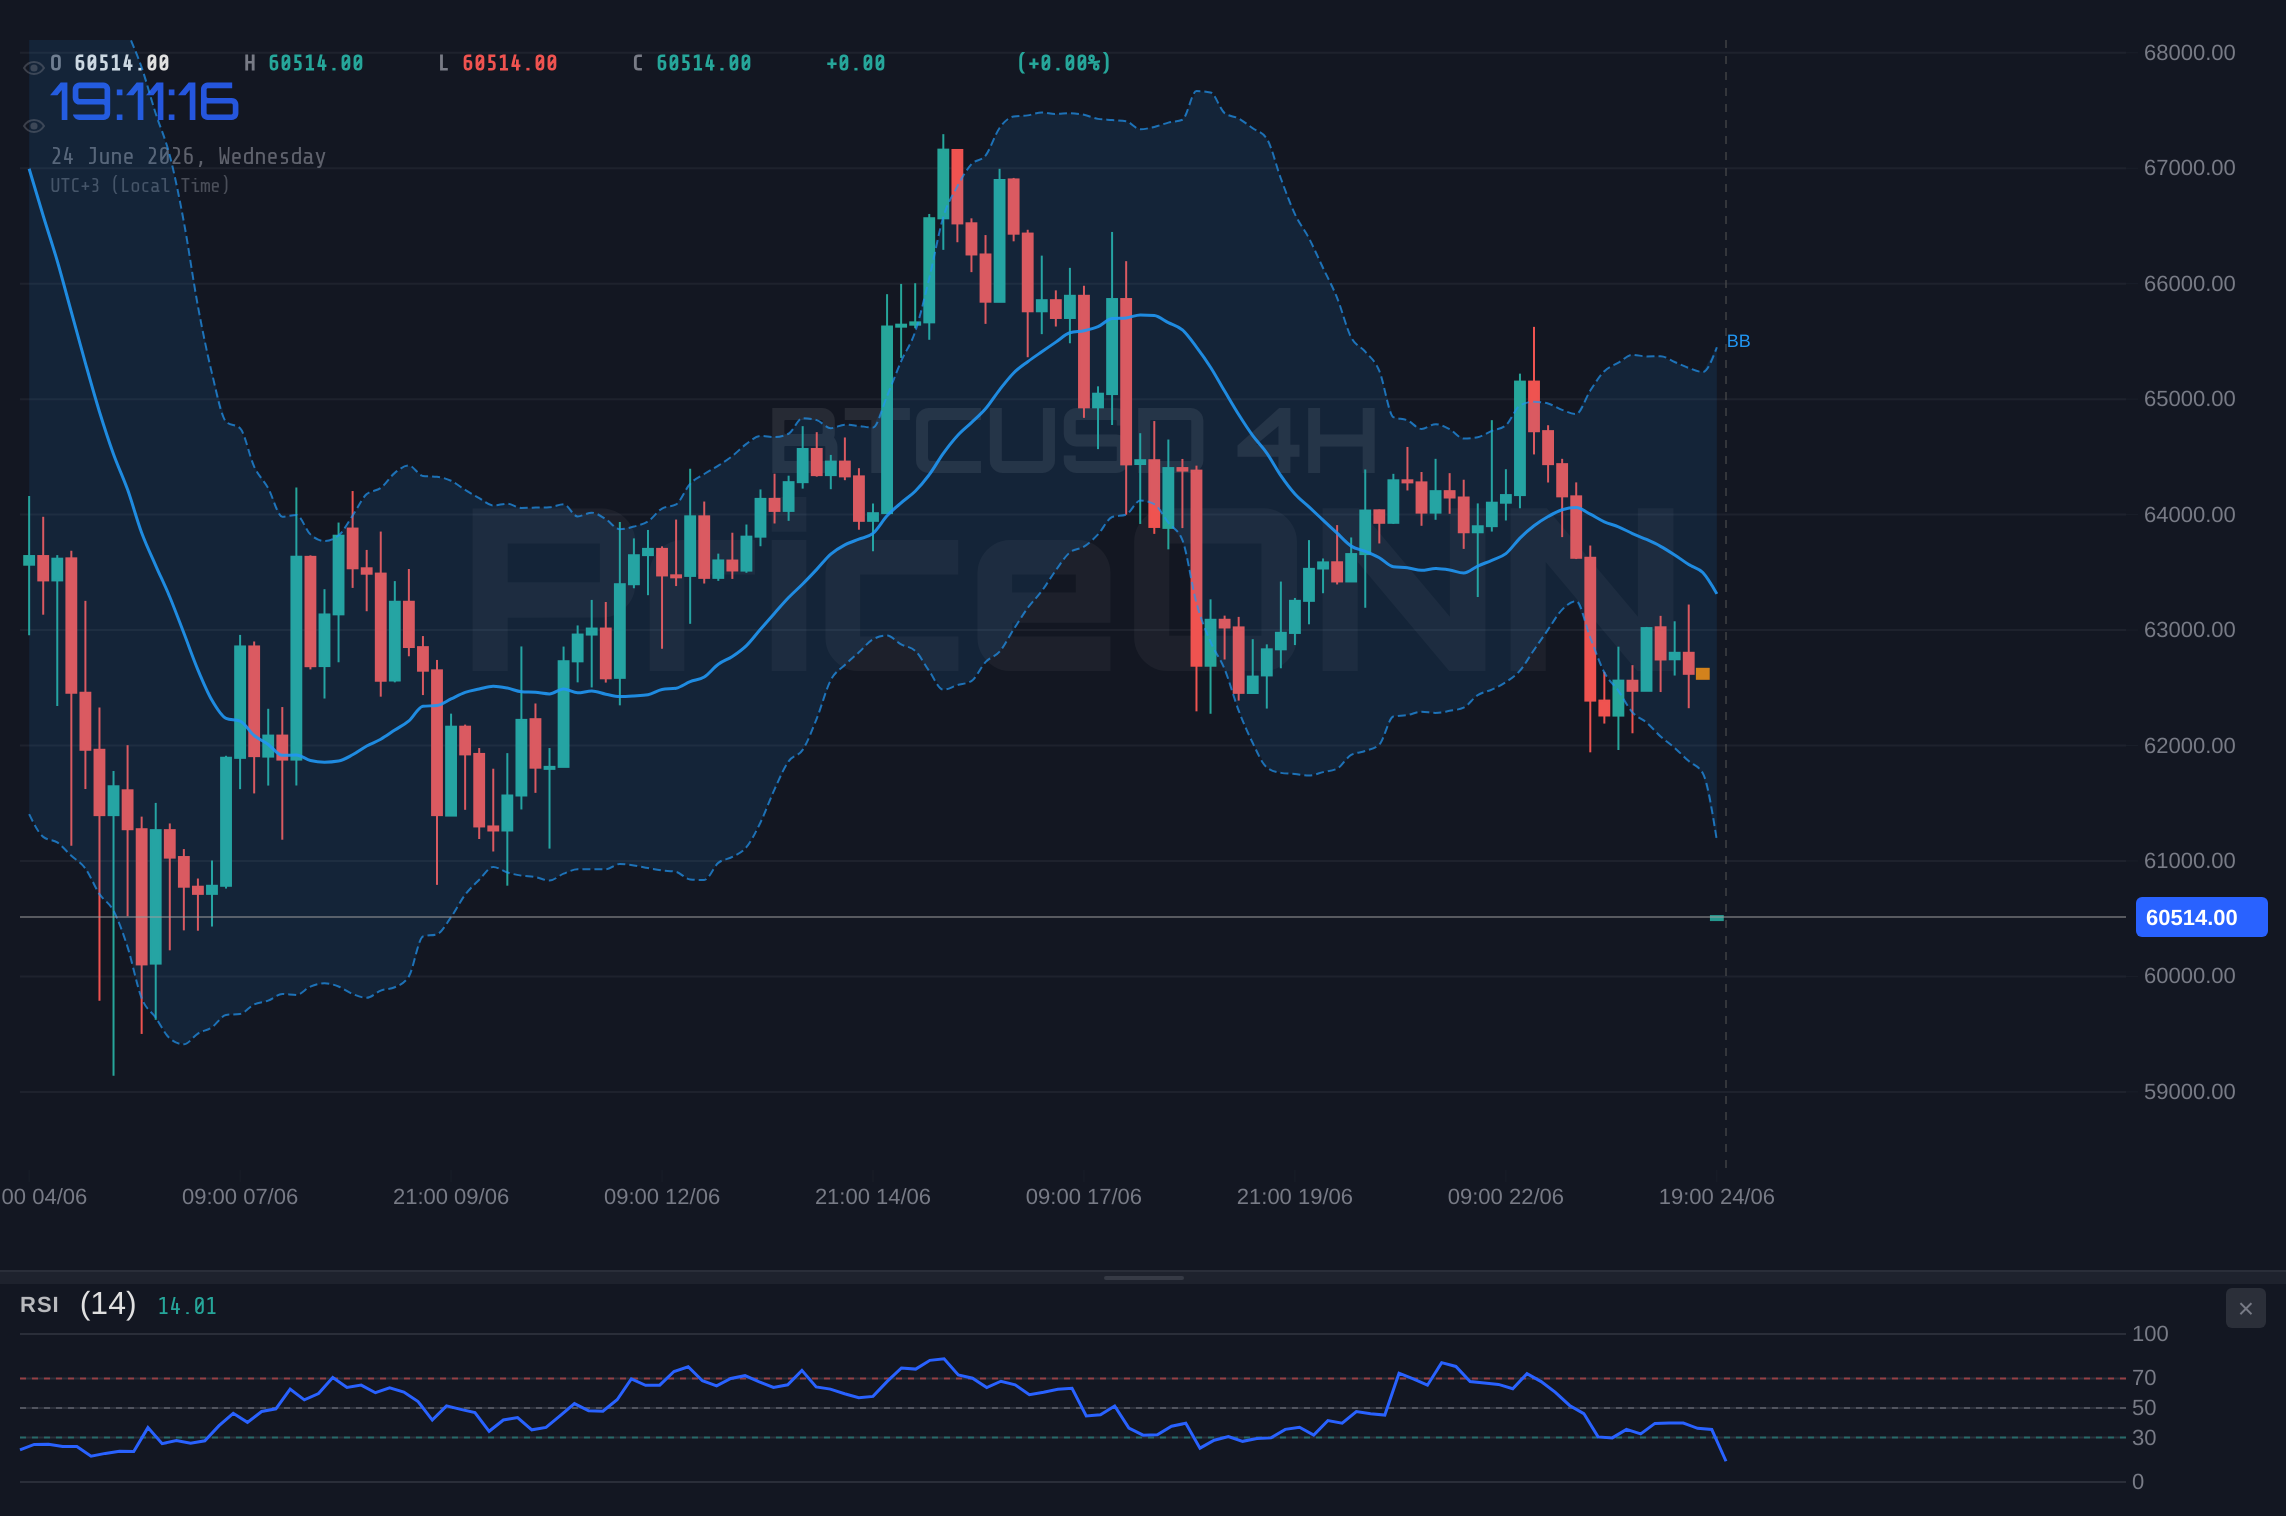
The Stochastic Oscillator, showing K=5.75 and D=25.91, also reinforces the oversold narrative, but the fact that %K is below %D still points to a bearish bias in the very short term. More concerning is the ADX at 25.59, which, despite the oversold indicators, still denotes a strong downtrend. This confluence of conflicting signals - oversold oscillators versus persistent negative MACD and strong ADX - creates a precarious situation. It highlights that while a short-term bounce is possible, the prevailing trend remains firmly downwards, and any recovery attempt could be met with immediate profit-taking.
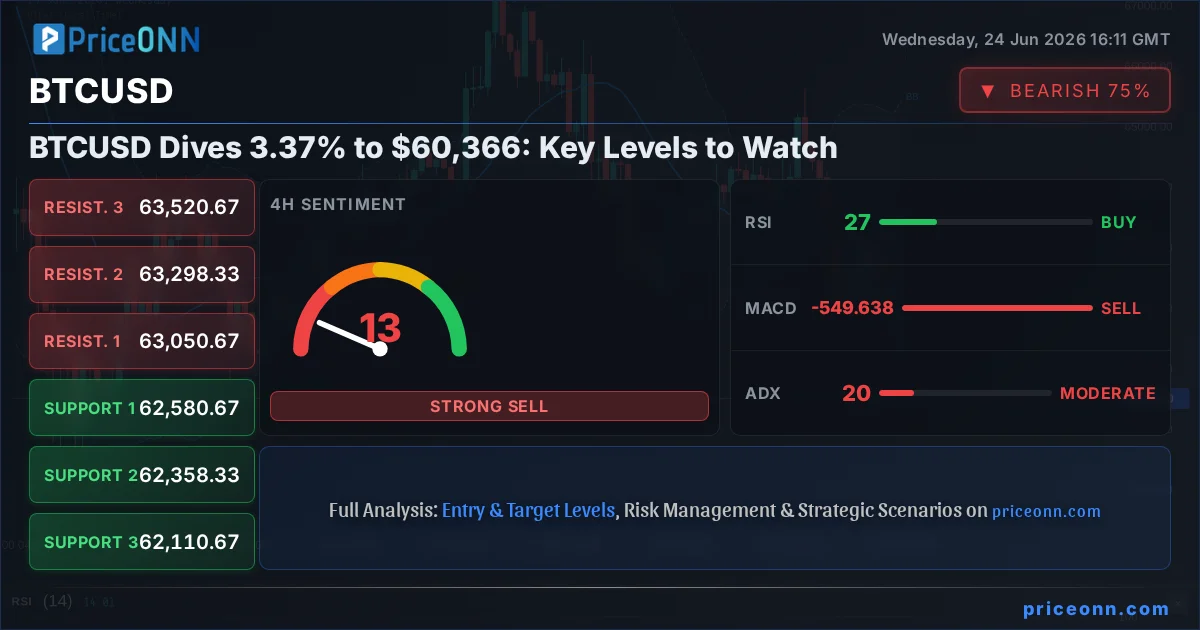
Moving to the 4-hour timeframe, the trend weakens slightly but remains predominantly bearish with 85% strength. Support levels are now eyed at $62,580.67, $62,358.33, and $62,110.67. Resistance is observed at $63,050.67, $63,298.33, and $63,520.67. The RSI(14) at 26.8 still sits in oversold territory, offering a potential glimmer of hope for buyers, but the MACD continues to print negative momentum. The Stochastic Oscillator shows K=20.76 and D=20.22, with %K slightly above %D, hinting at a potential bullish crossover, albeit from extremely low levels. The ADX at 20.42 indicates a moderate downtrend, less aggressive than the 1-hour chart but still significant enough to caution against aggressive long positions.
The general signal across both short-term timeframes (1H and 4H) leans heavily towards selling, with multiple indicators flashing 'SELL'. This suggests that the market participants are actively looking to offload Bitcoin at current levels, likely driven by broader risk aversion and a strengthening US Dollar, as indicated by the DXY's rise to 101.65. The correlation between Bitcoin and risk assets, particularly tech stocks like the Nasdaq, has been a significant factor. With the Nasdaq showing a mixed picture across different timeframes - bullish on 1H and 4H, but bearish on the daily - and the S&P 500 exhibiting weakness on its daily chart, it's clear that the risk appetite narrative is currently subdued. This environment typically favors safe-haven assets and the US Dollar, putting pressure on riskier assets like Bitcoin.
On the daily chart, BTCUSD's trend is also firmly in the bearish camp with 91% strength. The significant support levels to monitor are $61,449, $60,424, and a more substantial floor at $58,907. Resistance is seen at $63,991, $65,508, and $66,533. The RSI(14) at 31.49 is approaching oversold territory, but still holds a bearish inclination. The MACD is showing positive momentum with its histogram above the signal line, which is a stark contrast to the shorter timeframes and could indicate a divergence - a potential sign of weakening bearish momentum on the daily scale. However, the Stochastic Oscillator's K=18.23 and D=31.91 still signal a bearish trend, with %K well below %D. The ADX at 32.64 confirms a strong downtrend, reinforcing the daily bearish outlook.
This divergence between the daily MACD and shorter-term indicators is a crucial point for analysis. While the daily chart might hint at a potential bottoming process or at least a pause in the decline, the immediate price action and shorter-term indicators are screaming 'sell'. This suggests that any upward movement from current levels might be a short-lived bounce, likely to be met with significant selling pressure as traders exit positions before the crucial $58,907 support level is tested. The market sentiment is clearly shifting, and the recent price action reflects a broader deleveraging across risk assets.
The strength of the US Dollar Index (DXY) at 101.65, trading with a very strong uptrend on all timeframes, is a significant headwind for Bitcoin. As the DXY strengthens, it typically exerts downward pressure on assets priced in dollars, including BTCUSD. The fact that the DXY is in overbought territory on its 4-hour and daily charts at 79.77 and 76.55 respectively, suggests that while the dollar rally might be nearing exhaustion, it could still maintain its strength in the short to medium term, capping any significant upside for Bitcoin.
In terms of on-chain metrics, while not explicitly provided in the data, a sharp price drop like this often correlates with increased selling pressure on exchanges, a potential rise in active addresses as panic selling occurs, and possibly whale movements accumulating at lower levels or distributing at current prices. Without specific on-chain data, we must infer that the current price action is driven by technical factors and broader market sentiment. However, if this downtrend continues, it would be crucial to monitor exchange flows and whale activity for signs of capitulation or accumulation, which could signal a potential turning point.
The prevailing technical signals across multiple timeframes paint a predominantly bearish picture for BTCUSD in the short to medium term. The asset is trading below key moving averages, exhibiting negative momentum on MACD, and facing strong headwinds from a strengthening dollar and risk-off sentiment. While oversold conditions are present on shorter timeframes, the strength of the downtrend, as indicated by ADX, suggests that these conditions could persist or even worsen before any meaningful recovery takes hold. The critical support at $60,307.67 is the immediate level to watch; a decisive break below this could open the floodgates to further significant declines.
For traders, this environment calls for extreme caution. Aggressively long positions are not advisable given the current technical setup and macroeconomic backdrop. Instead, the focus should be on risk management and identifying potential shorting opportunities on any bounces towards resistance levels, or waiting for a clear confirmation of a bottoming process and a bullish reversal signal. The $58,907 level on the daily chart represents a more significant psychological and technical support, and a move towards this zone could present a higher-risk, higher-reward scenario for those looking to accumulate positions, but only after clear bullish confirmation emerges.
The current market structure, characterized by strong downtrends on shorter timeframes and a generally bearish sentiment, suggests that further downside is probable before any sustainable recovery. The confluence of technical indicators pointing towards selling pressure, coupled with a strengthening dollar and weakening equity markets, creates a challenging environment for Bitcoin. Patience will be paramount for investors and traders alike, waiting for clearer signals of trend exhaustion or a decisive break of key resistance levels before committing to significant positions. The $60,307.67 support level is the immediate line to monitor, and its failure could usher in a more severe phase of the current downturn.
Bearish Scenario: The Downward Spiral Continues
70% ProbabilityNeutral Scenario: Consolidation and Choppy Recovery
20% ProbabilityBullish Scenario: Unexpected Reversal
10% ProbabilityFrequently Asked Questions: BTCUSD Analysis
What happens if BTCUSD breaks below the $60,307.67 support level?
A break below $60,307.67 on the 1-hour chart would likely trigger further downside, invalidating the short-term consolidation pattern. This could accelerate the move towards the next significant daily support at $58,907, as selling pressure intensifies and stops are likely triggered.
Should I buy BTCUSD at current levels of $60,366 given the RSI is at 22.67?
While the RSI at 22.67 indicates oversold conditions on the 1-hour chart, the persistent negative MACD momentum and strong ADX at 25.59 suggest caution. A buy decision would be premature without confirmation of a bullish reversal, such as a close above immediate resistance or a sustained upward move on the daily MACD.
Is the MACD negative momentum at 1H a sell signal for BTCUSD right now?
Yes, the negative MACD momentum on the 1-hour chart, coupled with the histogram below the signal line, strongly suggests ongoing selling pressure. This technical reading reinforces the bearish sentiment and indicates that short-term bounces are likely to be met with resistance.
How will the strong DXY at 101.65 affect BTCUSD this week?
The strengthening DXY, currently at 101.65 and showing a strong uptrend, typically correlates with risk-off sentiment, putting downward pressure on assets like BTCUSD. Expect this trend to continue capping any significant upside potential for Bitcoin until the dollar index shows signs of reversal or consolidation.
| Indicator | Value | Signal | Interpretation |
|---|---|---|---|
| RSI (14) | 22.67 | Bearish | Oversold, but momentum still weak |
| MACD Histogram | -2108 | Bearish | Negative momentum persists |
| Stochastic | K=5.75, D=25.91 | Bearish | Oversold, %K |
| ADX | 25.59 | Bearish | Strong downtrend confirmed |
| Bollinger | Lower Band | Watch | Price below lower band |
Track markets in real-time
AI-powered analysis, technical indicators and real-time price data.
Join Our Telegram Channel
Breaking market news, AI analysis and trading signals instantly.
Join Channel