Silver, or XAGUSD, is currently commanding attention as it trades at a critical juncture, holding firm at $62.61. This price point is not just a number; it represents a confluence of recent bullish momentum and evolving market dynamics that traders are closely watching. The precious metal has seen a significant surge, climbing 2.64% on the day, adding $1.67 to its value and reaching as high as $62.86 within the current trading range of $60.88 to $62.86. This upward trajectory is supported by a robust technical picture across multiple timeframes, suggesting that the bulls are not only in control but are potentially setting the stage for further gains. However, as with any market movement, especially in volatile commodities like silver, understanding the underlying drivers and potential roadblocks is paramount for navigating these choppy waters.
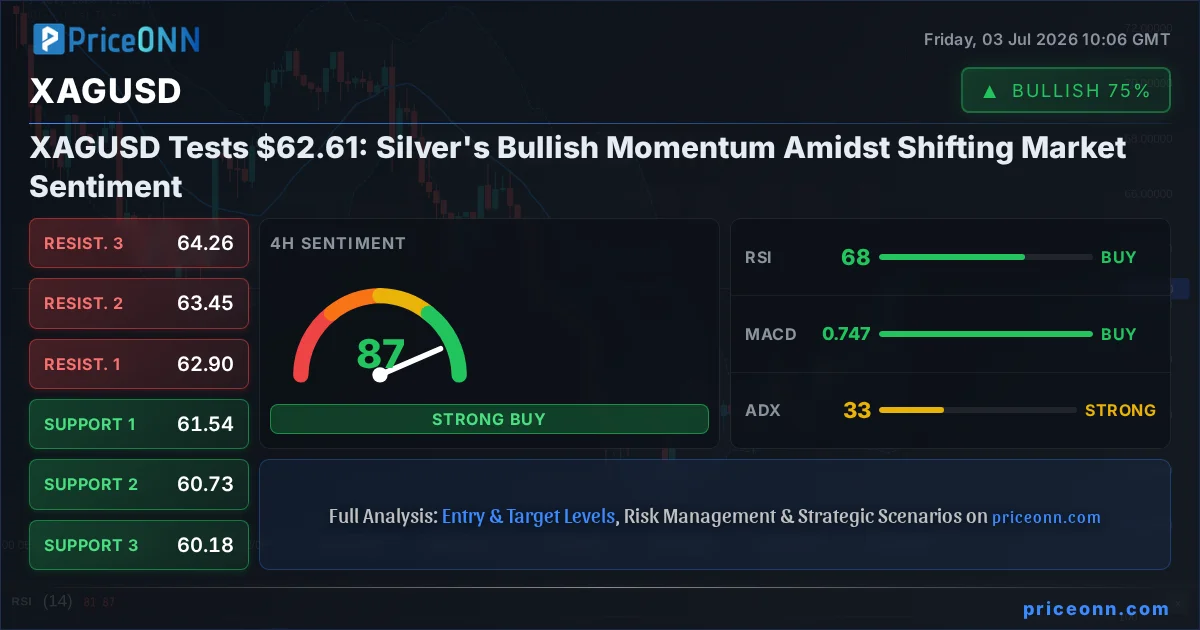
- XAGUSD is trading at $62.61, with a strong upward trend indicated by ADX at 33.49 and RSI at 69.97 on the 4H chart.
- Key resistance is forming around $62.84, while immediate support rests at $62.52, tested in the 1H timeframe.
- The current bullish sentiment is supported by positive MACD momentum on the 4H chart, though Stochastic is nearing overbought territory.
- Correlation analysis shows a potential inverse relationship with a weakening DXY at 100.81, which could further bolster silver prices.
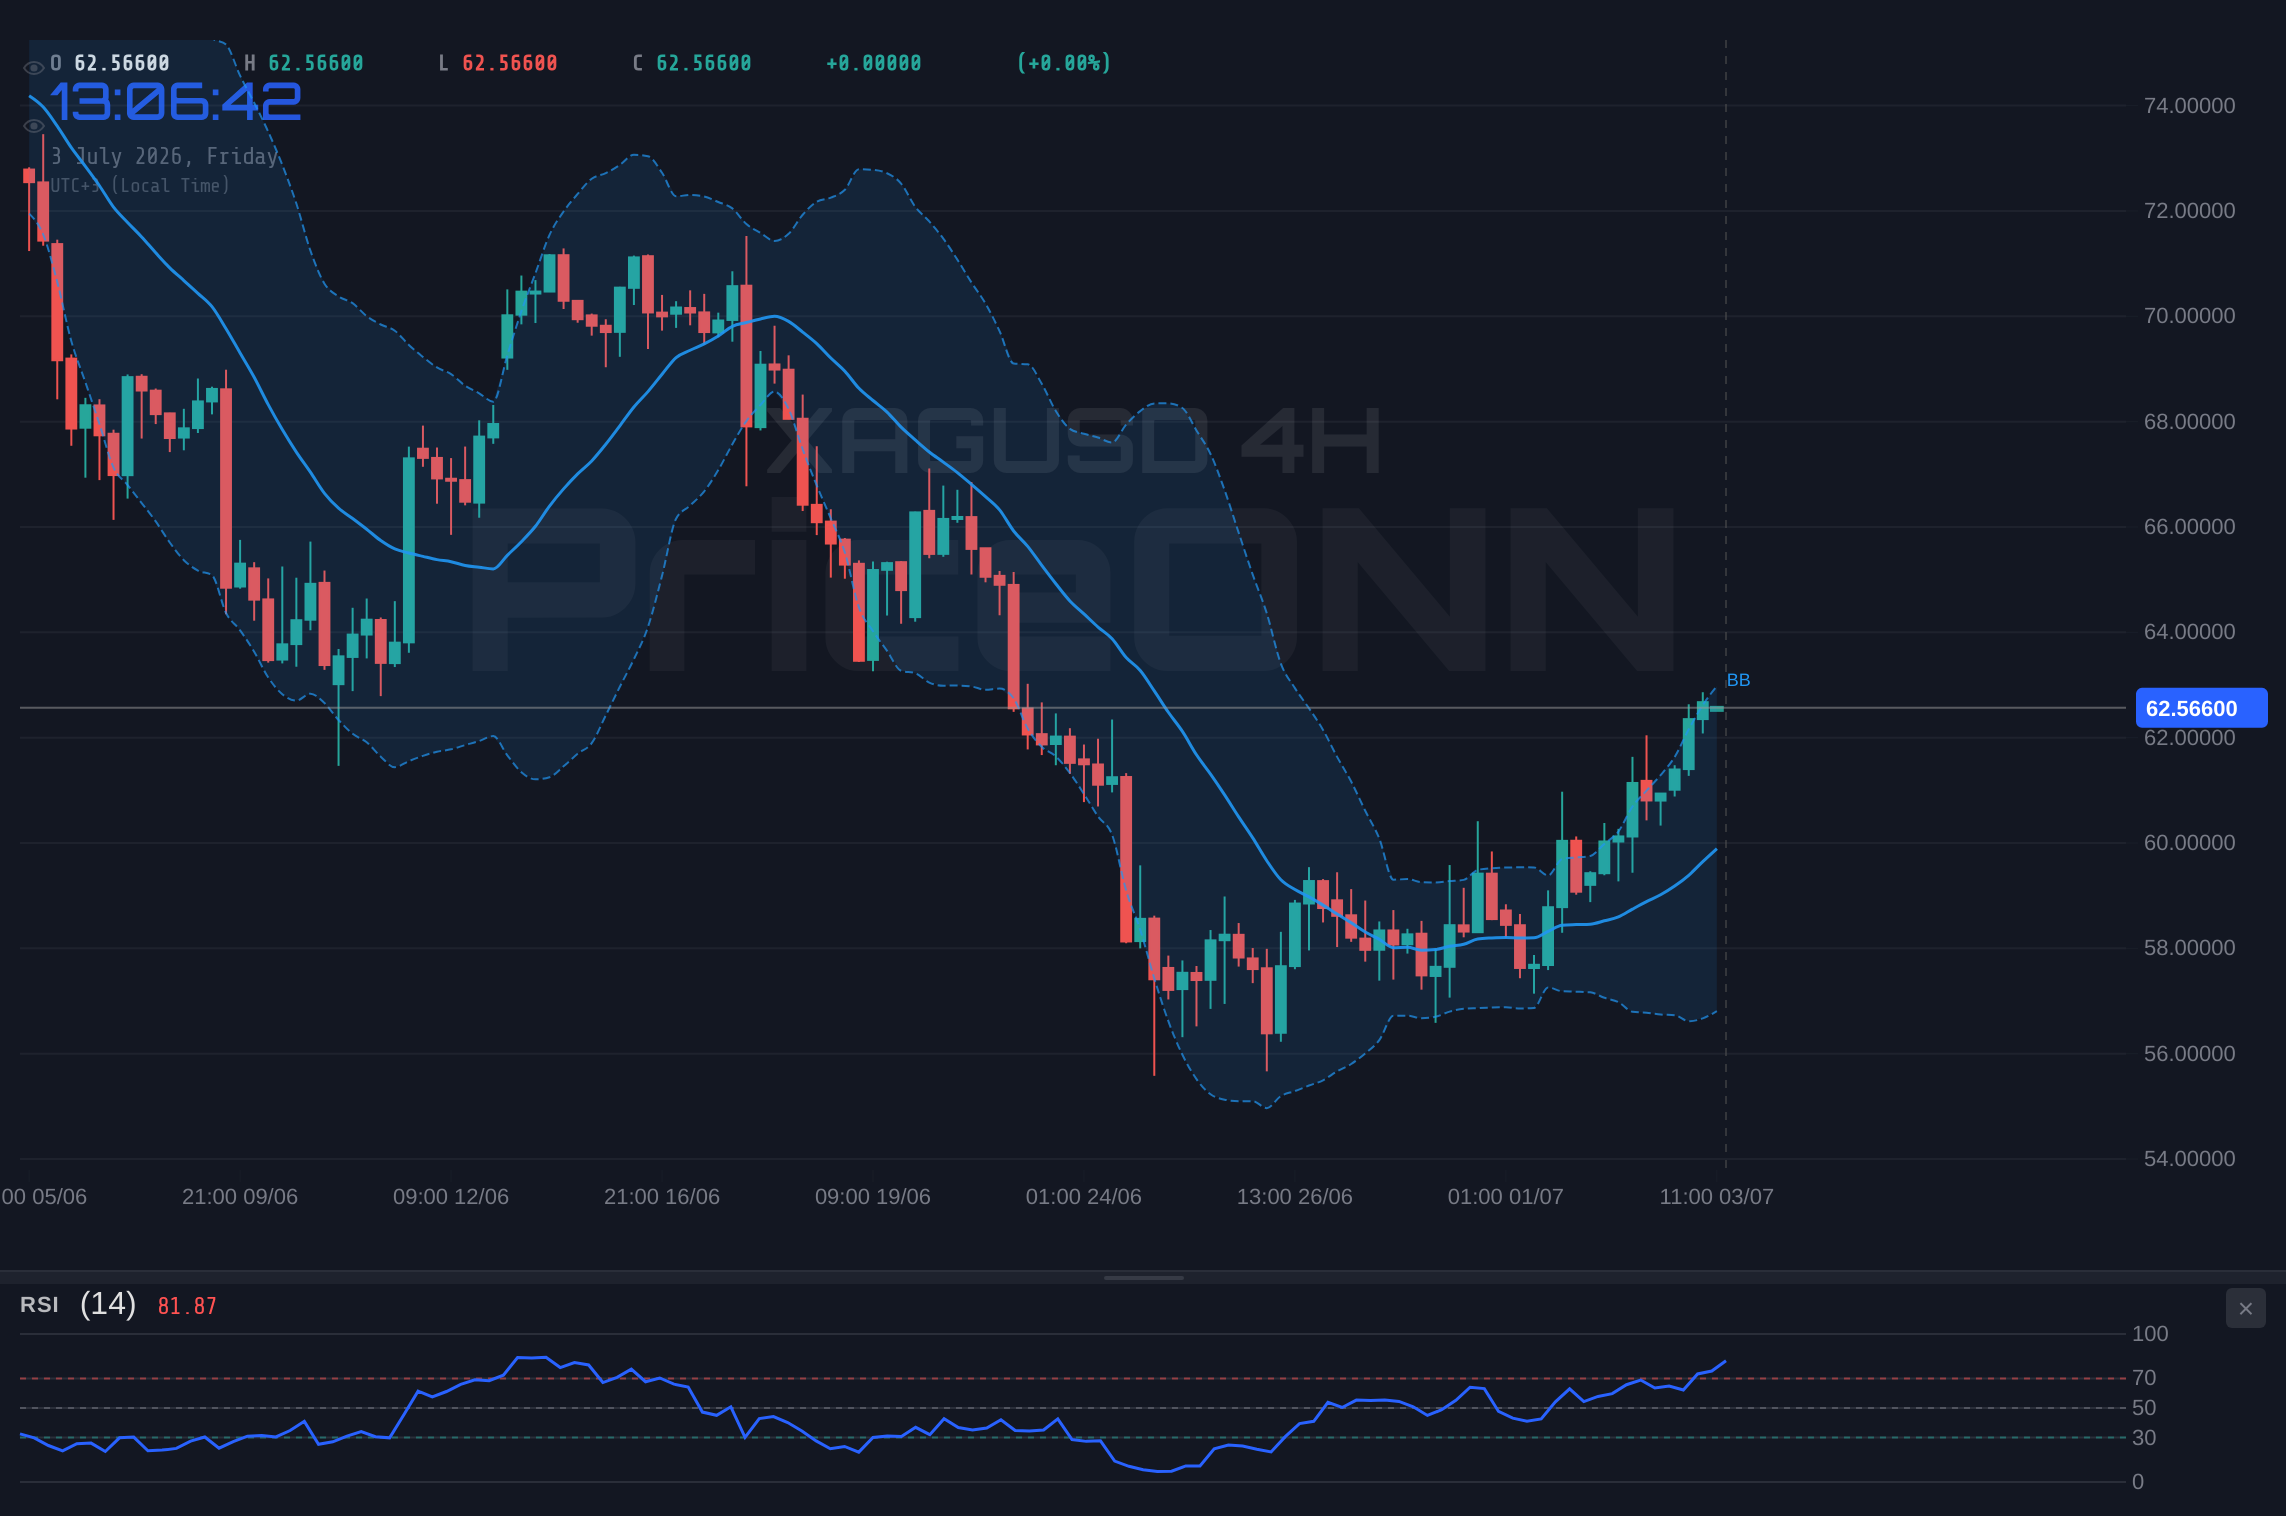
The 4-hour chart paints a compelling picture of strength for XAGUSD, with a trend power of 97% indicating a firmly established upward move. The Relative Strength Index (RSI) hovers at 67.88, firmly in bullish territory, suggesting ample room for further appreciation before hitting overbought conditions. Similarly, the Moving Average Convergence Divergence (MACD) displays positive momentum, with the MACD line positioned above its signal line, reinforcing the bullish sentiment. The Bollinger Bands also show the price trading above the middle band, a classic sign of an strengthening uptrend. However, the Stochastic Oscillator is flashing a warning, sitting deep within the overbought zone (K=89.59, D=85.19). This divergence between other bullish indicators and an overextended Stochastic could signal an impending pullback or consolidation, even as the overall trend remains strongly bullish.
On the hourly timeframe, the technical indicators present a slightly more nuanced view, though still leaning bullish. The trend is identified as bullish with a power of 93%, and the RSI at 69.97 continues to show upward momentum, albeit slightly less aggressive than on the 4-hour chart. The MACD is positive, and the Bollinger Bands are showing an upward inclination. However, the Stochastic Oscillator on this timeframe (K=88.46, D=87.19) is also deep in overbought territory, and critically, the %K line is just beginning to dip below the %D line. This is a classic bearish divergence signal on the hourly chart, suggesting that the short-term momentum might be peaking. Immediate support levels are seen at $62.52, $62.37, and $62.20, while resistance looms at $62.84, $63.01, and $63.17. A break above the immediate resistance could signal a continuation of the upward trend, while a dip below the hourly support could indicate a short-term correction.
Navigating the Daily Chart's Mixed Signals
Shifting to the daily timeframe, the outlook for XAGUSD becomes less clear-cut, revealing a neutral trend with a power of 50%. This suggests a period of consolidation or indecision after recent strong moves. The RSI sits at 43.45, indicating a bearish lean within the neutral trend, and momentum appears to be slowing. The MACD, while showing positive momentum on shorter timeframes, is still positioned above its signal line, but the histogram has been narrowing. The Bollinger Bands, on the daily chart, are currently positioned below the middle band, indicating a bearish bias for the longer term, contradicting the shorter-term bullish signals. The Stochastic Oscillator, however, presents a bullish signal here, with the %K line (50.04) significantly above the %D line (26.11), suggesting potential for an upward move. This confluence of conflicting signals on the daily chart - bullish Stochastic, bearish RSI, and neutral/bearish Bollinger Bands - underscores the current indecision at this longer timeframe and highlights the importance of shorter-term trends and price action for immediate trading decisions. The ADX on the daily chart stands at 39.05, indicating a strong trend, but its directionality is masked by the conflicting oscillator signals.
Correlation with the US Dollar Index (DXY)
The relationship between silver (XAGUSD) and the US Dollar Index (DXY) is a crucial piece of the puzzle, often exhibiting an inverse correlation. When the DXY strengthens, it typically puts pressure on dollar-denominated commodities like silver, as they become more expensive for holders of other currencies. Conversely, a weakening dollar often lends support to silver prices. Currently, the DXY is trading at 100.81, showing a slight daily decline of 0.04%. This subtle weakness in the dollar index, coupled with the strong bullish momentum seen in XAGUSD, suggests that the inverse correlation is playing out. The hourly DXY trend is identified as bearish with a power of 88%, supported by an RSI of 44.59. While the 4-hour DXY trend is also bearish (88% power), the daily DXY exhibits a neutral trend (50% power) with a bullish RSI of 57.33. This mixed picture from the DXY adds a layer of complexity; however, the prevailing short-to-medium term bearish trend in the dollar index provides a favorable backdrop for silver's current ascent. Should the DXY continue its downward path, particularly breaking key support levels, it could provide an additional tailwind for XAGUSD.
The Role of Equities and Risk Appetite
Understanding the broader market sentiment, particularly the performance of major equity indices like the S&P 500 and Nasdaq 100, is vital for gauging risk appetite. These indices serve as barometers for investor confidence; a rising market typically indicates increased risk appetite, which can sometimes draw capital away from safe-haven assets like gold and silver. Conversely, a declining equity market often signals a 'risk-off' environment, prompting investors to seek refuge in perceived safe havens, thus boosting prices for precious metals. Currently, the S&P 500 is showing a strong upward move, trading at 6572.87 with a daily gain of 0.74%. The 4-hour trend is neutral (50% power), but the 1-hour trend is strongly bullish (100% power). Similarly, the Nasdaq 100 is also on the rise, trading at 29621.9 with a 1.08% daily increase. The 4-hour trend for the Nasdaq is bullish (88% power), while the 1-hour trend is neutral (50% power). This simultaneous strength in major equity indices, while generally indicating risk appetite, presents a slight headwind for silver if it were purely a safe-haven play. However, silver's industrial demand component, driven by economic activity, can sometimes see it move in tandem with equities during periods of economic expansion. The current price action suggests that, for now, the bullish drivers for silver are outweighing any potential drag from risk-on sentiment in equities.
Examining Oil Prices and Inflationary Pressures
The price of oil, particularly Brent crude, serves as a significant indicator of inflationary expectations and global economic health. Brent crude is currently trading at $71.98, up 0.57% on the day, suggesting a rise in energy costs. Historically, higher oil prices can contribute to inflation, prompting central banks to consider tighter monetary policies, which could eventually impact interest rates and currency valuations. Silver, often seen as an inflation hedge, can sometimes benefit from rising commodity prices, including oil. The daily chart for Brent crude shows a strong downtrend (100% power), with RSI at 27.1 in oversold territory, suggesting potential for a rebound. However, the 1-hour trend is neutral, and the 4-hour trend is bearish. This mixed picture in oil prices means its immediate impact on silver is less clear-cut. While rising oil prices could theoretically support silver as an inflation hedge, the overall bearish trend in crude suggests that broader inflationary pressures might not be accelerating rapidly enough to be the primary driver for silver's current surge. Focus remains on the technical strength within XAGUSD itself and its correlation with the dollar.
Key Levels and Potential Trading Scenarios for XAGUSD
The technical landscape for XAGUSD presents distinct levels that traders are closely monitoring. On the 4-hour chart, the immediate resistance is identified at $62.84, with further levels at $63.01 and $63.17. A decisive break and hold above $62.84 could signal the continuation of the current uptrend, potentially targeting higher resistance levels. Conversely, immediate support is found at $62.52, followed by $62.37 and $62.20. A failure to hold above $62.52 could trigger a short-term correction, pushing prices down towards the next support zones. The daily chart's resistance levels are significantly higher, at $62.36, $63.79, and $65.53, indicating substantial room for upward movement if the current momentum is sustained. The daily support levels are at $59.20, $57.45, and $56.03, representing substantial downside risk should the bullish trend falter. The current price action around $62.61 is critical; it sits just below the 1-hour resistance and above the 1-hour support, creating a pivotal point for the next directional move.
Bearish Scenario: Short-Term Correction Looming
55% ProbabilityNeutral Scenario: Consolidation Around $62.61
25% ProbabilityBullish Scenario: Continued Upside Momentum
20% ProbabilityThe Path Forward: What to Watch Next
The immediate future for XAGUSD hinges on its ability to decisively break through the $62.84 resistance level. A successful breach, confirmed by sustained trading above this mark on the 1-hour chart, would likely trigger further upside momentum, potentially targeting the $63.01 and $63.17 resistance levels. This scenario aligns with the strong bullish signals observed on the 4-hour timeframe, particularly the powerful ADX reading of 35.49 and the positive MACD momentum. However, traders must remain cognizant of the overbought Stochastic Oscillator readings on both the 1-hour and 4-hour charts. A failure to clear $62.84, or a decisive drop below the immediate support at $62.52, could lead to a short-term correction. The daily chart's neutral stance reinforces the idea that significant upside might require more than just current momentum; it may need a catalyst or a clearer signal from broader market conditions, such as a continued decline in the DXY or a shift in global risk sentiment. The prevailing ADX on the daily chart (40.35) still indicates a strong trend, but its direction is unclear due to conflicting oscillator signals, making the short-term price action around $62.61 the most critical determinant of the immediate future.
The interplay between technical indicators and price action is currently creating a high-stakes environment for XAGUSD traders. While the 4-hour timeframe screams bullish conviction, the hourly chart presents a more cautious outlook, with Stochastic divergence signaling a potential peak in short-term momentum. The daily chart adds further complexity, oscillating between bullish and bearish signals, highlighting a market that is not yet fully committed to a long-term direction. The current price of $62.61 is therefore a crucial pivot point. A sustained move above $62.84 would validate the bullish thesis, while a fall below $62.52 could initiate a retracement. Investors should pay close attention to the US Dollar Index's movement; a continued weakening trend there would likely provide additional support for silver. Similarly, shifts in equity market sentiment could influence safe-haven demand. The robust ADX readings across timeframes confirm a trending market, but the conflicting signals from oscillators necessitate careful risk management and a focus on clear price action confirmations rather than relying solely on indicator signals. Patience and discipline in waiting for high-probability setups will be key.
| Indicator | Value | Signal | Interpretation |
|---|---|---|---|
| RSI (14) | 67.88 | Neutral | Slightly overbought on 4H, but still room to move up. |
| MACD | Positive Momentum | Bullish | MACD line above signal line on 4H, indicating upward momentum. |
| Stochastic | K=89.59, D=85.19 | Bearish Divergence | Deeply overbought on 4H, %K nearing %D crossover suggests potential reversal. |
| ADX | 35.49 | Strong Trend | Confirms a strong uptrend on the 4H chart. |
| Bollinger Bands | Above Mid Band | Bullish | Price trading above the middle band on 4H, indicating upward pressure. |
Frequently Asked Questions: XAGUSD Analysis
What happens if XAGUSD breaks above the $62.84 resistance level?
A sustained break above $62.84 on the 1-hour chart would likely confirm the bullish scenario, potentially targeting resistance levels at $63.01 and $63.17. This would align with the strong 4-hour bullish trend signals but warrants caution due to overbought Stochastic readings.
Should I consider a short position if XAGUSD fails to hold above $62.52 support?
A close below $62.52 on the 1-hour chart could initiate a short-term correction, making a short position viable with targets at $62.37 and $62.20. However, this bearish scenario has a lower probability (55%) and is invalidated if price breaks above $62.84.
Is the RSI at 67.88 a concern for XAGUSD's upward momentum?
An RSI of 67.88 on the 4-hour chart indicates strong bullish momentum but is not yet in extreme overbought territory. While it suggests upward pressure, traders should monitor the Stochastic Oscillator, which is deep in overbought conditions and showing divergence, hinting at a potential slowdown or pullback.
How will the current DXY weakness impact XAGUSD's price action this week?
The DXY's current bearish trend on the 1-hour and 4-hour charts (at 100.81) provides a supportive backdrop for XAGUSD. Continued dollar weakness could fuel further upside for silver, especially if it breaks key support levels, reinforcing the inverse correlation.
Track markets in real-time
AI-powered analysis, technical indicators and real-time price data.
Join Our Telegram Channel
Breaking market news, AI analysis and trading signals instantly.
Join Channel