Silver's journey to $62.39 presents a critical juncture, a moment where the metal's recent upward momentum clashes with formidable resistance. This isn't just another price point; it's a level that traders have been watching intently, a line in the sand that could dictate the next significant move in the precious metal. As we dissect the current market landscape, it's clear that the narrative is complex, woven from threads of global economic data, central bank posturing, and the ever-present geopolitical undercurrents. The question on every trader's mind isn't just *if* this resistance will hold, but *why* it's so significant and what signals we should be looking for to gauge the likely outcome. This analysis dives deep into the multi-timeframe technicals and the broader market correlations that are shaping XAGUSD's immediate future.
- RSI at 67 on the 1-hour chart indicates bullish momentum is present but nearing overbought territory, suggesting caution.
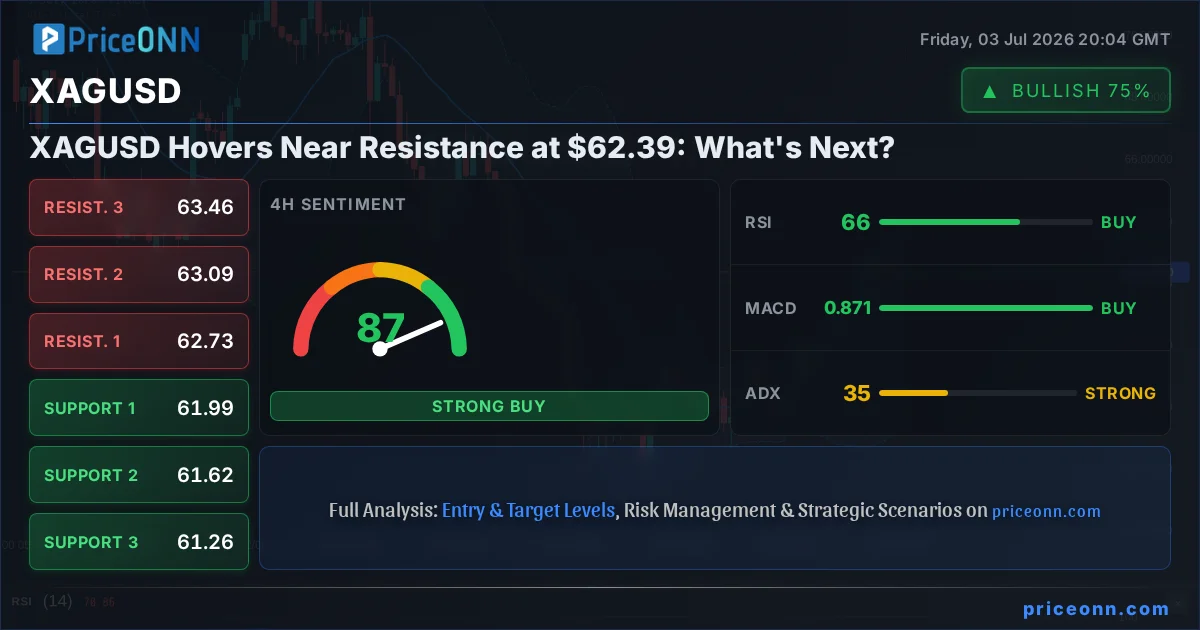
- Key resistance for XAGUSD stands at $62.49, with the current price hovering at $62.39, signaling a tight trading range.
- The ADX reading of 32.22 on the 1H chart and 35.45 on the 4H chart confirms a strong trend is in play, favoring continuation if resistance breaks.
- DXY's slight pullback to 100.85 provides some breathing room for commodities like silver, but its overall trend remains a crucial factor.
Navigating the $62.39 Threshold: A Multi-Timeframe Perspective
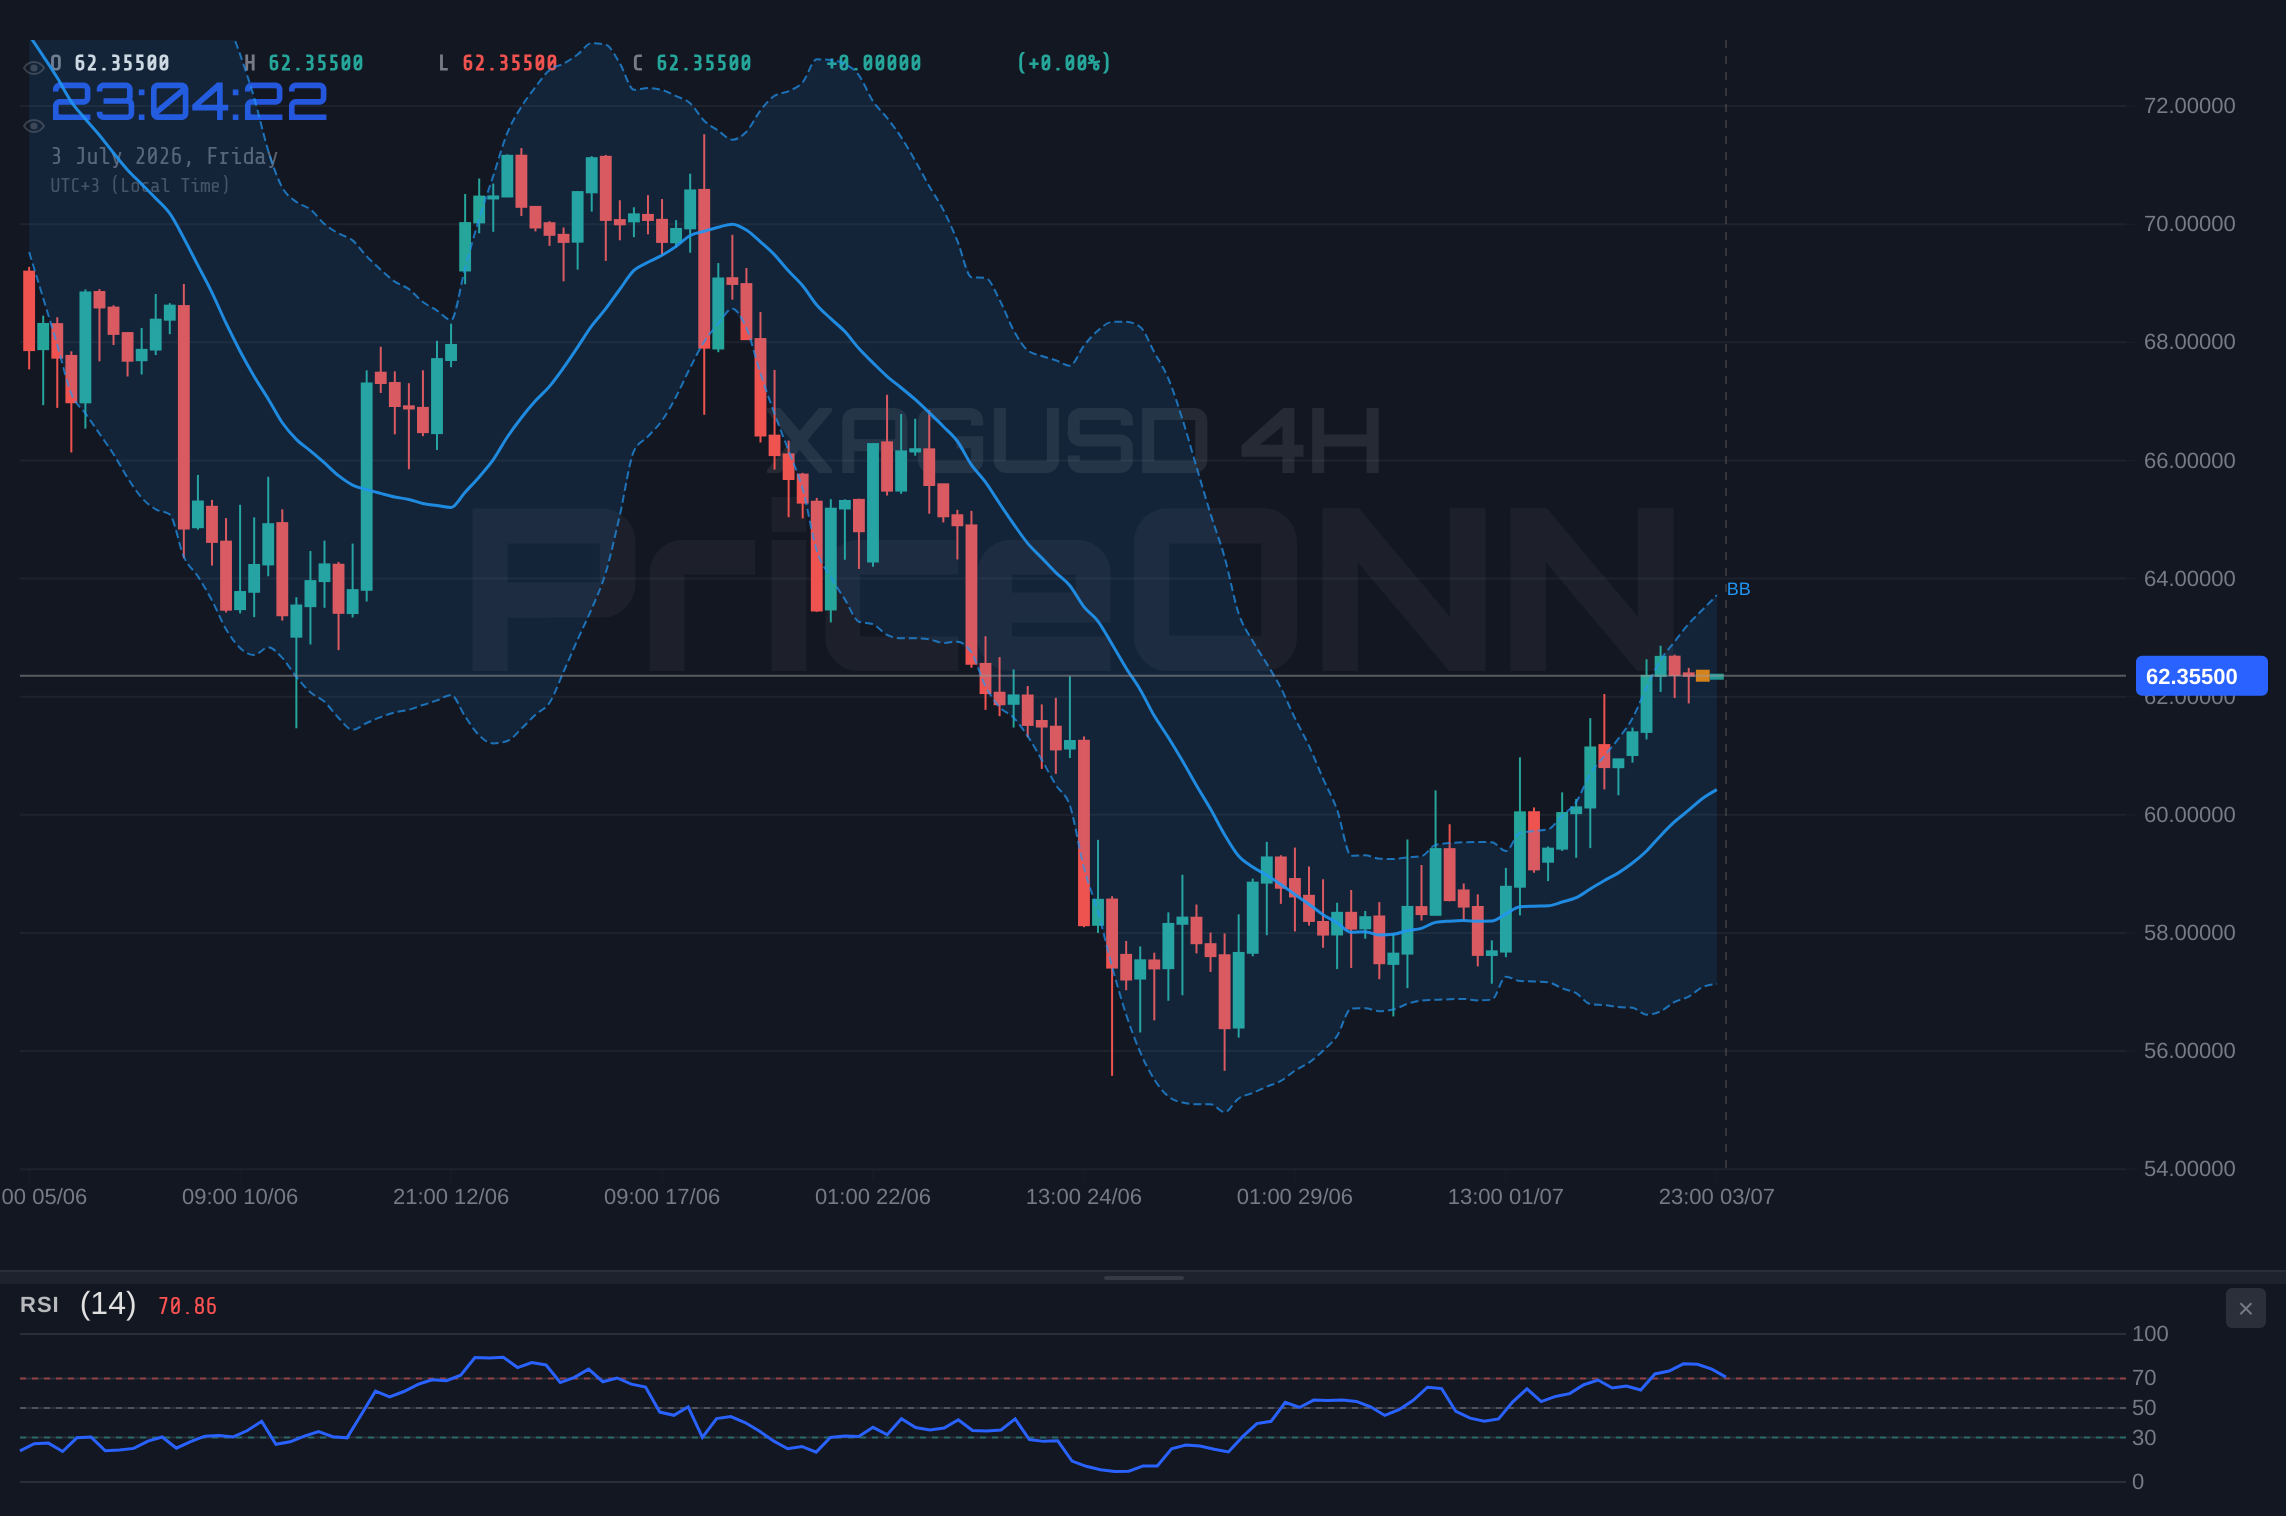
The immediate 1-hour chart for XAGUSD paints a picture of a market teetering on the edge. With the price currently consolidating around the $62.39 mark, the resistance level at $62.49 looms large. The RSI(14) hovers at 63.35, indicating a healthy bullish sentiment without yet screaming 'overbought' - there's still room for upward movement, but the pace might slow. However, the Stochastic Oscillator is flashing a cautionary signal, with %K at 43.57 and %D at 46.31, suggesting a potential for a short-term pullback as buyers might pause to consolidate gains. The ADX, a measure of trend strength, sits at 32.22, confirming that while a trend is present, it's not yet in extreme territory, leaving room for volatility. This short-term indecision is amplified by the MACD, which is showing negative momentum, with the MACD line below the signal line. This suggests that while the overall trend might be bullish, the immediate pressure is leaning towards sellers consolidating their positions before the next major push.
Stepping back to the 4-hour timeframe, the picture becomes clearer and more bullish. The trend is firmly established as rising, with a power score of 93%. The price is comfortably above the middle Bollinger Band, indicating upward pressure. The RSI(14) at 69.38 is approaching overbought, but still within a zone that has historically supported further gains in strong uptrends. The Stochastic oscillator here is more concerning for bulls, with %K at 88.37 and %D at 90.12, firmly in overbought territory and showing a slight bearish divergence (%K
The daily chart, however, introduces a layer of complexity, showing a neutral trend with a power of 50%. The RSI(14) at 46.8 is in the neutral zone, leaning towards a bearish inclination, and MACD shows positive momentum but on the 1D chart, it's below the signal line, indicating a potential shift. The Stochastic oscillator, surprisingly, shows a bullish signal with %K at 62.51 and %D at 29.64, indicating that the longer-term outlook might be more optimistic than the RSI suggests. The ADX at 40.35 indicates a strong trend, but the directionality is ambiguous given the conflicting signals from other indicators. This daily picture suggests that while the 4-hour trend is strongly bullish, the longer-term context is more balanced, waiting for a clearer catalyst to define the next major direction. The support levels at 4054.87 and resistance at 4167.91 on the daily chart are significant, and the current price of $62.39 is far removed from these, indicating a broader market context is influencing the smaller timeframes more directly.
Correlations and Cross-Market Influences: The Dollar's Shadow
Understanding XAGUSD's movements in isolation is only part of the story. Its relationship with the US Dollar Index (DXY) is a critical piece of the puzzle. Currently, the DXY is trading around 100.85, showing a slight dip on the 1-hour chart but a more neutral stance overall. The 4-hour DXY shows a bearish trend with RSI at 41.25, suggesting potential weakness in the dollar. Conversely, the daily DXY presents a bullish trend with RSI at 57.94. This mixed picture for the dollar mirrors the ambiguity seen in XAGUSD's daily chart. Typically, a weaker dollar supports precious metals like silver, and a stronger dollar tends to weigh on them. The current scenario, where XAGUSD is pushing resistance while the dollar shows conflicting signals across timeframes, suggests that other factors might be temporarily overshadowing the dollar's influence. However, any significant shift in the DXY, particularly a clear break above its daily resistance or a sustained fall below its support, will undoubtedly impact silver's trajectory.
Equity markets, particularly the S&P 500 and Nasdaq, serve as a barometer for risk appetite. The S&P 500 is currently showing a strong upward move on the 1-hour and 4-hour charts, trading at 6572.87, with a bullish trend indicated. However, the daily chart paints a bearish picture, with RSI at 45.35 and ADX at 47.51, signaling a strong downtrend. This divergence between intraday strength and a bearish daily outlook for equities suggests a cautious risk environment. Historically, when equities show such conflicting signals, investors often seek safe-haven assets. While gold (XAUUSD) is a primary safe haven, silver (XAGUSD) can also benefit, especially when its industrial demand outlook remains robust. The current upward push in XAGUSD, despite the mixed equity signals, might be driven by factors beyond simple risk sentiment, potentially including inflation hedges or specific industrial demand outlooks.
The price of oil, specifically Brent crude trading at $71.97, adds another layer to the inflation narrative. Brent shows a neutral trend on the 4-hour chart but a strong daily downtrend with RSI deep in oversold territory at 27.06. This suggests that inflationary pressures, at least from the energy sector, might be easing, which could reduce the appeal of commodities as a pure inflation hedge. However, oil prices are also heavily influenced by geopolitical tensions. Lingering Middle East tensions, as highlighted in recent news, can quickly disrupt supply and send prices soaring, reigniting inflation concerns. If oil prices were to spike due to geopolitical events, it would likely provide a tailwind for both gold and silver, irrespective of the broader risk sentiment. Currently, the subdued trend in oil suggests that inflation fears might not be the primary driver for silver's current push towards resistance, leaving technical factors and perhaps industrial demand in sharper focus.
The Tale of Two Trends: Short-Term Strength vs. Long-Term Caution
Focusing back on XAGUSD, the divergence between the short-term bullish signals and the more cautious longer-term outlook is a key element for traders to consider. The 4-hour chart, with its strong bullish trend (ADX 37.61), RSI nearing 70, and a general 'BUY' signal across multiple indicators, suggests that the immediate path of least resistance is upwards. This timeframe is often favored by swing traders looking to capture moves over a few days. The support levels at 4168.18 and 4159.52 are critical; a hold above these could fuel a move towards the 4-hour resistance at 4185.8. However, the Stochastic oscillator in overbought territory on this timeframe serves as a warning flag for extended rallies without consolidation.
The 1-hour chart, while showing immediate bullishness, is plagued by negative MACD momentum and a Stochastic oscillator that has already dipped below its signal line, hinting at potential intraday pullbacks. This suggests that scalpers and very short-term traders might be looking for quick entries and exits, perhaps capitalizing on minor fluctuations around the $62.39 level. The resistance at $62.49 and $62.63 are the immediate hurdles. A failure to decisively break these levels could lead to a retest of the 1-hour support at $62.15, a level that has shown some resilience.
The daily chart, with its neutral trend and conflicting indicators like RSI leaning bearish while Stochastic shows bullishness, presents the biggest challenge for long-term investors. The ADX at 40.35 suggests a strong trend, but its direction is unclear. This ambiguity means that longer-term positions might require wider stops or a more patient approach, waiting for clearer confirmation from either a decisive break above the daily resistance at $4167.91 or a fall towards the daily support at $4054.87. Given the current price action is far removed from these daily extremes, it implies that the shorter-term dynamics are currently dominating market sentiment for XAGUSD.
Trading Scenarios: Charting the Path Forward
With XAGUSD hovering at a critical resistance level of $62.39, several scenarios are plausible. The current technical setup, marked by strong short-term uptrends but mixed signals on longer timeframes, necessitates a nuanced approach. Understanding the probabilities associated with each scenario is paramount for effective risk management.
Bearish Scenario: Resistance Holds Firm
40% ProbabilityNeutral Scenario: Consolidation and Observation
35% ProbabilityBullish Scenario: Resistance Breakout
25% ProbabilityThe prevailing sentiment, supported by the 4-hour trend and the daily ADX, leans towards a continuation of the upward move if the immediate resistance can be overcome. However, the conflicting signals on the hourly and daily charts, coupled with the Stochastic oscillator flashing overbought conditions on multiple timeframes, suggest that a period of consolidation or even a brief pullback is highly probable before any sustained rally can occur. Traders should pay close attention to the price action around $62.49 and $62.15 as immediate indicators of short-term sentiment. A decisive move above $62.63 could signal a continuation towards higher resistance levels, while a break below $62.15 might indicate a deeper correction towards the 4-hour support at $61.99.
The strong ADX readings across multiple timeframes indicate significant trend strength, but also suggest that a reversal, if it occurs, could be sharp. Always use strict stop-loss orders and position sizing appropriate to your risk tolerance, especially when trading around key resistance levels.
The Bigger Picture: Inflation, Interest Rates, and Gold's Role
Beyond the immediate technicals, the macroeconomic environment continues to play a pivotal role in shaping the outlook for precious metals. The Federal Reserve's monetary policy stance remains a primary driver for the US dollar and, by extension, for gold and silver. While recent cooling economic data, such as softer US jobs data, has lowered the odds of aggressive Fed rate hikes, the market remains sensitive to any hints of continued hawkishness or a prolonged period of higher-for-longer interest rates. The divergence in monetary policy expectations globally also influences currency pairs like EUR/USD and GBP/USD, which, in turn, can indirectly affect silver's safe-haven appeal. The current price action in EUR/GBP, for instance, shows a potential reversal of yield convergence trades, highlighting broader currency market dynamics that traders need to monitor.
Inflation expectations, often reflected in commodity prices and bond yields, are another crucial element. While oil prices have shown some weakness, suggesting easing energy-driven inflation, the broader inflation picture remains a key concern for central banks. If inflation proves more persistent than anticipated, it could strengthen the case for further tightening or at least a delayed pivot to easing by central banks, which might put pressure on risk assets and boost demand for safe havens like silver. The yield curve, particularly the spread between short-term and long-term Treasury yields, offers insights into future economic growth expectations and inflation concerns. A steepening yield curve typically signals rising inflation expectations, while a flattening or inverted curve can indicate concerns about future growth.
Geopolitical risks, though not always directly reflected in the daily price action of silver, remain a constant background factor. Lingering tensions in the Middle East, as noted in recent energy market reports, can quickly inject volatility into the markets, driving demand for safe-haven assets. Similarly, ongoing geopolitical developments in Eastern Europe and the broader US-China relationship continue to influence global risk sentiment. While these factors might not be the primary catalyst for silver's current push to resistance, they create an environment where safe-haven demand can surge unexpectedly, potentially providing a strong tailwind for XAGUSD should broader market sentiment shift towards risk aversion.
Frequently Asked Questions: XAGUSD Analysis
What happens if XAGUSD breaks above the $62.49 resistance level?
A decisive break above $62.49, especially on the 4-hour chart with increasing volume, could trigger further upside momentum. This would likely target the next resistance levels at $62.84 and potentially $63.09, aligning with the bullish scenario. However, confirmation would be needed, ideally with a sustained close above $62.63.
Should I buy XAGUSD at current levels of $62.39 given the RSI is at 67?
Buying at $62.39 with RSI at 67 presents a mixed risk-reward profile. While the 4-hour trend is bullish, the RSI nearing overbought territory and the immediate resistance at $62.49 suggest caution. A more prudent approach might be to wait for a confirmed breakout above resistance or a pullback to support levels like $62.15, with a probability estimate favoring consolidation in the short term.
Is the Stochastic's overbought signal at 88.37 on the 4H chart a strong sell signal for XAGUSD?
While Stochastic in the high 80s is typically considered overbought and can signal an impending pullback, it's not an automatic sell signal in a strong uptrend. The ADX at 37.61 indicates a robust trend, suggesting that the market can remain overbought for some time. This signal warrants watching for potential short-term consolidation or a minor correction rather than an immediate reversal.
How will the DXY's current neutral stance affect XAGUSD's price action near $62.39?
The DXY's current neutral to slightly bearish short-term trend provides some underlying support for XAGUSD, allowing it to test resistance without immediate dollar-induced pressure. However, the daily DXY shows a bullish trend, indicating that any significant dollar strength could still cap silver's upside. Traders should monitor the DXY's reaction to its own key levels, as a clear directional move there could significantly influence XAGUSD's next leg.
Technical Outlook Summary
| Indicator | Value | Signal | Interpretation |
|---|---|---|---|
| RSI (14) | 67.35 | Neutral | Approaching overbought, watch for consolidation. |
| MACD Histogram | -0.15 | Bearish | Negative momentum, sellers gaining slight edge. |
| Stochastic | K:43.57, D:46.31 | Bearish | %K crossed below %D, potential short-term pullback. |
| ADX | 32.22 | Bullish | Strong trend strength, favoring continuation. |
| Bollinger Bands | Middle Band | Bullish | Price above middle band, upward pressure. |
Track markets in real-time
AI-powered analysis, technical indicators and real-time price data.
Join Our Telegram Channel
Breaking market news, AI analysis and trading signals instantly.
Join Channel