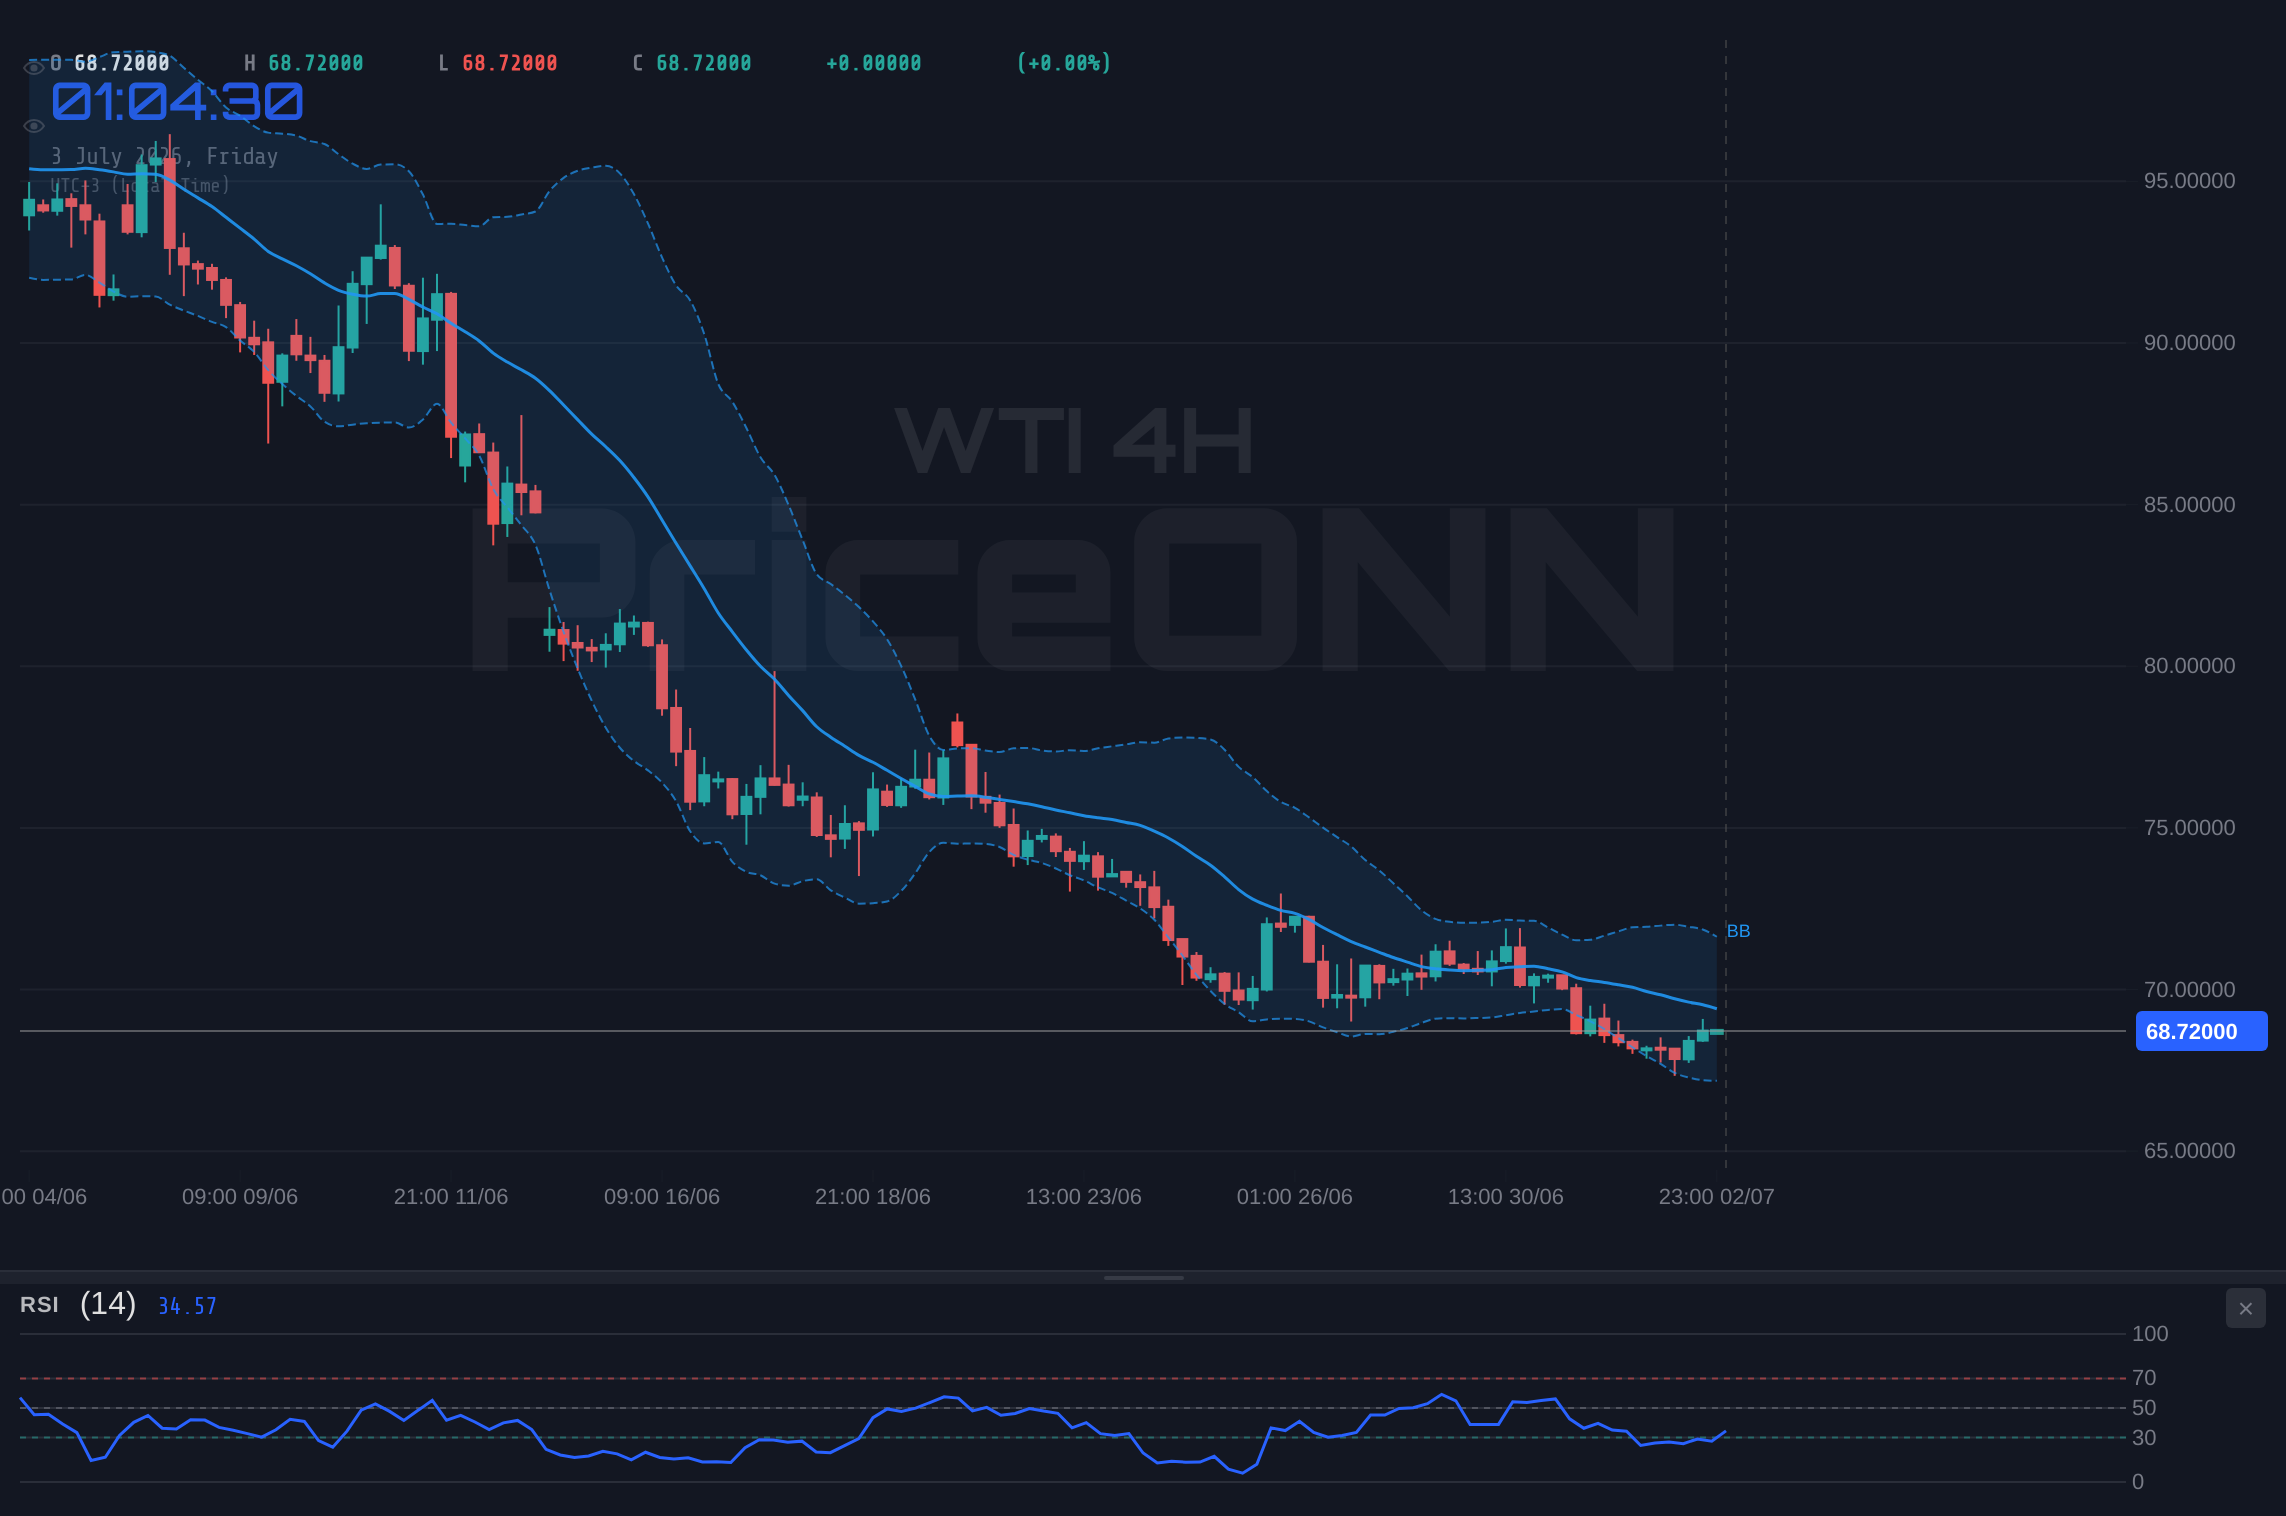
The relentless tug-of-war between bullish and bearish forces in the WTI crude oil market has brought prices to a critical juncture, with the commodity currently hovering around $68.79. This level is not just another price point; it represents a significant battleground where the short-term trend's conviction will likely be decided. With the 4-hour ADX at a robust 37.93, indicating a strong trend is in play, traders are closely watching whether this upward momentum can breach the immediate resistance at $69.83, or if profit-taking and renewed selling pressure will send WTI retreating. This analysis delves into the competing narratives, dissecting the technical indicators and macro undercurrents that are shaping this pivotal moment for oil prices.
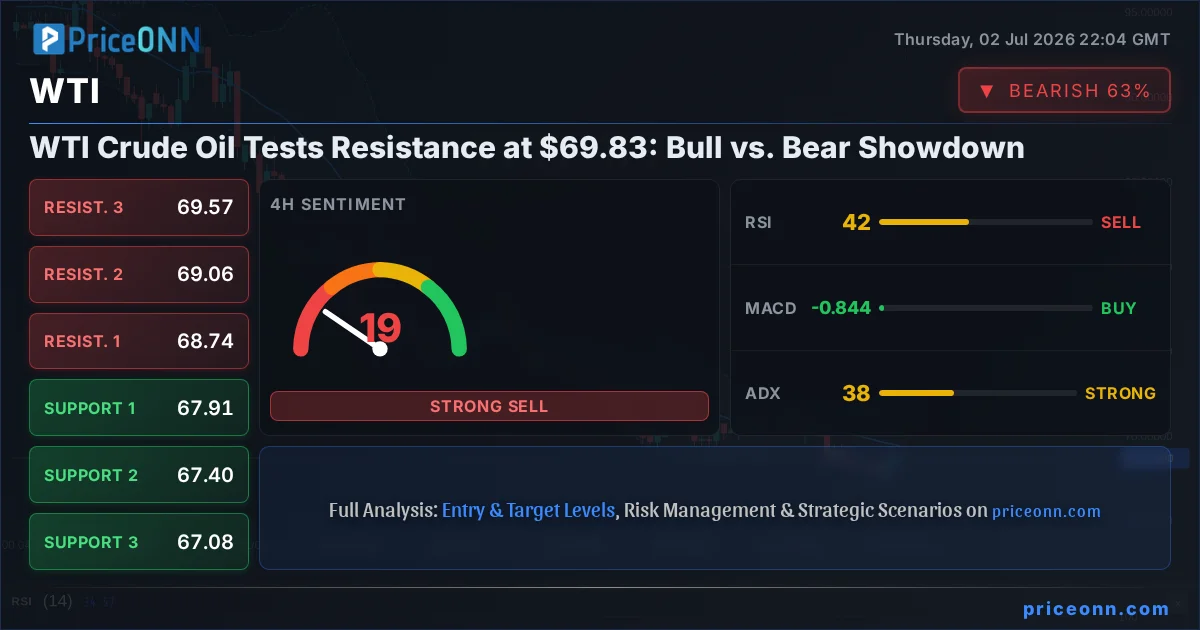
- WTI Crude Oil is trading at $68.79, facing immediate resistance at $69.83.
- The 4-hour ADX at 37.93 signals a strong trend, but Stochastic is in the extreme zone, creating entry timing uncertainty.
- Bullish sentiment is supported by positive MACD momentum on 1H and 4H charts, though the 1D RSI at 41.31 shows downward pressure.
- Geopolitical risks and inflation concerns are background drivers, with Brent crude's daily trend also showing bearish signals.
- The key battleground is the $69.83 resistance; a decisive break could target $70.93, while a failure might lead to a retest of $68.74.
The Bulls' Case: Momentum and Macro Tailwinds
The bullish argument for WTI crude oil rests on a confluence of technical momentum and broader market dynamics. On the 1-hour timeframe, the trend is neutral but shows strength (50% power), with a significant 87% trend strength reading. Crucially, the MACD is exhibiting positive momentum, with the MACD line firmly above the signal line, suggesting that buying pressure is building. This is further corroborated by the Stochastic oscillator, where the K line (87.04) is above the D line (74.82) on the 1-hour chart, indicating a bullish signal and potentially signaling further upside. While the RSI(14) on the 1-hour chart sits at 58.32 in neutral territory, its upward inclination suggests buyers are gaining ground. The 4-hour chart reinforces this bullish bias, with a General Signal of 'BUY' (7 buys, 1 sell, 0 neutral). The Stochastic on this timeframe is even more pronounced, with K at 89.16 and D at 80.48, firmly in overbought territory but still signaling upward movement. This technical picture, suggesting strengthening upward momentum, is supported by the broader market context. The DXY (Dollar Index) is showing a bearish trend on the 4-hour chart at 100.44, which typically correlates with strength in commodities like oil, as a weaker dollar makes oil cheaper for holders of other currencies. Furthermore, the SP500 is in a strong uptrend on the 1-hour chart (6572.87), indicating a risk-on environment where investors are more willing to allocate capital to riskier assets like oil.
The Bears' Counter-Argument: Daily Weakness and Conflicting Signals
Despite the short-term bullish signals, a closer examination, particularly on the daily timeframe, reveals significant headwinds that embolden the bears. The 1-day chart for WTI presents a starkly different picture. The trend is classified as bearish with 100% power, and the RSI(14) is at 27.61, deep in oversold territory. This RSI reading, while suggesting a potential for a bounce, also indicates that underlying selling pressure has been dominant. The MACD on the daily chart is showing negative momentum, with the MACD line below the signal line, contradicting the shorter-term timeframes and signaling that the longer-term trend is still bearish. Bollinger Bands on the daily chart are below the middle band, reinforcing the bearish sentiment. The Stochastic on the daily chart (K=9.59, D=12.04) is also in extreme oversold territory, confirming the selling pressure, although it could foreshadow a reversal if buyers step in. Adding to the bearish case, Brent crude oil, a close cousin to WTI, exhibits similar daily weakness. Its 1-day trend is also bearish (100% power), with an RSI of 26.12, deep in oversold territory, and MACD showing negative momentum. This intermarket correlation suggests a broader weakness in the energy sector might be at play. Moreover, the Nasdaq 100 index is in a strong downtrend on the 1-hour chart (29326.50), and the SP500, despite its 1-hour strength, shows a bearish 1-day trend. This indicates that the broader risk sentiment, while mixed, has significant bearish undertones, which could spill over into oil markets.
Technical Crossroads: Interpreting the Indicators at $68.79
At the current price of $68.79, WTI is perched precariously close to its immediate resistance level of $69.83. The technical indicators present a complex, often conflicting, narrative. On the 1-hour and 4-hour charts, there's a clear indication of bullish momentum, with MACD showing positive readings and Stochastic oscillators in overbought territory but still trending upwards. The ADX at 37.93 on the 1-hour chart and 38.69 on the 4-hour chart is particularly noteworthy, signaling a strong existing trend. However, the divergence appears on the daily chart. While shorter timeframes suggest upward potential, the daily RSI at 27.61 and MACD's negative momentum paint a picture of underlying weakness. This creates a classic scenario of conflicting signals across timeframes. The ADX, while indicating a strong trend, doesn't specify the direction on its own; its high value simply confirms that a trend is active. The question is, which trend is dominant: the short-term bullish push or the longer-term bearish undertone? The Stochastic readings in extreme overbought/oversold zones across different timeframes also add to the ambiguity, suggesting that the market might be due for a significant move but is uncertain about its direction without further confirmation.
The $69.83 Level: A Battleground for Control
The immediate focus for WTI traders is the resistance level at $69.83. This is not just a price ceiling; it's a psychological and technical barrier that has dictated price action in recent trading sessions. A decisive break above $69.83, especially on increasing volume and with sustained bullish momentum across multiple timeframes, would invalidate the bearish daily signals and potentially open the door for a move towards the next resistance at $70.93. Such a breakout would likely be fueled by positive news, such as unexpected inventory drawdowns, geopolitical tensions escalating crude supply risks, or a significant shift in risk sentiment towards a strong 'risk-on' environment. Conversely, failure to overcome $69.83, particularly if accompanied by waning momentum or a downturn in correlated assets like the S&P 500 or a strengthening DXY, would suggest the bearish trend on the daily chart remains intact. In this scenario, WTI could see a pullback towards its immediate support at $68.74, followed by a potential retest of lower levels.
Correlations and Macro Drivers: The Bigger Picture
Understanding WTI's price action requires looking beyond its immediate chart patterns to the broader economic and geopolitical landscape. The US Dollar Index (DXY) is a key correlation. Currently, the DXY's 4-hour trend is bearish towards 100.44, which generally supports higher oil prices. However, the DXY's 1-day trend is showing a bullish inclination, adding a layer of complexity. If the dollar strengthens significantly, it could cap any upside in WTI. Equity markets provide another crucial lens. The S&P 500's strong 1-hour uptrend suggests a positive risk appetite, which is generally conducive to oil demand. However, the daily bearish trend in the S&P 500 and Nasdaq 100 hints at underlying fragility in the broader market, which could quickly sour risk sentiment and negatively impact oil. Geopolitical tensions, particularly in the Middle East, remain a constant underlying factor that can inject volatility into oil prices. While no immediate major escalations are reported, any flare-up could provide a significant bullish catalyst for WTI. Furthermore, inflation concerns, often linked to energy prices, are always in the background. Goldman Sachs' recent warning about a potential 2027 supply glut, though further out, adds a bearish long-term perspective to the energy market, suggesting that current price rallies might be temporary if supply fundamentals reassert themselves.
The Role of Inventory Data and OPEC+
Weekly oil inventory reports, particularly from the US Energy Information Administration (EIA), are critical catalysts that can significantly influence WTI's short-term direction. A larger-than-expected drawdown in crude oil inventories would typically support prices, validating the bullish short-term signals and potentially helping WTI break through the $69.83 resistance. Conversely, an unexpected build in inventories would likely confirm the daily bearish trend and pressure prices lower, especially if coupled with weak demand signals. The decisions and statements from OPEC+ also play a pivotal role. While the group has been instrumental in managing supply to support prices, any signals of increased production or wavering commitment to cuts could spook the market. Goldman Sachs' forecast of a future surplus, even if for 2027, underscores the market's sensitivity to supply-side dynamics. Traders will be keenly watching for any chatter or official announcements from OPEC+ that could impact the supply-demand balance. The interplay between these inventory figures and OPEC+ policy will be crucial in determining whether the current price action is a temporary bounce or the start of a sustained move.
Intermarket Dynamics: WTI vs. Brent and Other Commodities
The relationship between WTI and Brent crude oil is highly correlated, and divergences can offer valuable insights. Currently, both benchmarks show similar patterns: strength on shorter timeframes but significant bearish signals on the daily chart. This intermarket correlation reinforces the idea that the current price action might be a short-term technical bounce within a larger bearish trend for crude oil. Examining other commodities also provides context. Silver (XAGUSD) has seen a strong rally, reaching the top of its weekly range, partly driven by a weaker dollar. This broader commodity strength could offer some support to WTI. However, gold (XAUUSD) is showing a strong bullish trend on the 1-hour and 4-hour charts, trading at $4126.08, but its daily RSI is at 43.34, suggesting a potential slowdown. This mixed performance across commodities highlights the nuanced market environment. While some commodities are riding a weaker dollar, the underlying trend signals for oil, particularly on the daily timeframe, warrant caution.
Navigating the Conflicting Signals: A Trader's Perspective
For traders, the current WTI setup presents a challenging but potentially rewarding scenario. The conflicting signals across different timeframes demand a disciplined approach. Scalpers and short-term traders might look to capitalize on the bullish momentum on the 1-hour and 4-hour charts, aiming for quick gains as WTI approaches $69.83 and potentially $70.93. However, they must remain acutely aware of the daily bearish undertones and be ready to exit positions quickly if the price fails to break higher or reverses sharply. Swing traders and those with a longer-term horizon will likely adopt a more cautious stance. They may wait for clearer confirmation, such as a decisive daily close above $69.83 with strong follow-through, or a breakdown below the critical support at $68.74. The high ADX values across timeframes suggest that trends are active, but the divergence between short-term bullishness and long-term bearishness means that breakout or breakdown plays could be volatile. Risk management is paramount; setting tight stop-losses below key support levels or just above resistance is essential to protect capital.
Scenario Analysis: Bullish Breakout vs. Bearish Reversal
Bearish Reversal: Back Below $68.74
45% ProbabilityConsolidation Around $69.00
25% ProbabilityBullish Breakout: Above $69.83
30% ProbabilityThe current technical picture for WTI crude oil at $68.79 presents a classic bull vs. bear debate, with significant conflicting signals across timeframes. The shorter-term charts (1H and 4H) exhibit bullish momentum, supported by positive MACD readings and Stochastic oscillators in overbought territory, suggesting potential for an upward move towards the $69.83 resistance. The strong ADX readings (37.93 on 1H, 38.69 on 4H) confirm an active trend. However, the daily chart paints a bearish picture, with a low RSI (27.61) and negative MACD momentum, indicating that the longer-term trend might still be downwards. Intermarket correlations are mixed: a weaker dollar and stronger S&P 500 (short-term) support oil, but the daily bearish trends in equities and Brent crude add caution. The key level to watch is $69.83. A decisive breakout above this level, confirmed by daily momentum, could signal a genuine shift, targeting $70.93. Conversely, failure at this resistance, especially with weaker inventory data or geopolitical de-escalation, could lead to a sharp pullback towards $68.74 and below. Traders must manage risk tightly, as the current ambiguity means both breakout and breakdown scenarios are plausible.
Frequently Asked Questions: WTI Analysis
What happens if WTI fails to break above the $69.83 resistance level?
If WTI fails to break the $69.83 resistance, it would likely confirm the bearish signals seen on the daily chart. This could lead to a pullback towards the immediate support at $68.74. A sustained move below this level would then target the 4-hour support at $67.91, indicating a continuation of the bearish trend.
Should I buy WTI at current levels around $68.79 given the conflicting signals?
Buying at $68.79 requires careful risk management due to conflicting signals. A high-probability entry might consider waiting for a confirmed daily close above $69.83, targeting $70.93, with a stop-loss below $68.74. Alternatively, waiting for a confirmed breakdown below $68.74 to enter short positions targeting $67.91 could be a safer strategy given the daily bearish indicators.
Is the RSI at 27.61 on the daily chart a buy signal for WTI?
An RSI reading of 27.61 on the daily chart is indeed in oversold territory, historically suggesting a potential for a bounce. However, it does not automatically constitute a buy signal. It indicates significant selling pressure and implies that a reversal would require strong bullish confirmation, such as positive MACD crossover and a break of key resistance levels, to be considered reliable.
How will upcoming inventory data affect WTI prices around $68.79?
Upcoming inventory data, particularly from the EIA, could be a major catalyst. A larger-than-expected inventory drawdown would likely support WTI, potentially helping it break the $69.83 resistance and target $70.93. Conversely, an unexpected inventory build would confirm bearish sentiment and could push WTI back towards $68.74 and lower.
| Indicator | Value | Signal | Interpretation |
|---|---|---|---|
| RSI (14) | 27.61 | Oversold | Daily chart shows strong selling pressure, potential bounce area. |
| MACD Histogram | Negative | Bearish Momentum | Daily chart shows negative momentum. |
| Stochastic | K=9.59, D=12.04 | Oversold | Daily chart in extreme oversold zone, potential reversal indication. |
| ADX | 37.71 | Strong Trend | Daily chart indicates a strong existing trend. |
| Bollinger | Middle Band | Watch | Daily price is below the middle band, indicating bearish pressure. |
Track markets in real-time
AI-powered analysis, technical indicators and real-time price data.
Join Our Telegram Channel
Breaking market news, AI analysis and trading signals instantly.
Join Channel