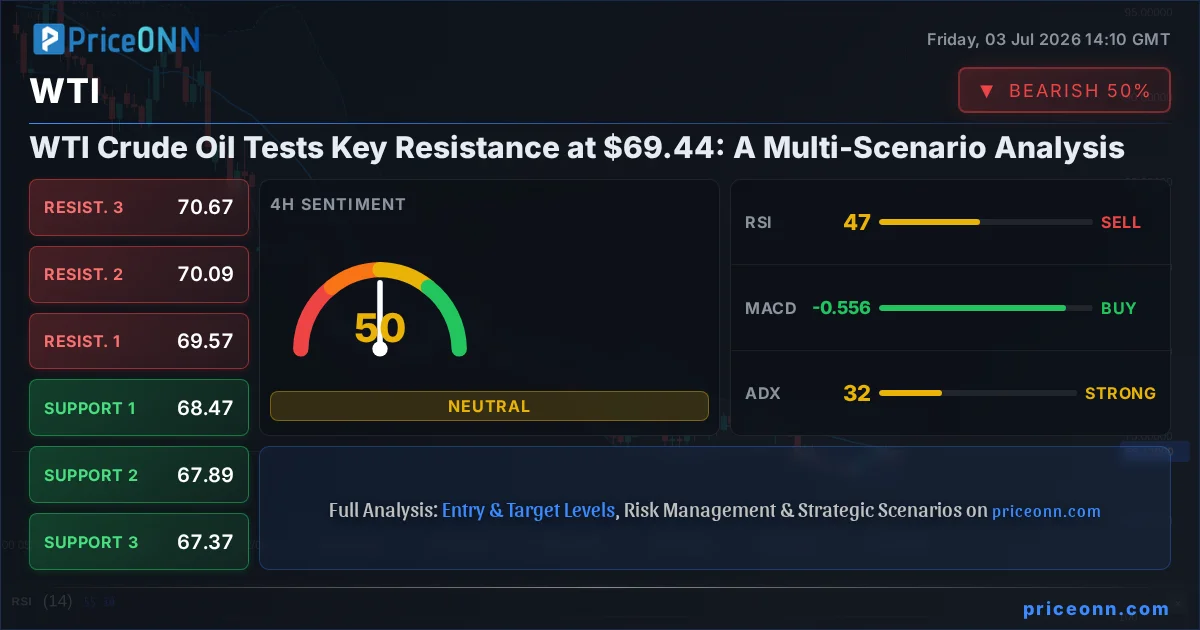
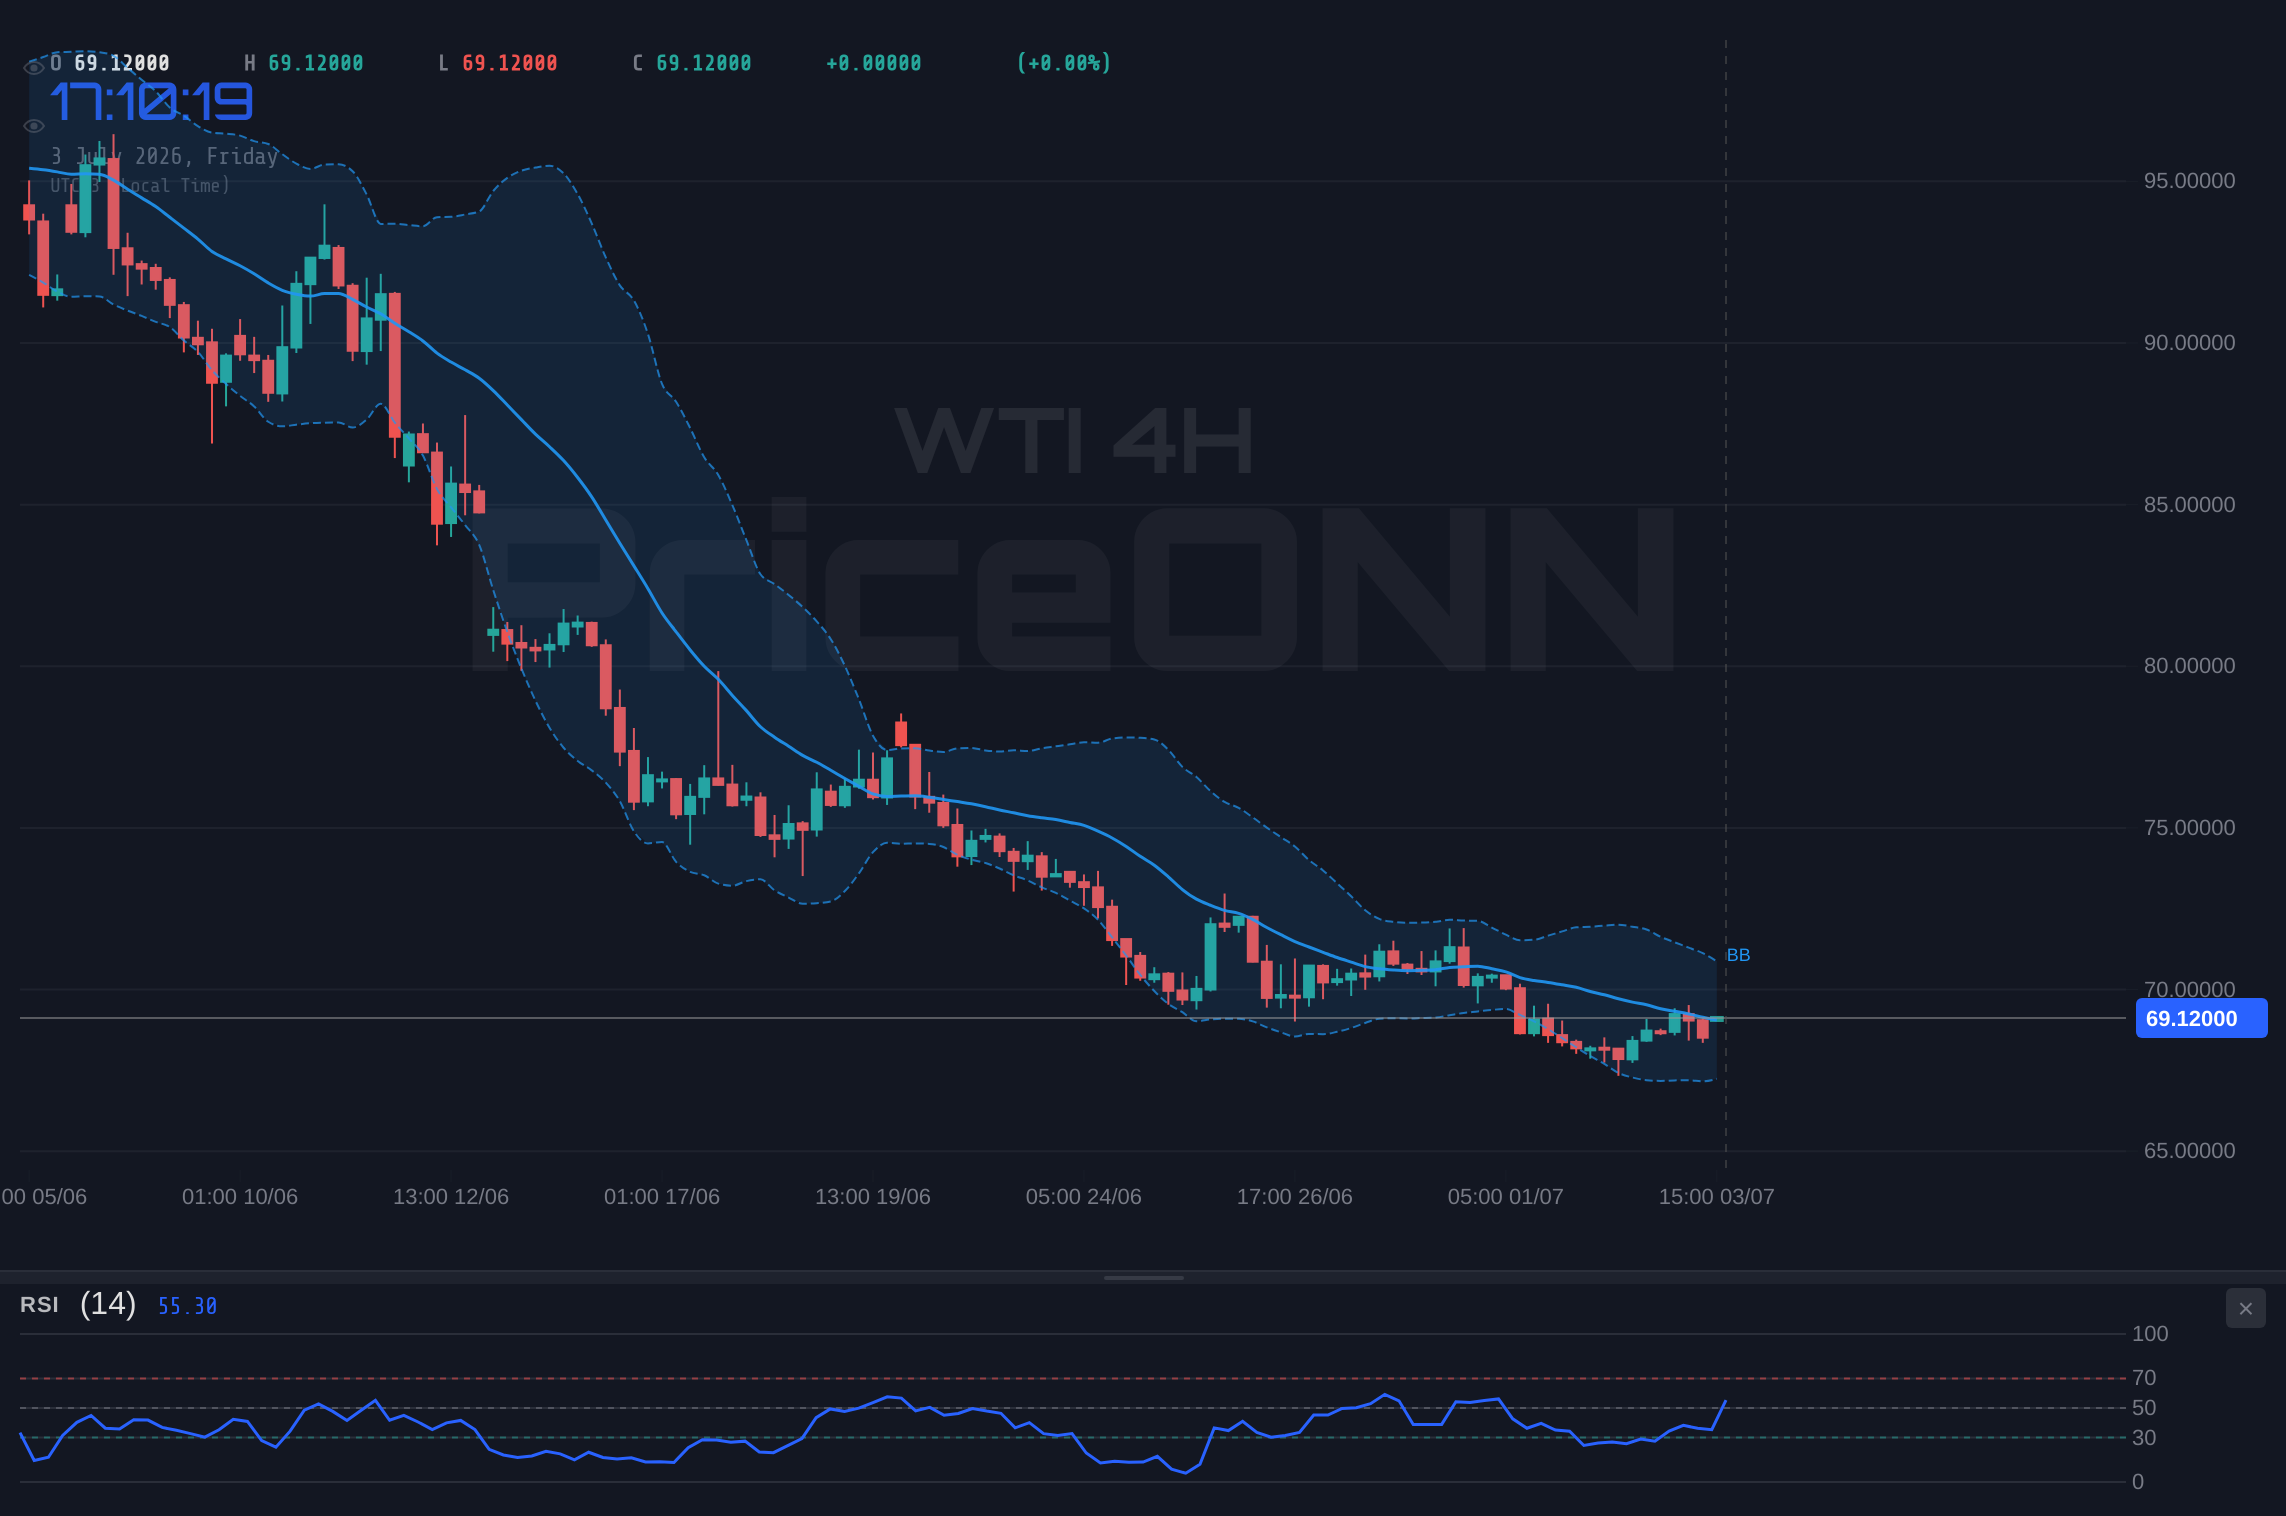
WTI crude oil is currently trading at $69.17, a critical juncture as it approaches the significant resistance level of $69.44. This price point, a key battleground for bulls and bears, will likely dictate the near-term direction for this vital energy commodity. Having recently shown signs of recovery from earlier lows, WTI's ability to decisively break through this barrier or face rejection will be closely watched by market participants globally. The interplay between technical indicators, macroeconomic sentiment, and geopolitical undercurrents is painting a complex picture, demanding a nuanced, multi-scenario approach to navigate the evolving market landscape. This analysis delves into the probable outcomes, the triggers to watch, and the underlying factors influencing WTI's trajectory in the coming days and weeks.
- The ADX at 31.87 indicates a strong downtrend, suggesting that the current upward move might be a corrective phase rather than a new bullish trend.
- WTI is currently trading at $69.17, with the critical resistance level at $69.44 looming. A close above this level is needed to confirm a bullish pivot.
- The RSI at 56.88 on the 1H chart shows upward momentum, but on the 1D chart, it's at 28.68, signaling oversold conditions that could precede a bounce.
- Geopolitical tensions and supply-side factors remain elevated, creating a volatile backdrop for crude oil prices.
The Bull's Path: A Breakout Above $69.44
For the bulls to seize control, a decisive breach above the $69.44 resistance is paramount. This level has acted as a ceiling, and a sustained move beyond it would signal a significant shift in market sentiment. The 1-hour chart shows a bullish RSI at 56.88, suggesting some upward momentum is present, and the MACD, while showing negative momentum on this timeframe, is hovering near the signal line. If WTI can gather strength and push through $69.44, the next logical resistance target would be the 4-hour chart's resistance at $72.56, followed by the more significant $73.08 level. The 1-hour chart's general signal of 'BUY' (5 Buy, 3 Sell) also lends some credence to this scenario, although it's crucial to note the conflicting signals on other timeframes and indicators. A key confirmation would be increasing trading volume accompanying the price rise above $69.44, indicating strong conviction from buyers. Furthermore, a daily close above this resistance would significantly bolster the bullish case, potentially setting the stage for a move towards the $70.09 and $71.20 levels identified on higher timeframes. However, the strong downtrend indicated by the 1D ADX at 38.84 suggests that such a breakout might face considerable headwinds and could be a bull trap if not supported by broader market shifts.
The underlying fundamentals would need to align for this bullish scenario to materialize. This could involve unexpected positive geopolitical developments, such as de-escalation in a key oil-producing region, or a significant supply disruption elsewhere that tightens the global market more than anticipated. For instance, a surprise announcement from OPEC+ regarding deeper production cuts, or a major outage at a key refinery or pipeline, could provide the catalyst needed to push prices decisively higher. From a macroeconomic perspective, a weakening US Dollar (DXY), currently showing a bearish signal on the 1D chart, could also provide tailwinds for commodities priced in dollars, like WTI. If the DXY falls below its support levels, it might encourage a flight into riskier assets, including oil. On the 4-hour chart, the Stochastic indicator is showing a bullish signal (K=84.5, D=58.3), suggesting potential for upward movement, and the Bollinger Bands are widening, indicating increasing volatility. The presence of strong support levels at $68.47 and $67.89 on the 4-hour chart also provides a safety net for any potential pullback, allowing bulls to re-enter if the price consolidates before a further advance. The 1-day RSI at 28.68 is deeply oversold, which historically has often preceded a bounce, further supporting the bullish thesis if the price can break the immediate resistance.
Where Bears Take Control: A Rejection at $69.44
Conversely, a rejection at the $69.44 resistance level would likely see WTI crude oil prices retreat, potentially retesting lower support levels. The 1-day timeframe presents a strong bearish signal with an ADX of 38.84, indicating a robust downtrend is in play. The RSI on the daily chart is at a deeply oversold 28.68, and the Stochastic indicator (K=12.61, D=12.75) is also in oversold territory, suggesting that while a short-term bounce is possible, the larger trend favors downside. If price fails to break above $69.44, the immediate support to watch would be $68.67 on the 1-hour chart, followed by $68.35. A decisive break below these levels could open the door to the 4-hour support at $68.47, and subsequently, the more significant $67.89 and $67.37 levels. The 4-hour chart's general signal of 'SELL' (3 Buy, 5 Sell) reinforces this bearish outlook. The MACD on the 1-day chart is also showing negative momentum, reinforcing the idea that the current upward move might be a temporary correction within a larger downtrend.
Several factors could contribute to this bearish scenario. Persistent concerns about global economic slowdown, which could dampen oil demand, would weigh heavily on prices. Cooling economic data, such as the recent US Non-Farm Payrolls (NFP) report showing weaker-than-expected job growth, could fuel fears of a recession, leading investors to shed riskier assets like oil. The strengthening US Dollar (DXY), which is showing a neutral signal on the 1H and a strong sell signal on the 4H, could also put pressure on dollar-denominated commodities. If the DXY finds renewed strength and moves back towards its resistance levels, it would typically correlate with a decline in WTI prices. Geopolitical factors, while currently supportive of higher prices due to supply concerns, could also shift. For example, a sudden resolution or de-escalation of conflicts in the Middle East, or positive news regarding production increases from non-OPEC+ nations, could rapidly remove the risk premium from oil prices. The technical picture on the 1-hour chart, despite showing a 'BUY' signal, is also marred by a Stochastic indicator showing a bearish crossover (%K
The Waiting Game: Consolidation Around $69.17
A neutral scenario, where WTI crude oil consolidates within a defined range, is also a distinct possibility, particularly if neither the bulls nor the bears can decisively establish control. In this scenario, prices might oscillate between the immediate support at $68.35 (1H) and the resistance at $69.44 (1H). This range-bound action could persist as the market awaits clearer fundamental signals or a more definitive technical setup. The ADX indicator on the 1-hour chart at 20.34 suggests a weak trend, which is consistent with consolidation. During such periods, traders often look for opportunities to fade extremes – buying near support and selling near resistance. The RSI on the 1-hour chart at 56.88 would remain in neutral territory, and the MACD might fluctuate around the zero line without establishing a clear directional momentum. The Stochastic on the 1-hour chart showing a bearish crossover (%K
This consolidation could be driven by conflicting market forces. For instance, ongoing geopolitical tensions might provide a floor under prices, preventing a sharp decline, while persistent concerns about global demand and the potential for a recession could cap any significant upside momentum. The market might be in a 'wait-and-see' mode, digesting recent economic data and anticipating upcoming events, such as central bank policy announcements or further OPEC+ directives. The current price of $69.17 sits squarely within this potential consolidation zone. The daily chart's general signal of 'SELL' (2 Buy, 5 Sell) and the 4-hour chart's neutral signal (4 Buy, 4 Sell) also highlight the indecision prevalent across different timeframes. This period of consolidation can be frustrating for trend traders but can offer opportunities for range traders. It's crucial to monitor the volatility, as a breakout from such a range often leads to a sharp price movement in the direction of the breakout. The key levels to watch during consolidation would be the immediate support at $68.35 and resistance at $69.44. A break decisively outside this range, especially accompanied by increased volume and strong indicator confirmation, would signal the end of the neutral phase.
The Most Likely Path and What To Watch
Considering the confluence of technical indicators and prevailing market sentiment, the most probable scenario for WTI crude oil in the immediate short term appears to be a continued battle around the $69.44 resistance, with a significant risk of a bearish continuation if that level holds. The strong downtrend signal from the daily ADX (38.84) and the deeply oversold RSI (28.68) on the daily chart suggest that the current upward pressure might be a corrective move within a larger bearish trend. While the 1-hour chart offers some bullish signals, the higher timeframe indicators and the overall trend strength point towards caution. Therefore, I assign a higher probability to the bearish scenario, with a neutral consolidation phase being the second most likely outcome. The bullish breakout scenario, while possible, appears less probable without a significant shift in fundamental drivers or a clear break of the prevailing downtrend.
Probability Estimates:
Bearish Scenario: Rejection and Decline
60% ProbabilityNeutral Scenario: Range-Bound Trading
30% ProbabilityBullish Scenario: Upside Breakout
10% ProbabilityWhat I'm Watching This Week
My primary focus this week will be on how WTI crude oil reacts to the $69.44 resistance level. A failure to break decisively above this point, especially with increasing volume on the downside, would strongly validate the bearish thesis. I'll be closely monitoring the 1-day RSI and ADX for confirmation of a downtrend continuation. Key economic data releases, particularly those influencing global demand expectations and the US Dollar, will also be critical. Any signs of continued economic slowdown or a hawkish shift from major central banks could trigger a sell-off. Conversely, any positive geopolitical developments or unexpected supply constraints could provide the catalyst for a bullish breakout. The $68.35 support level on the 1-hour chart is the first line of defense for the bulls; a break below this could accelerate downside moves towards the 4-hour supports. Ultimately, patience will be key. Waiting for a clear signal, whether a confirmed breakout above resistance or a decisive move below support, will be more prudent than attempting to anticipate the market's next move in this uncertain environment.
Frequently Asked Questions: WTI Analysis
What happens if WTI fails to break above $69.44 resistance?
If WTI fails to break above $69.44, a rejection is likely, potentially leading to a decline towards the $68.35 support level on the 1-hour chart. The daily chart's strong downtrend signals, with an ADX at 38.84 and an oversold RSI at 28.68, suggest further downside is probable, targeting the $67.89 level on the 4-hour chart.
Should I consider buying WTI at current levels around $69.17 given the daily RSI is oversold?
Buying solely based on the daily oversold RSI at 28.68 around $69.17 carries significant risk, as the overall trend indicated by the daily ADX (38.84) remains strong and bearish. A more prudent approach would be to wait for a confirmed break above $69.44 resistance or a clear bounce from a lower support level like $67.89, with confirmation from other indicators.
Is the MACD signal on the 1-hour chart a buy signal for WTI at $69.17?
The 1-hour MACD shows negative momentum and is below the signal line, which is not a buy signal. While the general signal for the 1H timeframe is leaning towards 'BUY' (5 vs 3), this is contradicted by the MACD and the Stochastic indicator, which shows a bearish crossover. Therefore, relying solely on the MACD on this timeframe would be misleading.
How will cooling US labor market data affect WTI prices this week?
Cooling US labor market data, like the recent weaker NFP report, can dampen global demand expectations, potentially putting downward pressure on WTI crude oil prices. This could reinforce the bearish scenario by increasing fears of an economic slowdown, making it harder for WTI to break above the $69.44 resistance.
Technical Outlook Summary
| Indicator | Value | Signal | Interpretation |
|---|---|---|---|
| RSI (14) | 28.68 | Oversold | Daily chart RSI is deeply oversold, suggesting potential for a bounce, but trend remains bearish. |
| MACD Histogram | -0.28 | Negative | Daily MACD shows negative momentum, reinforcing the downtrend bias. |
| Stochastic | 12.61 / 12.75 | Oversold | Daily Stochastic is in oversold territory, indicating potential for a short-term reversal upwards. |
| ADX | 38.84 | Strong Trend | Daily ADX indicates a strong trend, which currently appears to be downwards. |
| Bollinger Bands | Middle Band | Below | Daily price is below the middle band, indicating bearish pressure. |
Track markets in real-time
AI-powered analysis, technical indicators and real-time price data.
Join Our Telegram Channel
Breaking market news, AI analysis and trading signals instantly.
Join Channel