This is where the real story unfolds for WTI crude. The chart is flashing warning signs, and frankly, the bulls might be running on fumes. We're staring down the barrel of $68.42, a level that's currently acting as a battleground, but the underlying technicals suggest this fight might be lost sooner rather than later. Having watched these markets for years, I've learned to pay close attention when indicators start whispering - and right now, they're practically shouting.
- RSI at 33.25 on the 1H chart signals significant bearish pressure, indicating potential further downside.
- Critical support for WTI sits at $68.28, tested multiple times and showing signs of weakening.
- The ADX at 38.27 confirms a strong downtrend, suggesting rallies are likely to be sold into.
- Goldman Sachs' forecast of a 2027 oil surplus adds a bearish fundamental layer to the technical picture.
The market sentiment surrounding WTI crude oil is currently a delicate balance, heavily influenced by both immediate technical signals and broader macroeconomic forecasts. At $68.42, WTI is navigating a critical juncture. The daily change shows a $-2.80% move, indicating significant selling pressure in the recent trading session. This downturn is not occurring in a vacuum; it's happening against a backdrop where major financial institutions like Goldman Sachs are projecting a substantial oil market surplus by 2027. This forward-looking supply glut narrative is a powerful bearish undertone that traders are increasingly factoring into their decisions, potentially capping any upside attempts and increasing the likelihood of further price erosion.
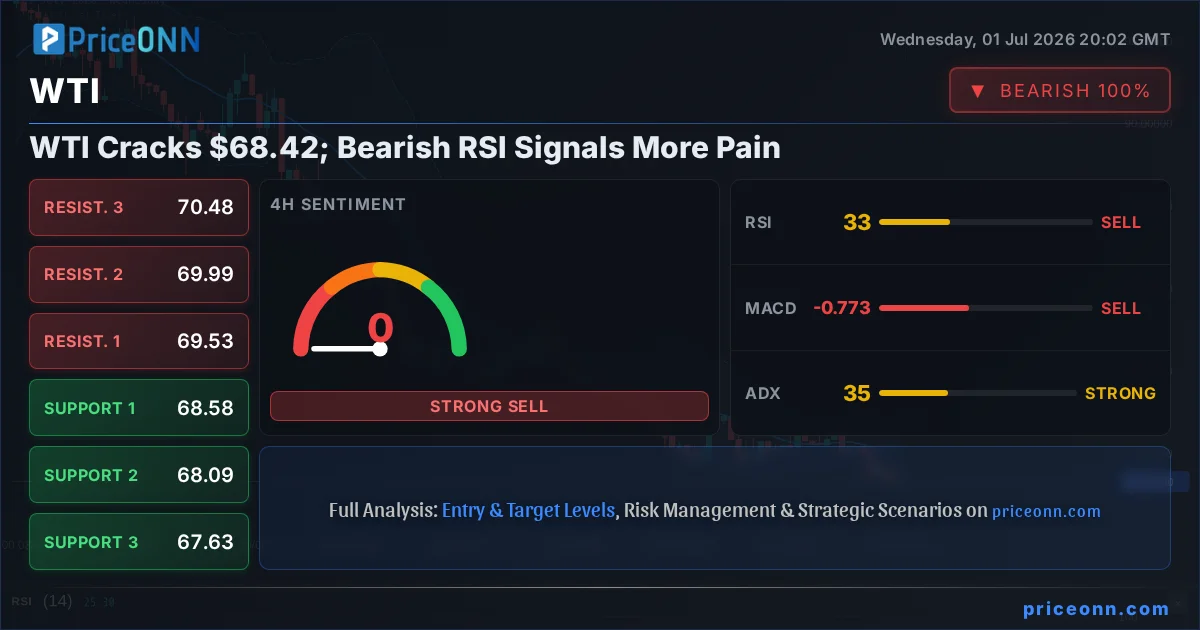
Looking at the 1-hour chart, the trend is unequivocally bearish, with a strength of 94%. This short-term outlook is painting a grim picture for immediate price action. The RSI(14) reading of 33.25 is deeply within oversold territory, but in a strong downtrend, this can often signal more room to fall rather than an imminent reversal. The ADX at 38.27 confirms a strong downtrend, reinforcing the idea that momentum is firmly with the sellers. Support levels are identified at $68.45, $68.28, and $67.99. A break below the immediate support at $68.45, which is the current price, would confirm the bearish sentiment, while a sustained move below $68.28 could trigger a more significant sell-off, targeting the next key level at $67.99.
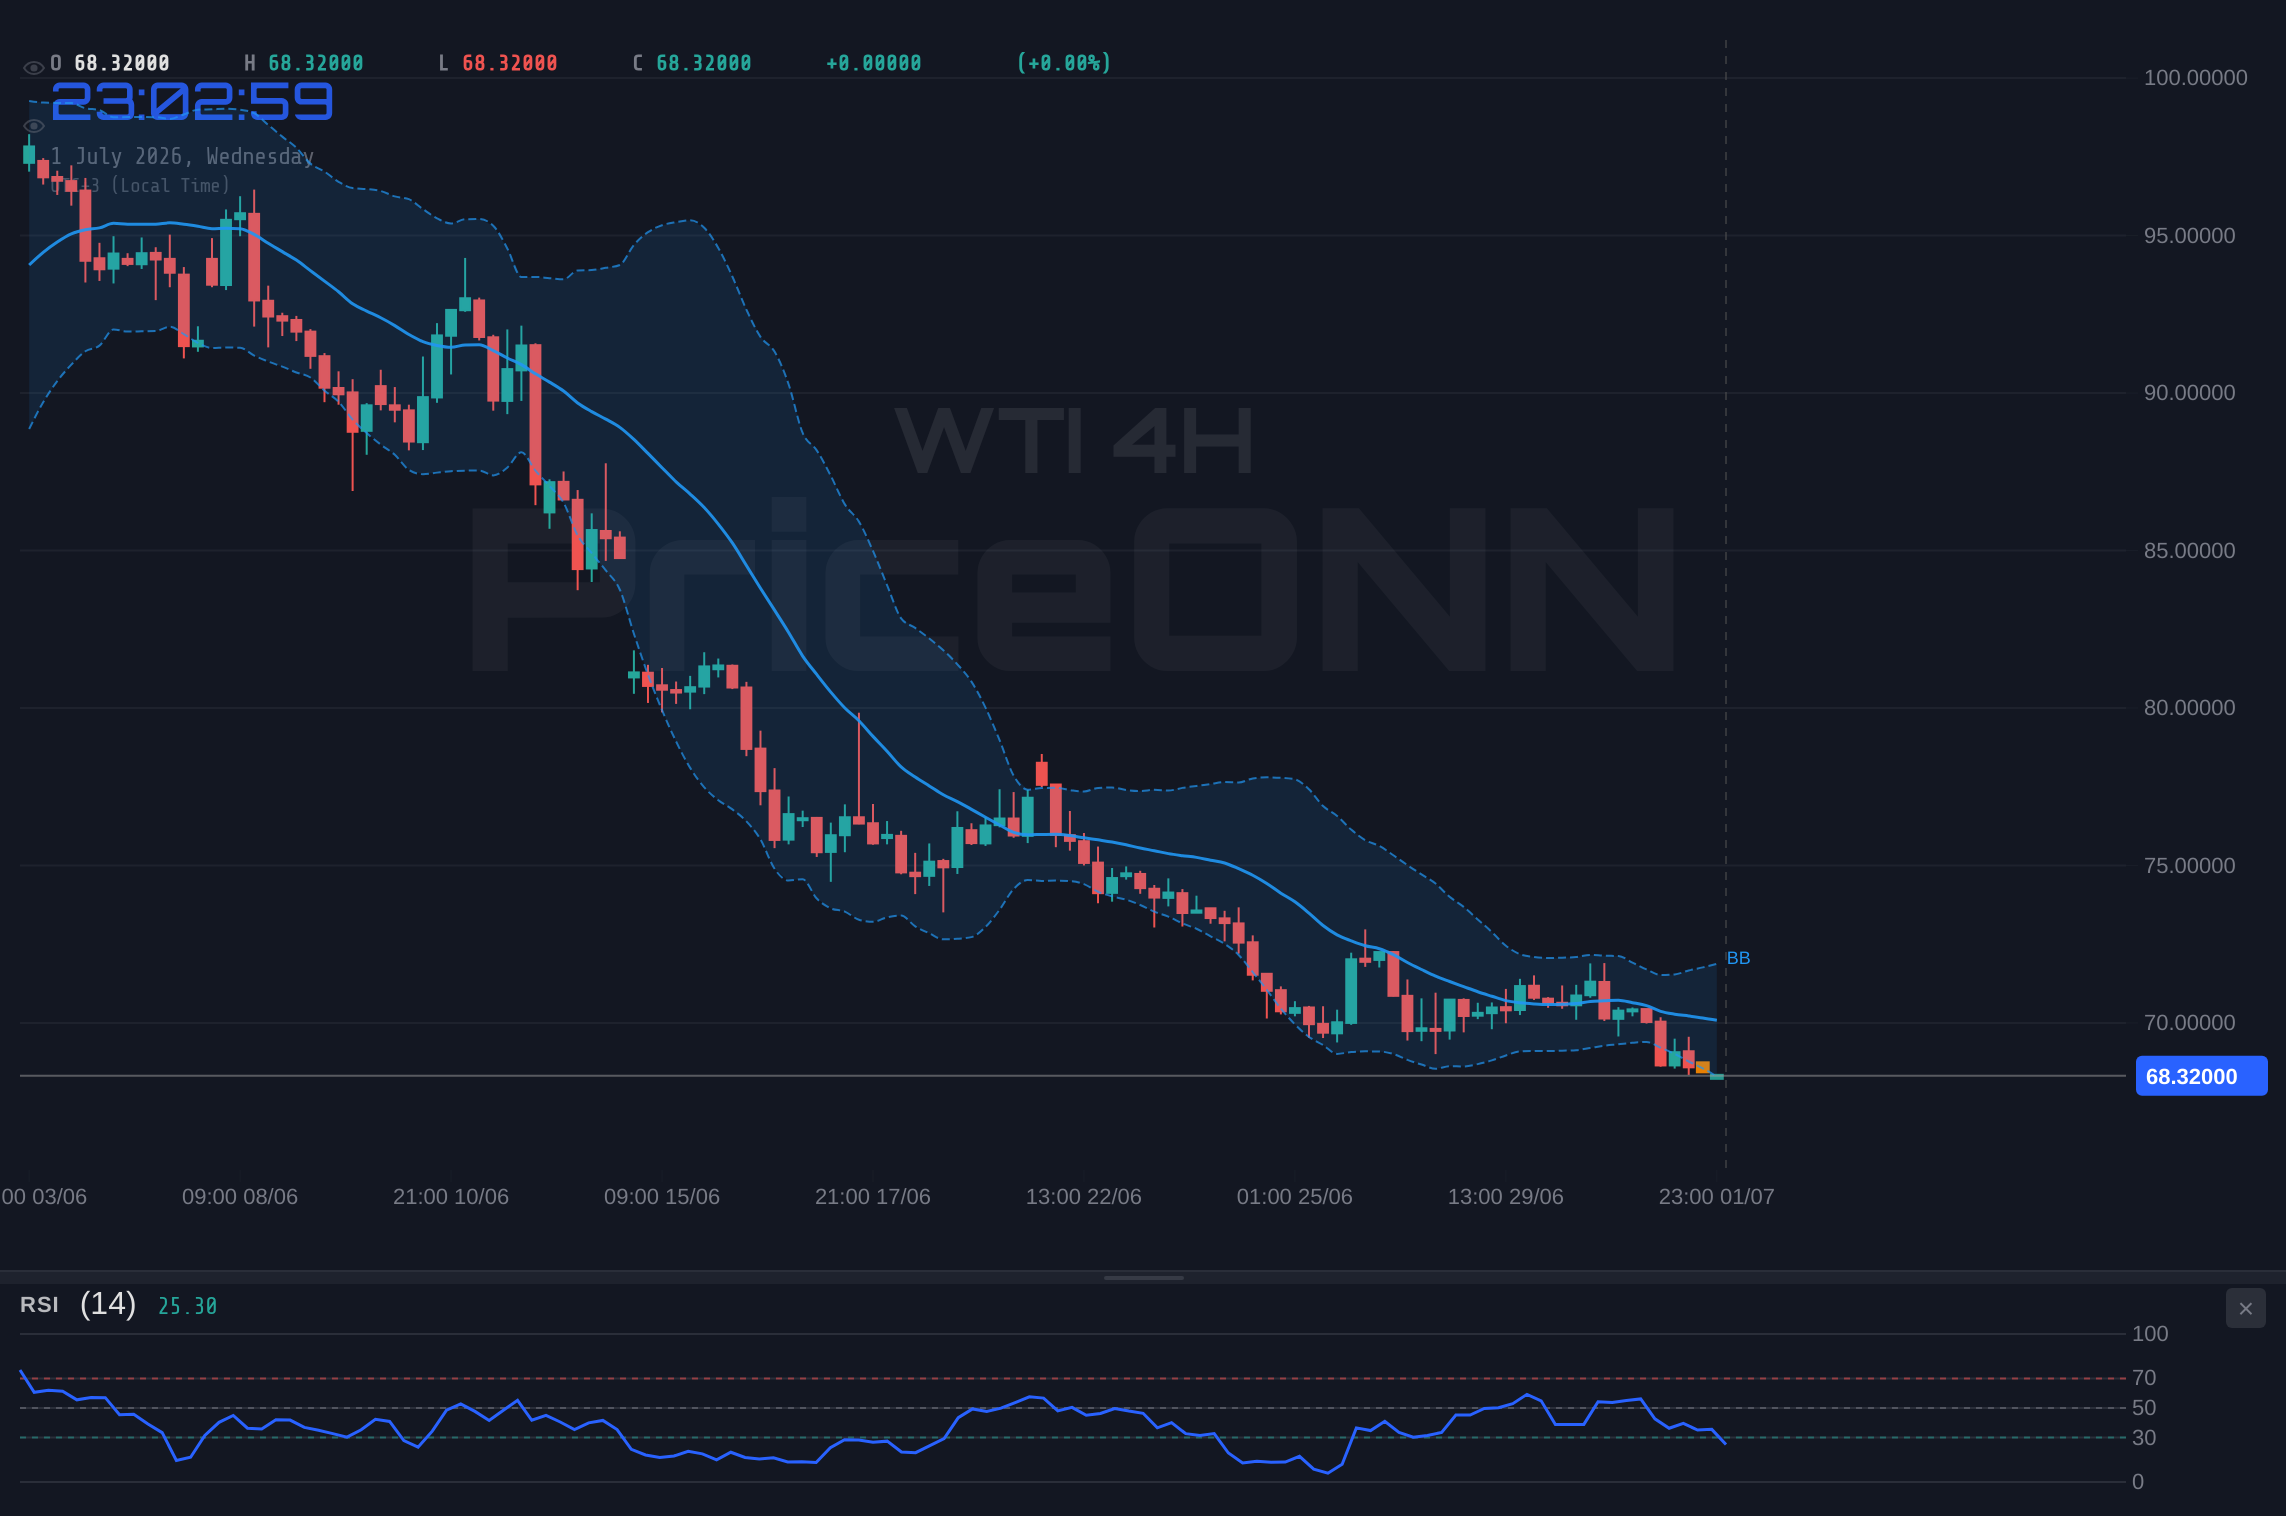
The 4-hour timeframe offers a slightly different, yet still predominantly bearish, perspective. Here, the trend is also classified as bearish with 100% strength. The RSI(14) is at 33.35, mirroring the 1-hour chart's oversold conditions and suggesting that the selling momentum remains intense. The ADX at 34.89 further solidifies the presence of a strong downtrend. Support levels on this timeframe are found at $68.58, $68.09, and $67.63. Resistance is noted at $69.53, $69.99, and $70.48. The fact that the price is currently trading below the $68.58 support level, which is the closest one on this chart, indicates that the bears are in firm control. The Stochastic indicator, with %K at 6.24 and %D at 23.16, is deeply oversold, but in a strong trend, this can persist for extended periods, offering little comfort to the bulls.
On the daily chart, the WTI trend is decidedly bearish, with a strength of 100%. The RSI(14) is at 26.53, firmly in oversold territory and suggesting significant downside exhaustion. However, as we’ve seen on shorter timeframes, oversold conditions in a strong downtrend are not a buy signal; they often precede further declines. The ADX at 39.63 indicates a very strong downtrend. Support levels are situated at $69.34, $68.29, and $70.23. Resistance is seen at $71.67, $72.95, and $74.00. The Stochastic K value at 10.91 and D value at 10.97 show extreme oversold conditions, but the consistent bearish signals across all timeframes point to a continuation of the downward move. The fact that the price is currently trading below $69.34, the first daily support, amplifies the bearish outlook.
The correlation with the US Dollar Index (DXY) is a crucial element to consider. With the DXY at 101.43 and showing a rising trend, it typically exerts downward pressure on commodities priced in dollars, such as oil. This inverse relationship suggests that as the dollar strengthens, WTI crude prices are likely to face headwinds. The current DXY strength, coupled with its upward trend across multiple timeframes, provides a fundamental tailwind for the bearish WTI outlook. Any further strengthening of the dollar could exacerbate the selling pressure on oil, making it harder for WTI to find sustainable footing above the current levels.
Furthermore, the recent news from Goldman Sachs regarding a projected oil market surplus in 2027 cannot be ignored. This forecast implies that even if current production levels remain stable, the market could be headed for an oversupply situation in the medium term. Such a scenario typically leads to lower prices as supply outstrips demand. While this is a longer-term projection, it influences market sentiment and can weigh on prices by discouraging speculative buying and encouraging short positions. This fundamental outlook aligns perfectly with the bearish technical signals we're observing across all timeframes for WTI.
The technical indicators on the 1-hour chart present a mixed bag, but the overall picture leans bearish. While the Stochastic (%K at 18.87, %D at 17.9) is oversold and showing a potential for a short-term bounce, the RSI at 33.25 and the strong ADX of 38.27 are more concerning for bulls. The MACD is showing negative momentum, and the price is trading below the middle Bollinger Band, indicating a bearish bias. The general signal is 'SELL', with 7 out of 8 indicators pointing downwards on the 1H timeframe. This suggests that any rallies are likely to be short-lived and met with selling pressure.
On the 4-hour chart, the technical signals continue to reinforce the bearish narrative. The RSI at 33.35 and ADX at 34.89 reiterate the strong downtrend. The Stochastic is deeply oversold, but as noted, this doesn't guarantee a reversal in a strong trend. The MACD is also negative, and the price is below the middle Bollinger Band. The 'SELL' signal is dominant here as well, with all indicators pointing towards further weakness. The support levels at $68.58 and $68.09 are key watch areas; a failure to hold these could accelerate the decline.
The daily timeframe's technical picture is stark. The RSI at 24.81 is deeply oversold, and the ADX at 39.63 signifies a very strong downtrend. The Stochastic readings of 10.91 and 10.97 are at extreme levels. Despite these oversold conditions, the prevailing trend is strongly bearish. The MACD is negative, and the price is below the middle Bollinger Band. The 'SELL' signal strength is high, with 6 out of 8 indicators suggesting a sale. This persistent bearish signal across multiple timeframes, from the hourly to the daily, indicates that the path of least resistance for WTI is currently downwards.
Considering the confluence of bearish technical signals across all timeframes, the negative sentiment driven by Goldman Sachs' surplus forecast, and the strengthening DXY, the outlook for WTI crude oil remains decidedly bearish. The current price of $68.42 is a critical level, and the increasing probability of breaking below immediate support at $68.28 suggests that further declines are likely. Traders should be cautious about looking for long opportunities at these levels, as the risk/reward may not be favorable given the strong downtrend and the potential for further downside.
The immediate price action around $68.42 is crucial. If selling pressure intensifies and WTI breaks decisively below the $68.28 support level, it could signal the start of a more significant leg down. This would likely be met with further selling as traders react to the breach of this key level and the continued bearish indicators. The risk of a cascading effect, where a break of support triggers further algorithmic selling and stops, is high in such a strong trend environment.
For those looking to trade this scenario, a bearish strategy seems more prudent. Shorting on rallies towards resistance levels, or entering on a confirmed break below support, could offer favorable risk-reward ratios. The key is to wait for clear confirmation rather than trying to catch a falling knife. The strong ADX values across timeframes suggest that the trend is well-established, and fading rallies or fading breaks of support would be the more tactical approach.
The current market environment demands a disciplined approach. While oversold indicators might tempt some to look for a bottom, the overwhelming evidence points to continued weakness. The confluence of a strong downtrend on daily charts, bearish momentum on intraday charts, and a strengthening dollar creates a challenging environment for oil bulls. The $68.42 level is a key pivot, and its failure to hold could open the door to significant price depreciation.
Bearish Scenario: Downside Momentum Continues
65% ProbabilityNeutral Scenario: Consolidation Around $68.42
25% ProbabilityBullish Scenario: Unexpected Reversal
10% ProbabilityFrequently Asked Questions: WTI Analysis
What happens if WTI breaks below the $68.28 support level?
A decisive break below $68.28 would likely confirm the bearish trend, potentially triggering further selling pressure. This could lead to a test of the $67.99 level, as highlighted in our bearish scenario.
Should I consider buying WTI at current levels near $68.42 given the oversold RSI?
Given the strong bearish trend indicated by ADX and consistent 'SELL' signals across timeframes, buying at current levels is risky. While RSI is oversold, it doesn't guarantee a reversal; a confirmed break above resistance would be needed for a bullish signal.
Is the RSI at 33.25 a reliable sell signal for WTI right now?
An RSI of 33.25 on the 1H chart indicates oversold conditions, but in a strong downtrend confirmed by ADX 38.27, it doesn't act as a primary sell signal. Instead, it suggests that the market is heavily weighted towards sellers, and rallies might be opportunities for short entries.
How will the projected 2027 oil surplus from Goldman Sachs affect WTI prices this week?
The surplus forecast adds a fundamental bearish layer to the technical picture, reinforcing the downward pressure on WTI. While it's a long-term outlook, it can influence current market sentiment, making traders more inclined to sell rallies and cap upside potential.
Technical Outlook Summary
| Indicator | Value | Signal | Interpretation |
|---|---|---|---|
| RSI (14) | 33.25 | Bearish | Oversold conditions, but trend remains down. |
| MACD Histogram | -0.68 | Bearish | Negative momentum persists. |
| Stochastic | %K: 18.87, %D: 17.90 | Bearish | Deeply oversold, but confirms downtrend. |
| ADX | 38.27 | Strong Trend | Confirms a strong downtrend. |
| Bollinger Bands | Below Middle Band | Bearish | Price action indicates bearish pressure. |
Key Levels
Support Levels
Resistance Levels
Track markets in real-time
AI-powered analysis, technical indicators and real-time price data.
Join Our Telegram Channel
Breaking market news, AI analysis and trading signals instantly.
Join Channel