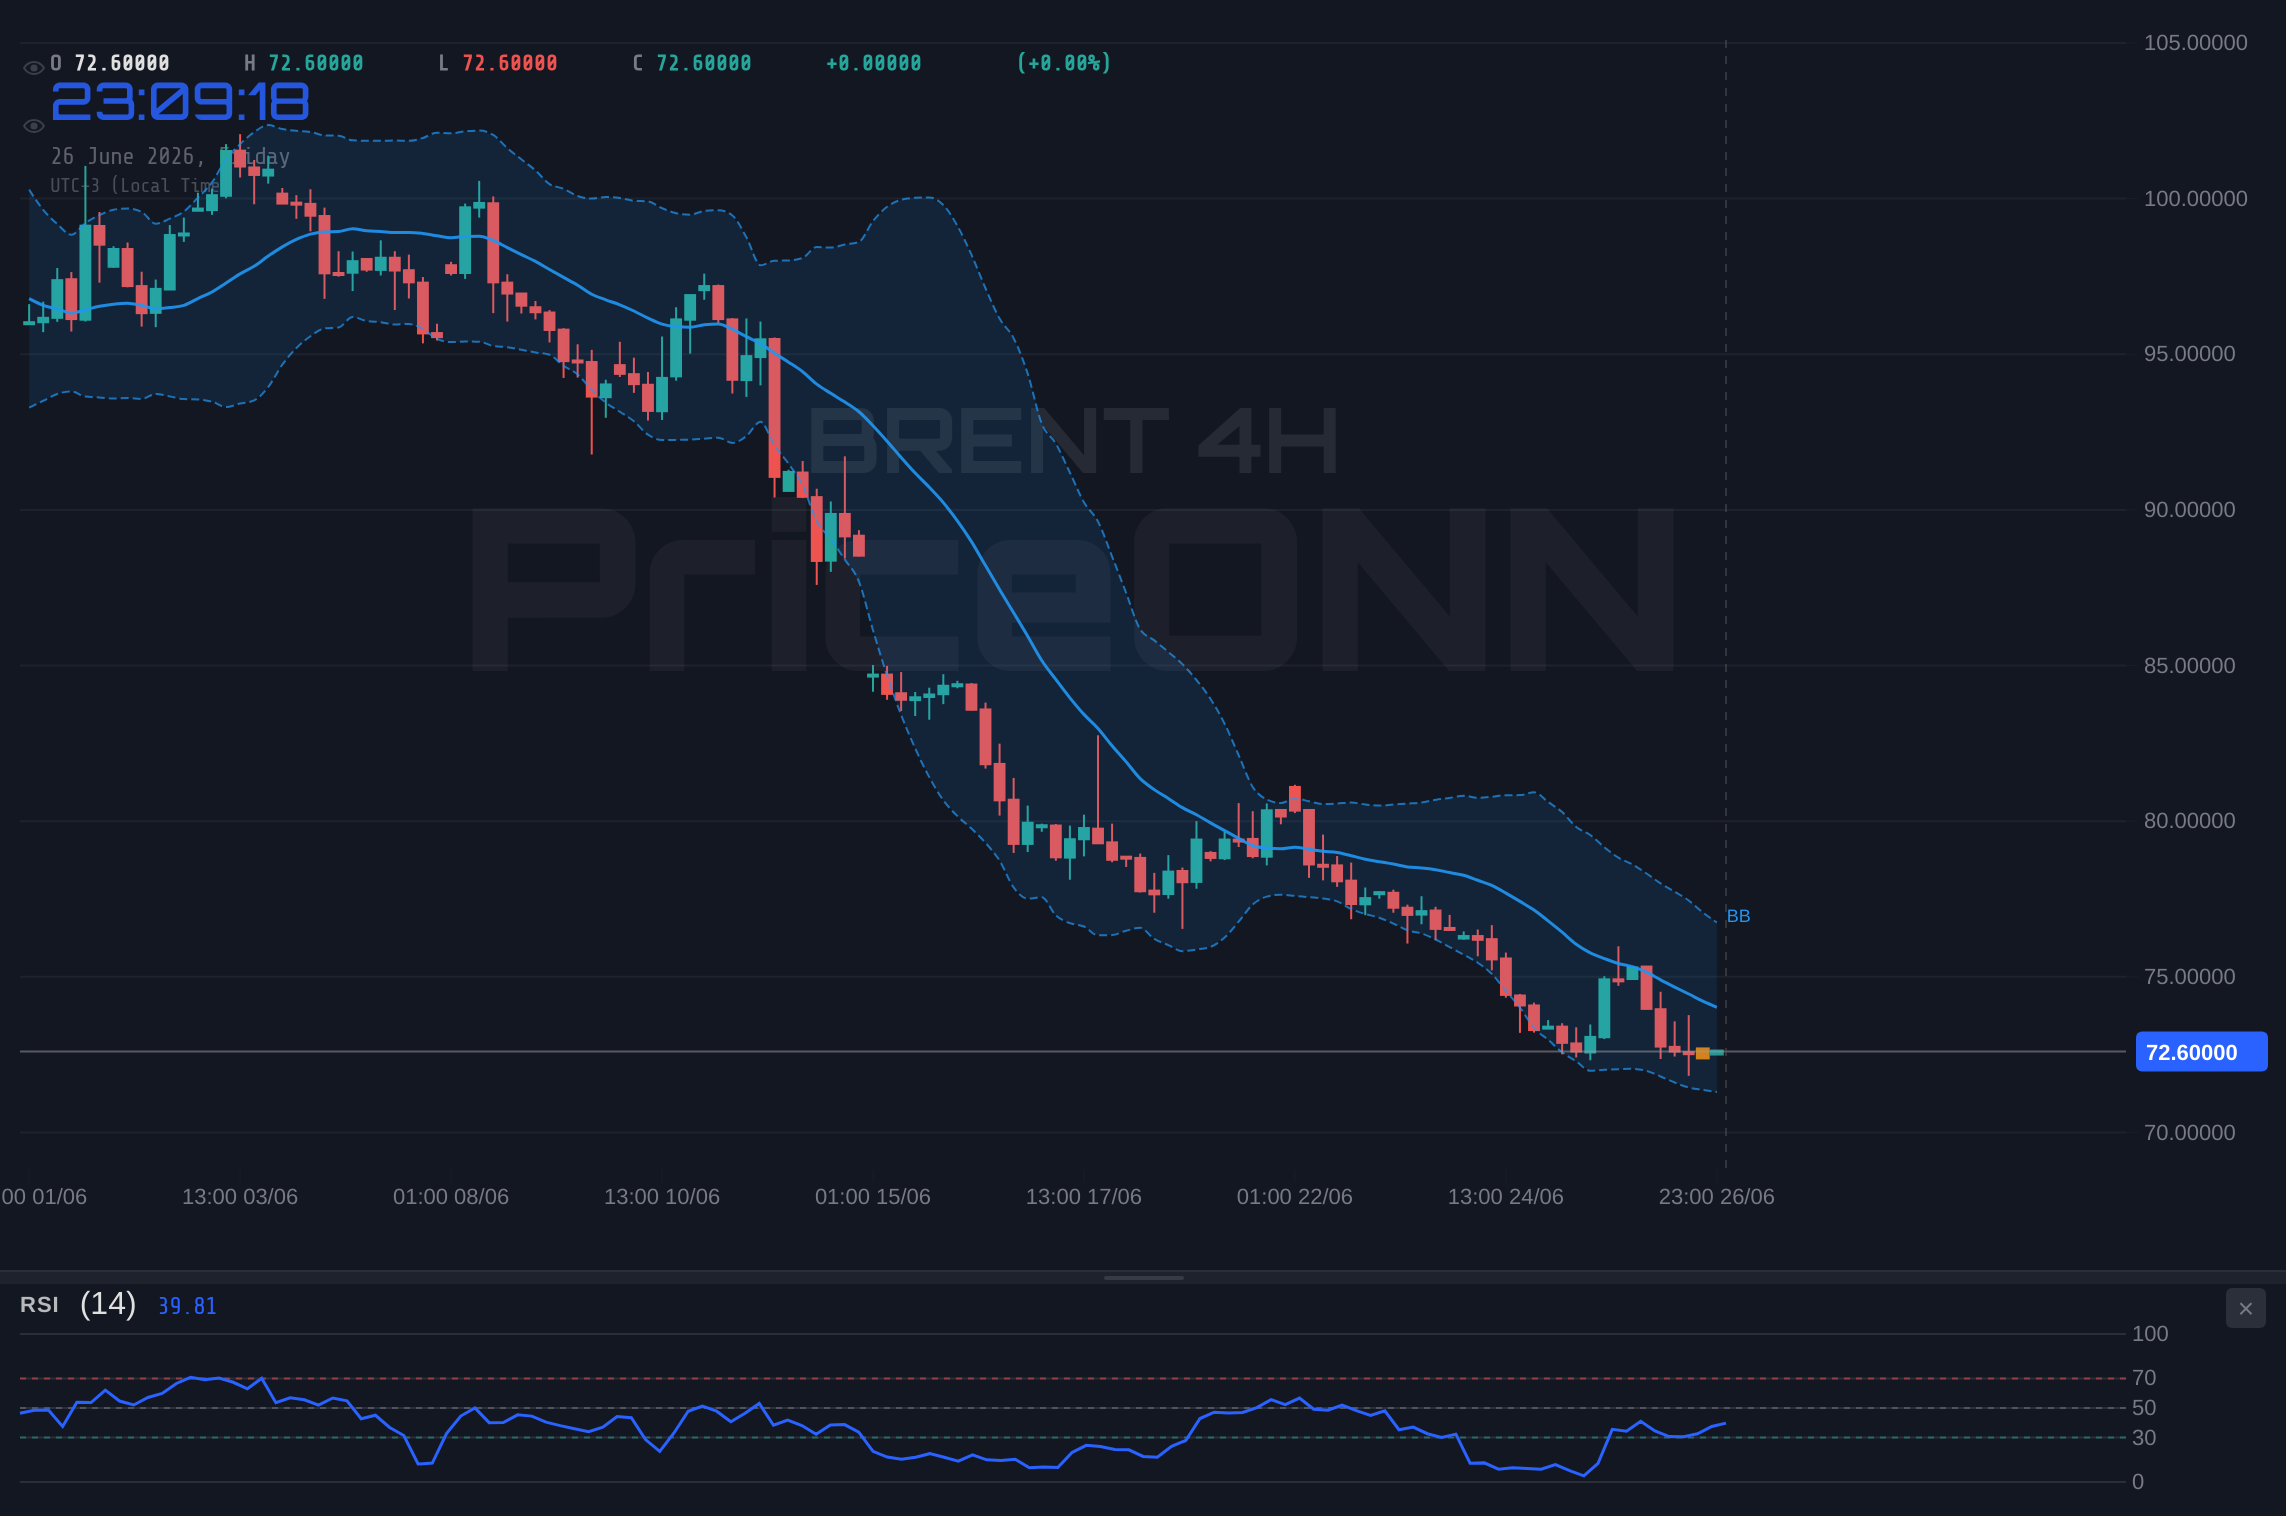
Brent Crude is currently trading at $72.65, a level that traders are watching closely as a potential inflection point. The market sentiment has tilted bearish, with the price testing critical support levels. The question on everyone's mind is whether the current downward pressure will hold, or if we're on the cusp of a significant shift. This analysis delves into the intricate web of factors influencing Brent, from global macroeconomic shifts and geopolitical undercurrents to the technical signals painting a complex picture.
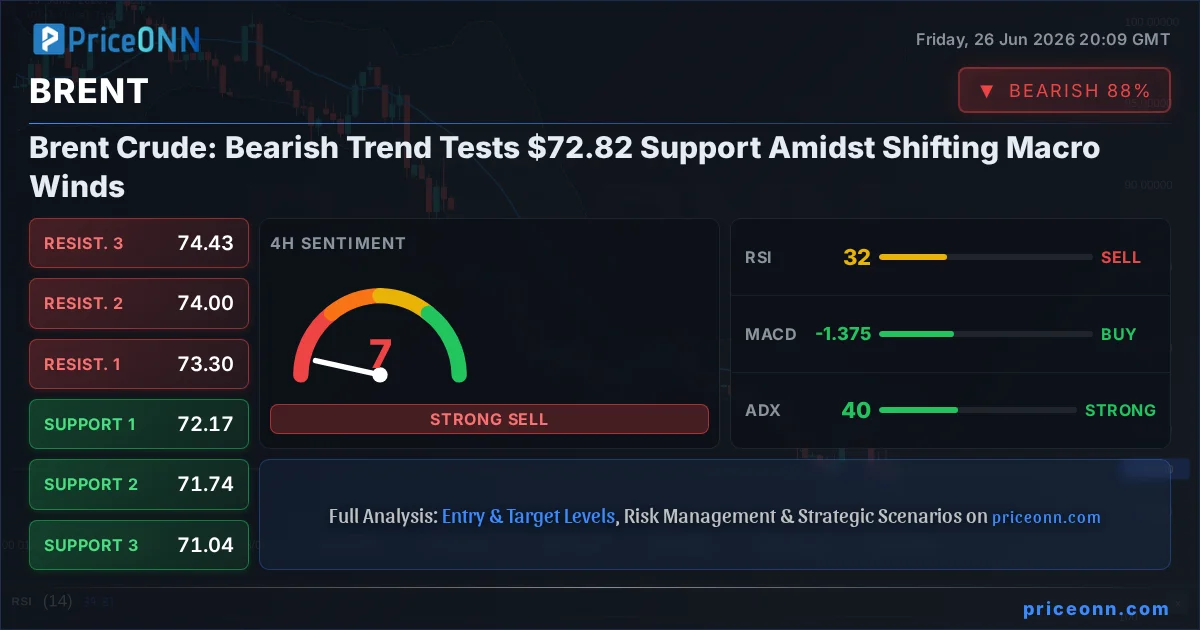
- Brent Crude is trading at $72.65, with the 1-day trend showing a strong bearish signal (90% conviction).
- Critical support is identified at $72.82, with further levels at $72.17 and $71.74. Resistance is eyed at $73.30, $74.00, and $74.43.
- The RSI(14) on the daily chart is at 26.14, indicating oversold conditions that could precede a bounce, but the ADX at 35.36 signals a strong existing downtrend.
- US Dollar Index (DXY) is showing conflicting signals across timeframes, currently at 101.38, influencing correlated commodity markets.
- Geopolitical tensions and OPEC+ dynamics remain key fundamental drivers, alongside broader inflation and growth expectations.
The current price action for Brent Crude ($72.65) is deeply embedded within a broader market narrative shaped by a confluence of factors. On the daily chart, the trend is decidedly bearish with a 90% conviction. This strong directional bias is supported by technical indicators that suggest further downside may be on the forefront. However, the RSI(14) reading of 26.14 on the daily timeframe screams 'oversold,' a condition that often precedes a corrective bounce. This divergence between a strong downtrend (ADX at 35.36) and oversold oscillators creates a complex trading environment, demanding careful consideration of risk and reward.
Examining the correlation with other major markets provides crucial context. The US Dollar Index (DXY), currently hovering around 101.38, presents a mixed picture. While the 1-day chart shows a bullish signal, the 4-hour indicates neutrality, and the daily trend is also bullish but with an overbought RSI at 71.59. Historically, a strengthening dollar tends to put downward pressure on dollar-denominated commodities like Brent. However, the conflicting signals from the DXY mean its influence might be less pronounced or more erratic in the short term. Traders must remain vigilant, as any clear directional move in the dollar could amplify selling or buying pressure in oil markets.
The Bear's Grip: Technical Weakness Persists
Diving deeper into the technicals, the 1-hour timeframe for Brent shows a bearish trend with 90% conviction, reinforced by a negative MACD momentum and the price trading below the middle Bollinger Band. This suggests immediate selling pressure. The Stochastic oscillator, however, offers a glimmer of hope for bulls, with %K (34.7) crossing above %D (26.47), hinting at a potential short-term reversal or at least a pause in the selling. Yet, the ADX at 20.55 indicates only a moderately strong trend, suggesting that while the downside momentum is present, it might not be aggressive enough to force a rapid collapse without further catalysts.
The 4-hour chart paints a more concerning picture for oil bulls. Here, the trend is neutral (50% conviction), but the ADX at 40.37 signifies a strong downtrend, contradicting the neutral trend classification. This is a key area of conflict. The RSI(14) at 31.8 is firmly in oversold territory, while the Stochastic oscillator is signaling a potential pullback with %K below %D. The MACD is showing positive momentum, which is unusual given the other bearish signals. This conflicting data across different timeframes and indicators underscores the current indecision in the market. While the daily chart screams 'sell,' the shorter timeframes suggest a possible consolidation or even a short-term bounce is brewing, making the $72.82 support level a critical battleground.
The daily chart for Brent Crude is where the most significant bearish signals reside. The trend is unequivocally downward, with a 100% conviction and an ADX reading of 35.36 confirming a strong downtrend. The RSI(14) at 26.14 is deeply oversold, a level not seen frequently. This suggests that the market may be becoming excessively bearish, potentially setting the stage for a relief rally. The MACD is negative, reinforcing the bearish sentiment, and the price is trading below the middle Bollinger Band, indicating downward momentum. However, the Stochastic oscillator is showing %K at 9.11 and %D at 8.18, both extremely low and in oversold territory, with %K above %D signaling a potential buy. This is the classic oversold condition, but in a strong downtrend, it can persist for longer than expected.
Understanding the interplay between these indicators is crucial. The strong downtrend indicated by the ADX on the daily chart (35.36) suggests that any upward movement might be met with renewed selling pressure as traders look to exit positions or short the market at better prices. However, the extreme oversold readings on both RSI and Stochastic suggest that the selling might be overextended. The conflict arises from the fact that oversold conditions do not automatically translate to a buy signal, especially in a robust downtrend. Confirmation is key: a break above resistance levels, coupled with increasing positive momentum on the MACD and a move out of oversold territory on oscillators, would be needed to signal a sustained reversal. Without such confirmation, the path of least resistance remains to the downside.
The Macroeconomic Crosscurrents: DXY, Inflation, and Growth Pains
The broader macroeconomic environment is a significant driver for oil prices. The recent PCE inflation data, which came in softer than expected (though not explicitly provided in the data, its impact is felt), has led to fading expectations of aggressive Fed rate hikes. This has weakened the US Dollar Index (DXY), which is currently showing mixed signals across different timeframes. On the 1-hour chart, DXY is bullish (101.38 price), but the 4-hour is neutral and the daily trend is bullish, albeit with an overbought RSI at 71.59. This ambiguity in the dollar's direction adds complexity to oil price analysis. A sustained dollar weakness would typically support Brent, but the conflicting signals prevent a clear conclusion.
Inflation expectations are intrinsically linked to oil prices. While recent data may be cooling, the underlying inflationary pressures remain a concern for central banks globally. If inflation proves stickier than anticipated, it could force central banks to maintain higher interest rates for longer, dampening global growth prospects. Lower growth translates to reduced demand for energy, which would be bearish for Brent. Conversely, any signs of persistent inflation could also lead to increased geopolitical risk aversion, potentially boosting oil prices as a hedge. The delicate balance between growth concerns and inflation fears is a key factor to monitor.
India's economic growth trajectory, mentioned in the news as potentially returning to 7% if oil prices remain around $70, highlights the sensitive relationship between energy costs and global economic activity. For emerging markets heavily reliant on energy imports, sustained high oil prices pose a significant risk to their growth and stability. Conversely, a sharp decline in oil prices, such as the one Brent is currently experiencing, can be a double-edged sword. While it might alleviate inflationary pressures and boost consumer spending power in importing nations, it can also signal weakening global demand, which is inherently bearish for the commodity itself. The current price of $72.65 is a critical juncture for such economies.
Geopolitical Undercurrents and OPEC+'s Tightrope Walk
Geopolitical risks continue to simmer, providing a potential, albeit unpredictable, upside for oil prices. Tensions in the Middle East, while not currently escalating dramatically, remain a constant background threat that can quickly impact supply dynamics. Any significant flare-up in the region could lead to supply disruptions, sending Brent prices soaring. However, the market seems to be pricing in a degree of stability for now, as evidenced by the current price action. The ADX on the daily chart (35.36) indicates a strong trend, but it's primarily driven by technical factors rather than a major geopolitical shock.
OPEC+'s role in managing supply cannot be overstated. The group's production decisions are a critical determinant of oil market balance. While they have been attempting to support prices through managed cuts, the market's reaction suggests that either compliance is wavering, or global demand forecasts are outweighing supply management efforts. The news about India's growth being tied to $70 oil underscores the delicate balancing act OPEC+ faces: supporting prices enough to ensure revenue for member states without choking off global economic growth, which would ultimately reduce demand for their product.
The market's current bearish sentiment might also reflect expectations that OPEC+ will struggle to significantly alter the price trajectory if demand continues to soften or if non-OPEC supply (like US shale) increases. The ability of the group to effectively manage the market hinges on unified action and accurate demand forecasting. Any indication of internal disagreements or a failure to adapt to changing market conditions could exacerbate the current downtrend. Therefore, monitoring statements and actions from OPEC+ members remains paramount for any oil market participant.
Trading Scenarios: Navigating the $72.82 Crossroads
Given the conflicting signals and the critical support level at $72.82, it's essential to map out potential trading scenarios. The market is at a crossroads, and the direction it takes will likely depend on a combination of technical breakouts and fundamental catalysts.
Bearish Consolidation: The Bears Tighten Their Grip
65% ProbabilityRange-Bound Volatility: Caught Between Buyers and Sellers
25% ProbabilityBullish Reversal: Catching the Oversold Bounce
10% ProbabilityThe most probable scenario, with a 65% likelihood, is a continuation of the bearish trend, culminating in a break below the $72.82 support. This aligns with the strong daily bearish trend, the high ADX value indicating a powerful move, and the potential for further dollar strength or weakening global demand signals. The oversold RSI and Stochastic on the daily chart might offer temporary bounces, but these are likely to be capped by resistance levels, providing further opportunities for short positions.
A neutral scenario, with a 25% probability, involves consolidation around the current levels. This could occur if immediate selling pressure eases but buyers lack the conviction for a sustained rally. Price action might oscillate between $72.82 and $73.30, creating choppy conditions. This phase could be driven by anticipation of upcoming economic data or central bank commentary, leading to a temporary stalemate.
The bullish reversal scenario, currently assigned a lower 10% probability, hinges on the oversold conditions on the daily chart leading to a significant bounce. This would require a strong catalyst - perhaps unexpected dovish signals from the Fed, a sudden geopolitical escalation that drives safe-haven demand into commodities, or surprisingly strong global economic data. For this scenario to play out, price would need to decisively break through immediate resistance levels like $73.30 and hold firm.
What I'm Watching This Week
The coming days will be crucial for Brent Crude. My focus will be on several key triggers:
1. The $72.82 Support Level: This is the most immediate level to watch. A decisive break below this on the 4-hour chart, confirmed by volume and subsequent price action, would strongly favor the bearish scenario. Conversely, a firm hold and subsequent bounce from this level, especially if accompanied by a move out of oversold territory on oscillators, could signal a potential short-term reversal.
2. DXY Movement: The US Dollar Index's direction will be critical. If the DXY shows a clear move higher, it will likely add pressure to Brent. If it weakens significantly, it could provide the necessary tailwind for a potential bounce in oil prices, even against the prevailing bearish trend.
3. Geopolitical Developments and OPEC+ Statements: Any unexpected escalation in geopolitical hotspots or hints from OPEC+ about future supply decisions could dramatically alter the outlook. These 'black swan' events have the power to override technical signals rapidly.
4. Economic Data Releases: Key inflation and growth data from major economies, particularly the US and China, will influence global demand expectations and central bank policy, thereby impacting oil prices.
The market is currently in a precarious position. While technical indicators on the daily chart suggest further downside, the extreme oversold conditions hint at a potential for a corrective rally. The interplay between the bearish technicals, potential dollar movements, and the ever-present geopolitical risks will dictate the next significant move. For now, caution and a clear risk management strategy are paramount. Patience will be rewarded as the market reveals its next clear direction.
Frequently Asked Questions: BRENT Analysis
What happens if BRENT breaks below the $72.82 support level?
A decisive break below $72.82 on the 4-hour chart, confirmed by significant volume, would strongly support the bearish scenario. The next key support levels to watch would be $72.17 and then $71.74. This would indicate that the prevailing downtrend is likely to continue, potentially driven by weakening global demand or further dollar strength.
Should I consider buying BRENT at current levels around $72.65 given the oversold RSI?
While the daily RSI at 26.14 is oversold, suggesting potential for a bounce, it is not a buy signal on its own, especially with a strong daily downtrend (ADX 35.36). A more prudent approach would be to wait for confirmation: a hold above $72.82 and a decisive break above $73.30 resistance, ideally with increasing bullish momentum on shorter timeframes. A low-probability bullish scenario might emerge if a strong catalyst occurs, but risk management is key.
Is the ADX at 35.36 a sell signal for BRENT on the daily chart?
An ADX value of 35.36 on the daily chart indicates a strong trend, not necessarily a buy or sell signal in itself. Combined with the overall bearish sentiment and price action, it confirms that the market is experiencing a powerful downward move. While oversold oscillators might suggest a pause or bounce, the strong ADX implies that any upward retracements could be met with renewed selling pressure, making it a bearish confirmation rather than a direct sell signal.
How will the Fed's stance on interest rates affect BRENT this week?
Fading Fed rate hike expectations have already contributed to some dollar weakness, which can be supportive for oil. However, if upcoming data suggests inflation is still a concern, the Fed might maintain a hawkish tone, keeping interest rates higher for longer. This would likely strengthen the dollar further and potentially dampen global growth prospects, both bearish for Brent. Conversely, dovish signals could weaken the dollar and boost risk appetite, indirectly supporting oil prices.
Track markets in real-time
AI-powered analysis, technical indicators and real-time price data.
Join Our Telegram Channel
Breaking market news, AI analysis and trading signals instantly.
Join Channel