The narrative surrounding WTI crude oil has shifted dramatically over the past week, moving from a posture of cautious optimism to one of increasing bearish sentiment. Last Friday's close saw WTI trading around $70.83, a level that now appears to be a critical pivot point. This shift isn't driven by a single event but rather a confluence of factors, including easing geopolitical tensions in key oil-producing regions, a normalization of shipping traffic, and a broader reassessment of global demand dynamics. As traders digest these developments, the technical indicators are beginning to align, painting a picture of potential downside ahead. This analysis delves into the macro factors influencing WTI, examines the technical signals, and outlines the key levels and scenarios to watch in the coming week.
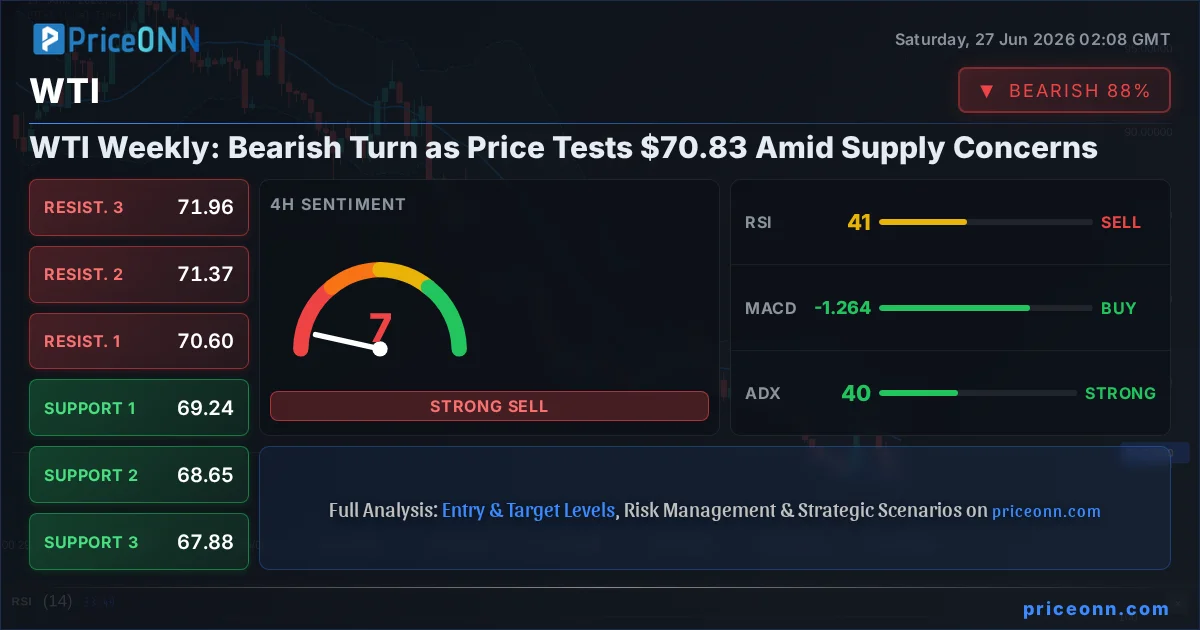
- WTI crude oil is trading at $70.83, showing a bearish turn with potential downside.
- Critical support is observed at $69.89, tested as the market sentiment shifts.
- RSI at 53.92 on the 1H chart signals neutral momentum, but the 1D chart shows RSI at 28.81, indicating oversold conditions that could precede a bounce if support holds.
- The ADX at 16.51 on the 1H chart suggests a weak trend, while the 1D ADX at 31.87 points to a strong downtrend, creating conflicting signals that demand careful observation.
- Concerns over Middle East supply disruptions are easing, impacting WTI's price correlation with geopolitical risk sentiment.
The past week has been a significant one for WTI crude oil, marked by a notable reversal from earlier gains. Having started the week with a degree of optimism, the market quickly turned defensive as supply risk premiums began to recede. The price action, culminating in a weekly close around the $70.83 mark, reflects this sentiment shift. This move is not occurring in a vacuum; it's intricately linked to broader market correlations, including the performance of the US Dollar Index (DXY), equity market sentiment, and evolving inflation expectations. Understanding these intermarket dynamics is crucial for grasping the full picture behind WTI's recent trajectory and its potential path forward. The narrative of tight supply, which had been a dominant theme, is now being challenged by signs of normalization in critical shipping lanes and a more measured outlook on global economic growth.
Shifting Geopolitical Tides and Supply Dynamics
One of the primary catalysts behind the recent pressure on WTI prices has been the perceived easing of supply risks, particularly emanating from the Middle East. For weeks, tensions in the region have been a significant driver of oil prices, with traders pricing in potential disruptions to crucial chokepoints like the Strait of Hormuz. However, recent reports suggest a normalization of traffic and a less immediate threat of supply interruptions. This de-escalation, even if temporary, significantly reduces the geopolitical risk premium that had been supporting crude prices. The market's reaction has been swift; as the fear of supply shocks diminishes, the price of oil tends to gravitate towards fundamental supply and demand factors, which appear to be less supportive of higher prices at the moment.
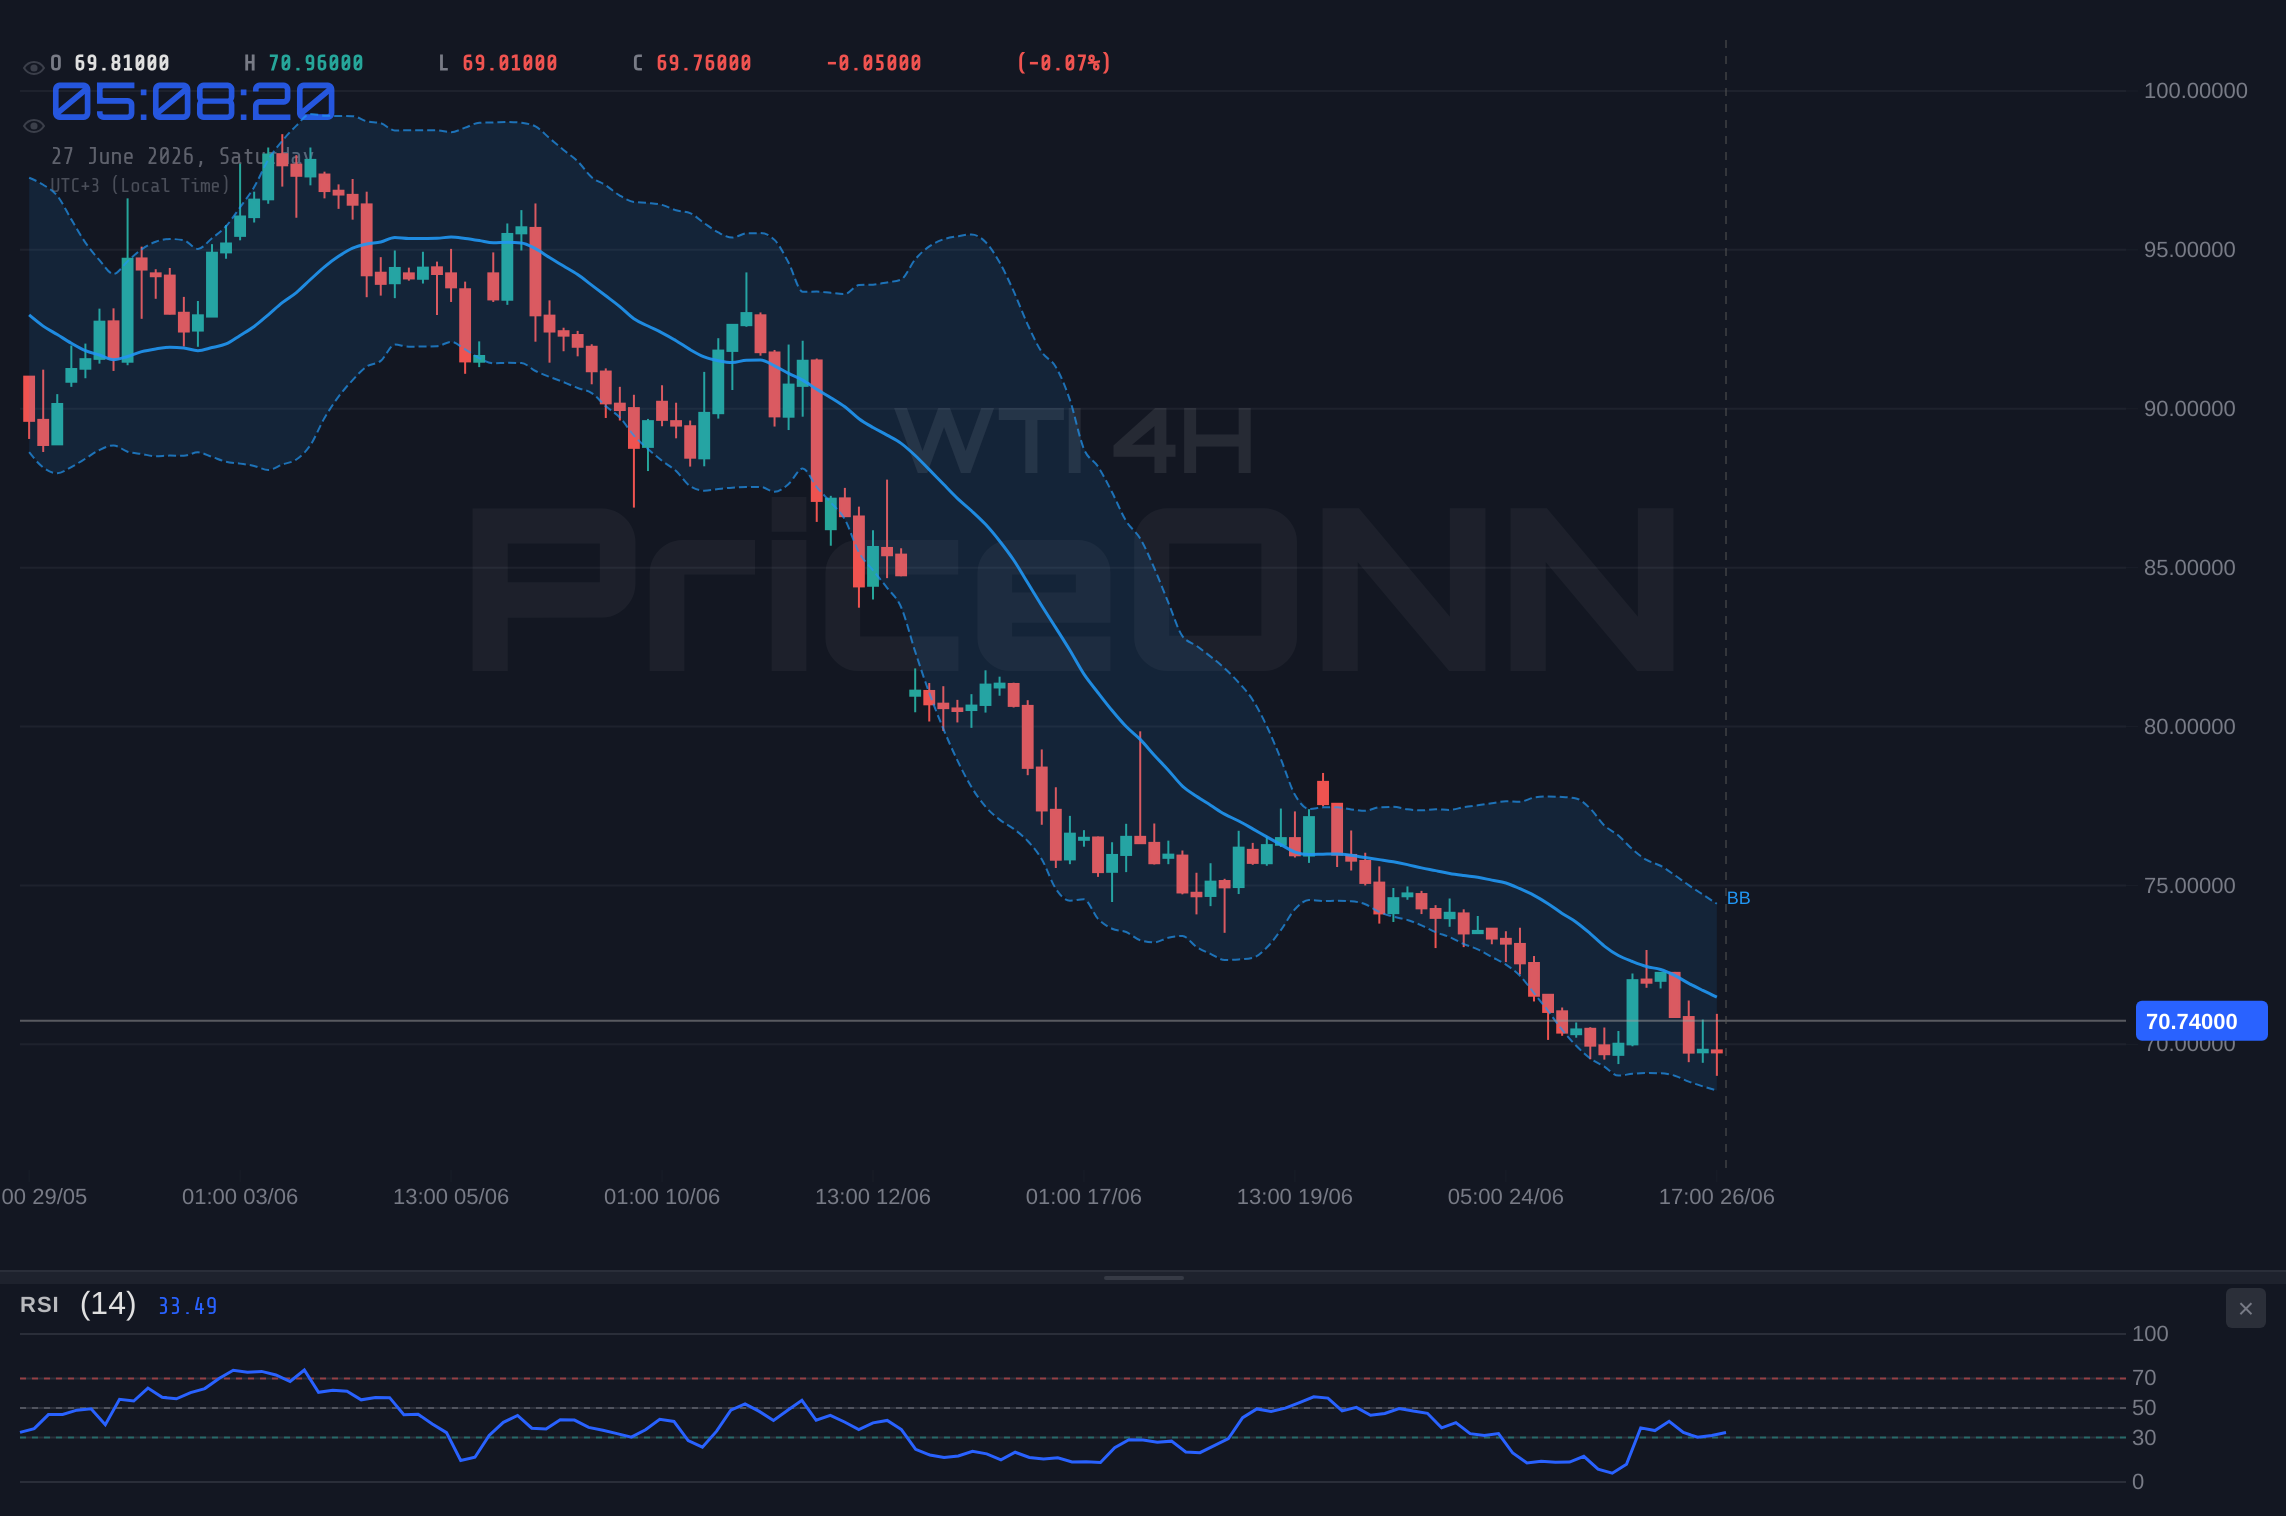
This recalibration of supply risk has direct implications for WTI's correlation with broader market indicators. When geopolitical risk is elevated, oil often acts as a barometer for global stability, and its price can move independently of traditional economic drivers. However, in a more stable environment, oil prices become more sensitive to factors like global economic growth, inventory levels, and production output. The recent price action suggests a return to this more fundamentals-driven phase, where the market is less concerned about immediate supply shocks and more focused on the underlying balance of the market. The news that Middle East export recovery is tempering supply risk concerns, as reported on June 26th, perfectly encapsulates this shift. This narrative change is critical for understanding the bearish turn we are witnessing.
The Dollar's Influence and Risk Sentiment
The movement of the US Dollar Index (DXY) remains a cornerstone of analysis for commodities like WTI. Over the past week, the DXY experienced a notable weakening, falling below 101.50 following the release of US PCE inflation data. This decline in the dollar is typically a supportive factor for oil prices, as a weaker dollar makes dollar-denominated commodities cheaper for holders of other currencies, potentially boosting demand. However, the correlation isn't always straightforward, and other factors can override this dynamic. In this instance, while the dollar weakened, WTI prices have also come under pressure. This suggests that the bearish sentiment in oil is strong enough to counteract the typical support offered by a weaker dollar, or that other dominant factors are at play.
The relationship between risk sentiment and oil prices is also worth noting. While WTI is often seen as a risk-on asset, its behavior can become more complex during periods of high geopolitical tension, where it can act as a safe-haven proxy. The current environment, characterized by easing geopolitical fears, suggests a return to a more traditional correlation where a decline in risk appetite, often signaled by weakness in equity indices like the S&P 500 and Nasdaq, could put further pressure on WTI. The news of the AI boom running out of power, while seemingly disconnected, hints at potential shifts in broader economic momentum that could eventually dampen oil demand. The fact that the DXY weakened below 101.50 after PCE inflation data, with Fed rate hike odds fading, provides a mixed signal. While a weaker dollar might typically support oil, the underlying economic concerns or the specific nature of the inflation data could be tempering this effect. Traders are closely watching the interplay between the dollar, risk appetite, and oil-specific supply-demand fundamentals.
Technical Indicators Signal Caution
On the technical front, the 1-hour chart for WTI currently presents a somewhat mixed picture, but the longer-term daily view leans bearish. The 1H chart shows the trend as neutral with moderate strength (87% on the trend indicator, but ADX at 20.13 suggesting a weak trend). The RSI(14) is at 53.92, sitting in neutral territory with a slight upward tendency, indicating no immediate overbought or oversold conditions. The MACD is showing positive momentum, with the MACD line above the signal line, and Bollinger Bands are trading above the middle band, suggesting a potential for upward movement in the short term. Stochastic oscillators, however, present a conflicting signal with K=52.82 and D=31.92, indicating a potential bullish signal. Despite these short-term signals, the overall composite signal leans towards 'BUY' (5 Buy, 3 Sell, 0 Neutral), but the weak ADX reading means any move might lack conviction.
The 4-hour timeframe paints a more cautious outlook. The trend is classified as neutral (50% strength), and while the RSI(14) at 40.57 suggests a downward inclination within the neutral zone, the MACD shows positive momentum. The Stochastic is K=22.84, D=45.36, giving a bearish signal, and the ADX at 40.38 indicates a strong downtrend. This timeframe's composite signal is predominantly 'SELL' (1 Buy, 7 Sell, 0 Neutral). This divergence between the 1-hour and 4-hour charts highlights the current choppy nature of the market. It suggests that while short-term fluctuations might offer brief buying opportunities, the underlying sentiment on a slightly longer timeframe is turning bearish, as indicated by the strong downtrend signal from the ADX.
The daily (1D) timeframe, however, offers the clearest bearish signal. The trend is decisively downward with 100% strength. The RSI(14) is at 28.81, firmly in oversold territory, which historically can precede a bounce but also confirms significant selling pressure. The MACD is in negative territory, below its signal line, indicating bearish momentum. Bollinger Bands are trading below the middle band, reinforcing the downtrend. The Stochastic K=12.12 and D=9.13 also show deep oversold conditions with a bearish signal. Crucially, the ADX on the daily chart stands at 31.87, confirming a strong downtrend. The overall signal for the daily timeframe is heavily skewed towards 'SELL' (2 Buy, 5 Sell, 0 Neutral). This confluence of bearish indicators on the daily chart, despite some short-term conflicting signals, strongly suggests that the path of least resistance for WTI is currently to the downside. The key support level to watch on this timeframe is $69.89, as highlighted in the weekly outlook.
Key Levels and Price Action Watchlist
As WTI crude oil navigates this complex market environment, specific price levels become critical reference points for traders. On the daily chart, the immediate support level is identified at $69.89. This level has significant psychological importance and has been flagged as a key area to watch. A decisive break below $69.89 would likely confirm the bearish sentiment and could trigger further selling pressure, potentially leading prices towards the next support at $67.84. The strong downtrend indicated by the ADX at 31.87 on the daily chart suggests that such a breakdown is a plausible scenario if market conditions deteriorate further.
Conversely, resistance levels need to be monitored closely for any signs of a potential reversal or consolidation. On the daily chart, the first significant resistance lies at $73.48. This level represents a barrier that must be overcome for any bullish argument to gain traction. If WTI can decisively break and hold above $73.48, it would signal a potential shift in momentum and could open the door for a move towards the next resistance at $75.02. However, given the prevailing bearish technical signals on the daily timeframe and the weakening DXY, breaking these resistance levels may prove challenging in the short to medium term without a significant catalyst. The current price of $70.83 sits precariously between these two key levels, highlighting the indecision and potential volatility ahead.
The 1-hour chart shows immediate resistance at $72.53 and support at $72.19. The 4-hour chart offers resistance at $73.30 and support at $72.17. These shorter-term levels are important for intraday trading but the daily levels at $69.89 (support) and $73.48 (resistance) are more critical for determining the weekly trend. The fact that WTI is currently trading at $70.83, closer to the support than resistance on the daily chart, adds to the bearish bias. Any upward movement towards $73.48 would be viewed with skepticism unless accompanied by strong bullish confirmation signals, such as a sustained break above key moving averages and a shift in momentum indicators.
Economic Calendar and Forward-Looking Events
The economic calendar for the upcoming week holds several key events that could significantly influence WTI prices. While specific dates for the next 7 days are not provided in the market data, general economic releases and central bank policy expectations are crucial. The recent PCE inflation data in the US, which saw the Dollar Index weaken, provides context. Further inflation reports, employment figures (like NFP), and GDP growth data will be closely scrutinized for their impact on global economic outlook and, consequently, oil demand. Any indication of a significant slowdown in major economies like the US, Europe, or China could dampen demand expectations and add further pressure on WTI.
Central bank policy, particularly from the Federal Reserve, remains a dominant theme. With Fed rate hike odds fading following recent inflation data, the market is grappling with the implications for monetary policy. Should the Fed signal a pivot towards rate cuts sooner than expected, it could stimulate economic activity and potentially boost oil demand. Conversely, if inflation proves more persistent than anticipated, forcing central banks to maintain a hawkish stance, it could lead to slower economic growth and weigh on oil prices. Traders will be particularly attuned to any forward guidance from Fed officials regarding inflation targets and the future path of interest rates. The interplay between inflation, monetary policy, and economic growth will be a key determinant of WTI's direction.
Geopolitical developments, though appearing to ease currently, remain a wildcard. Any resurgence of tensions in the Middle East, or unforeseen disruptions to major oil producers' output, could quickly alter the supply-demand balance and send prices sharply higher. The market's sensitivity to these events means that any news headlines originating from the region will be closely monitored. The June 22nd market news mentioning USD/JPY breaking above 161 after FOMC while WTI crude oil falls highlights how global macro events can influence commodity prices, even if indirectly. The ability of WTI to break its current bearish momentum will depend on whether supply concerns re-emerge or if demand-side factors strengthen significantly.
Market Sentiment and Intermarket Analysis
The prevailing market sentiment appears to be shifting towards a more risk-averse stance, which has broad implications for WTI. The recent news regarding the AI boom potentially running out of power, alongside the weakening of major indices like the Nasdaq (currently trading at 28998.91, down 1.54%), suggests a potential cooling of speculative fervor in riskier assets. This risk-off sentiment typically benefits safe-haven assets like the US Dollar and can put pressure on commodities like oil, which are more sensitive to global growth prospects. The correlation between WTI and the S&P 500 (currently at 6572.87, up 0.74%) is also something to monitor; a sustained downturn in equities could signal broader economic weakness impacting oil demand.
The DXY's recent dip below 101.50, while usually supportive for oil, is being overshadowed by other factors, indicating that the bearish narrative for WTI is robust. This suggests that the market is prioritizing concerns about global demand and easing supply risks over the traditional dollar-weaker-oil-stronger correlation. The price action of $70.83 for WTI is a reflection of this complex interplay. The fact that Brent crude (currently at $73.51, down 1.86%) is also experiencing a bearish turn reinforces the view that the weakness is not isolated to WTI but reflects broader trends in the energy complex. This widespread bearish sentiment, coupled with the technical signals on the daily charts for both WTI and Brent, suggests that further downside may be on the cards unless a significant bullish catalyst emerges.
The divergence in technical signals across different timeframes also contributes to the current market uncertainty. While the 1-hour chart might offer fleeting bullish signals, the more significant daily timeframe is clearly bearish. This implies that any short-term rallies are likely to be met with selling pressure as the broader trend asserts itself. The key for traders will be to observe how WTI reacts around the critical support level of $69.89. A failure to hold this level could accelerate the bearish move, while a strong bounce from here might indicate a temporary pause in the downtrend, potentially leading to a consolidation phase before the next directional move.
Trade Scenarios and Risk Management
Given the current market conditions and technical signals, a multi-scenario approach is prudent for navigating WTI crude oil. The prevailing sentiment leans bearish, supported by daily technical indicators and easing supply risk concerns. However, the mixed signals across different timeframes and the potential for geopolitical events to shift sentiment introduce uncertainty.
Bearish Scenario: Downside Breakout
65% ProbabilityNeutral Scenario: Consolidation Around $70.83
25% ProbabilityBullish Scenario: Reversal and Recovery
10% ProbabilityRisk management is paramount in this environment. The current price of $70.83 presents a critical juncture. For bearish positions, a tight stop-loss above the $72.19 resistance on the 1-hour chart, or more conservatively above $73.48, would be essential. For any potential bullish trades, entry confirmation above $73.48 is key, with stops placed below the $69.89 support. Given the strong downtrend signals on the daily chart (ADX at 31.87), the probability of the bearish scenario unfolding is higher. However, the oversold RSI on the daily chart (28.81) means that a short-covering rally or a bounce from support cannot be entirely ruled out. Traders should remain vigilant for any news catalysts that could rapidly shift market sentiment, such as unexpected geopolitical developments or major shifts in central bank policy expectations.
The oil market remains sensitive to geopolitical events and shifts in global economic outlook. Unexpected news from the Middle East or significant changes in central bank policy could lead to rapid price volatility. Always employ robust risk management strategies and consider position sizing carefully.
Frequently Asked Questions: WTI Analysis
What happens if WTI breaks below the $69.89 support level?
If WTI breaks decisively below the $69.89 support level, it would likely confirm the bearish sentiment observed on the daily charts. This could trigger further selling pressure, potentially pushing prices towards the next significant support at $67.84, and even towards $66.30. The ADX at 31.87 on the daily chart suggests that a strong downtrend could accelerate from this point.
Should I consider buying WTI at current levels around $70.83 given the oversold RSI on the daily chart?
While the daily RSI at 28.81 does indicate oversold conditions, suggesting a potential for a bounce, it is not a direct buy signal on its own. The strong bearish trend indicated by the daily ADX at 31.87 means that buying at current levels carries significant risk. A more prudent approach would be to wait for confirmation, such as a sustained break above the $73.48 resistance or a clear bullish divergence forming on lower timeframes, before considering long positions. The probability of a bounce from current levels is estimated at 10% in the current setup.
Is the RSI at 53.92 on the 1-hour chart a sell signal for WTI right now?
An RSI reading of 53.92 on the 1-hour chart is considered neutral territory and does not inherently act as a sell signal. It indicates that momentum is neither strongly bullish nor bearish at this very short-term timeframe. While the broader daily trend is bearish, this neutral RSI suggests that intraday trading might see some fluctuations. Traders should look for confluence with other indicators or price action patterns to make short-term trading decisions.
How might the easing of Middle East supply risk concerns affect WTI prices this week?
The easing of Middle East supply risk concerns has been a key factor contributing to the bearish turn in WTI prices. This reduces the geopolitical risk premium that had been supporting oil. If these concerns continue to recede, it removes a significant bullish catalyst, allowing fundamental factors like global demand and OPEC+ production decisions to take greater precedence. This could keep downward pressure on WTI, especially if demand growth forecasts remain subdued.
Technical Outlook Summary
| Indicator | Value | Signal | Interpretation |
|---|---|---|---|
| RSI (14) | 28.81 | Oversold | Daily chart shows extreme selling, potential for bounce but trend is down. |
| MACD Histogram | -ve | Bearish | Negative momentum on daily chart confirms downtrend. |
| Stochastic | K:12.12, D:9.13 | Bearish | Deep oversold conditions on daily, but trend remains down. |
| ADX | 31.87 | Strong Trend | Daily ADX confirms a strong downtrend is in place. |
| Bollinger | Lower Band | Breakdown | Price trading below lower band on 1D suggests strong bearish pressure. |
Track markets in real-time
AI-powered analysis, technical indicators and real-time price data.
Join Our Telegram Channel
Breaking market news, AI analysis and trading signals instantly.
Join Channel