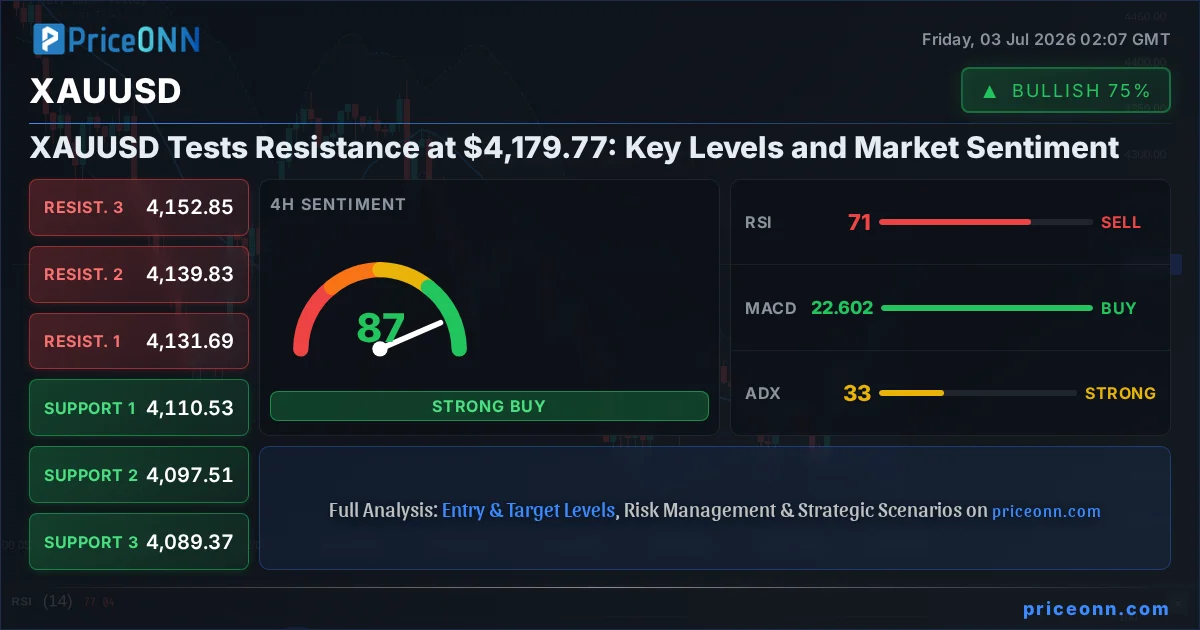
The relentless ascent of gold has brought XAUUSD to a critical juncture, currently trading around the significant psychological and technical mark of $4,179.77. This level represents not just a price point, but a battleground where bullish momentum confronts formidable resistance. As traders and investors digest the latest market data, the question on everyone's mind is whether gold can push through this barrier or if a correction is imminent. This analysis delves into the intricate interplay of technical indicators, macroeconomic drivers, and intermarket correlations to decipher gold's next probable move, offering a comprehensive outlook for this pivotal moment in the precious metals market.
- RSI at 76.16 on the 1H chart signals overbought conditions, suggesting potential for short-term selling pressure.
- Critical resistance is forming around $4,185.48, a level that must be decisively broken for further upside.
- The DXY's current dip to 100.85 provides some tailwind for gold, but its longer-term trend remains a key factor.
- A strong trend is evident on the 1H chart with ADX at 38.71, but the daily timeframe shows a neutral stance, indicating potential consolidation.
The narrative surrounding gold's recent surge is multifaceted, driven by a complex web of global economic concerns and shifting monetary policy expectations. While a weakening Dollar Index (DXY), currently around 100.85, typically provides a supportive backdrop for dollar-denominated assets like gold, the broader market sentiment is far from uniform. Equities, represented by the SP500 and Nasdaq, are showing mixed signals. The SP500, trading at 6572.87, is in a technical uptrend on the 1H and 4H charts, but the daily timeframe presents a bearish picture, indicating underlying weakness or potential overextension. Similarly, the Nasdaq 100, currently at 29445.26, shows a bearish sentiment on lower timeframes, suggesting that risk appetite might be waning. This divergence creates an uncertain environment, where safe-haven assets like gold could see increased demand if risk-off sentiment prevails, or face selling pressure if inflation concerns, often linked to rising commodity prices, begin to dominate. The interplay between these forces is crucial for understanding gold's current position at $4,179.77.
Navigating the Gold Rush: Technical Signals at $4,179.77
On the 1-hour timeframe, gold presents a picture of strong bullish momentum, with the trend strength pegged at an impressive 99%. The ADX stands at 38.71, confirming a robust upward trend, while the RSI hovers in overbought territory at 76.16. This suggests that while the bulls are firmly in control, the market is becoming overheated, potentially setting the stage for a short-term pullback or consolidation. The MACD is also showing positive momentum, sitting above its signal line, further reinforcing the bullish sentiment. However, the immediate resistance levels at $4,157.59, $4,168.13, and crucially $4,185.48, are the immediate hurdles that gold must overcome to sustain its upward trajectory. The daily chart, however, paints a more cautious picture. With an RSI of 46.85, it sits in neutral territory, leaning towards a bearish inclination, and the ADX at 41.15, despite being strong, is showing a *downward* trend in this timeframe. This discrepancy between the short-term bullish surge and the daily neutral-to-bearish undertone highlights the current indecision and the critical nature of the $4,179.77 price level.
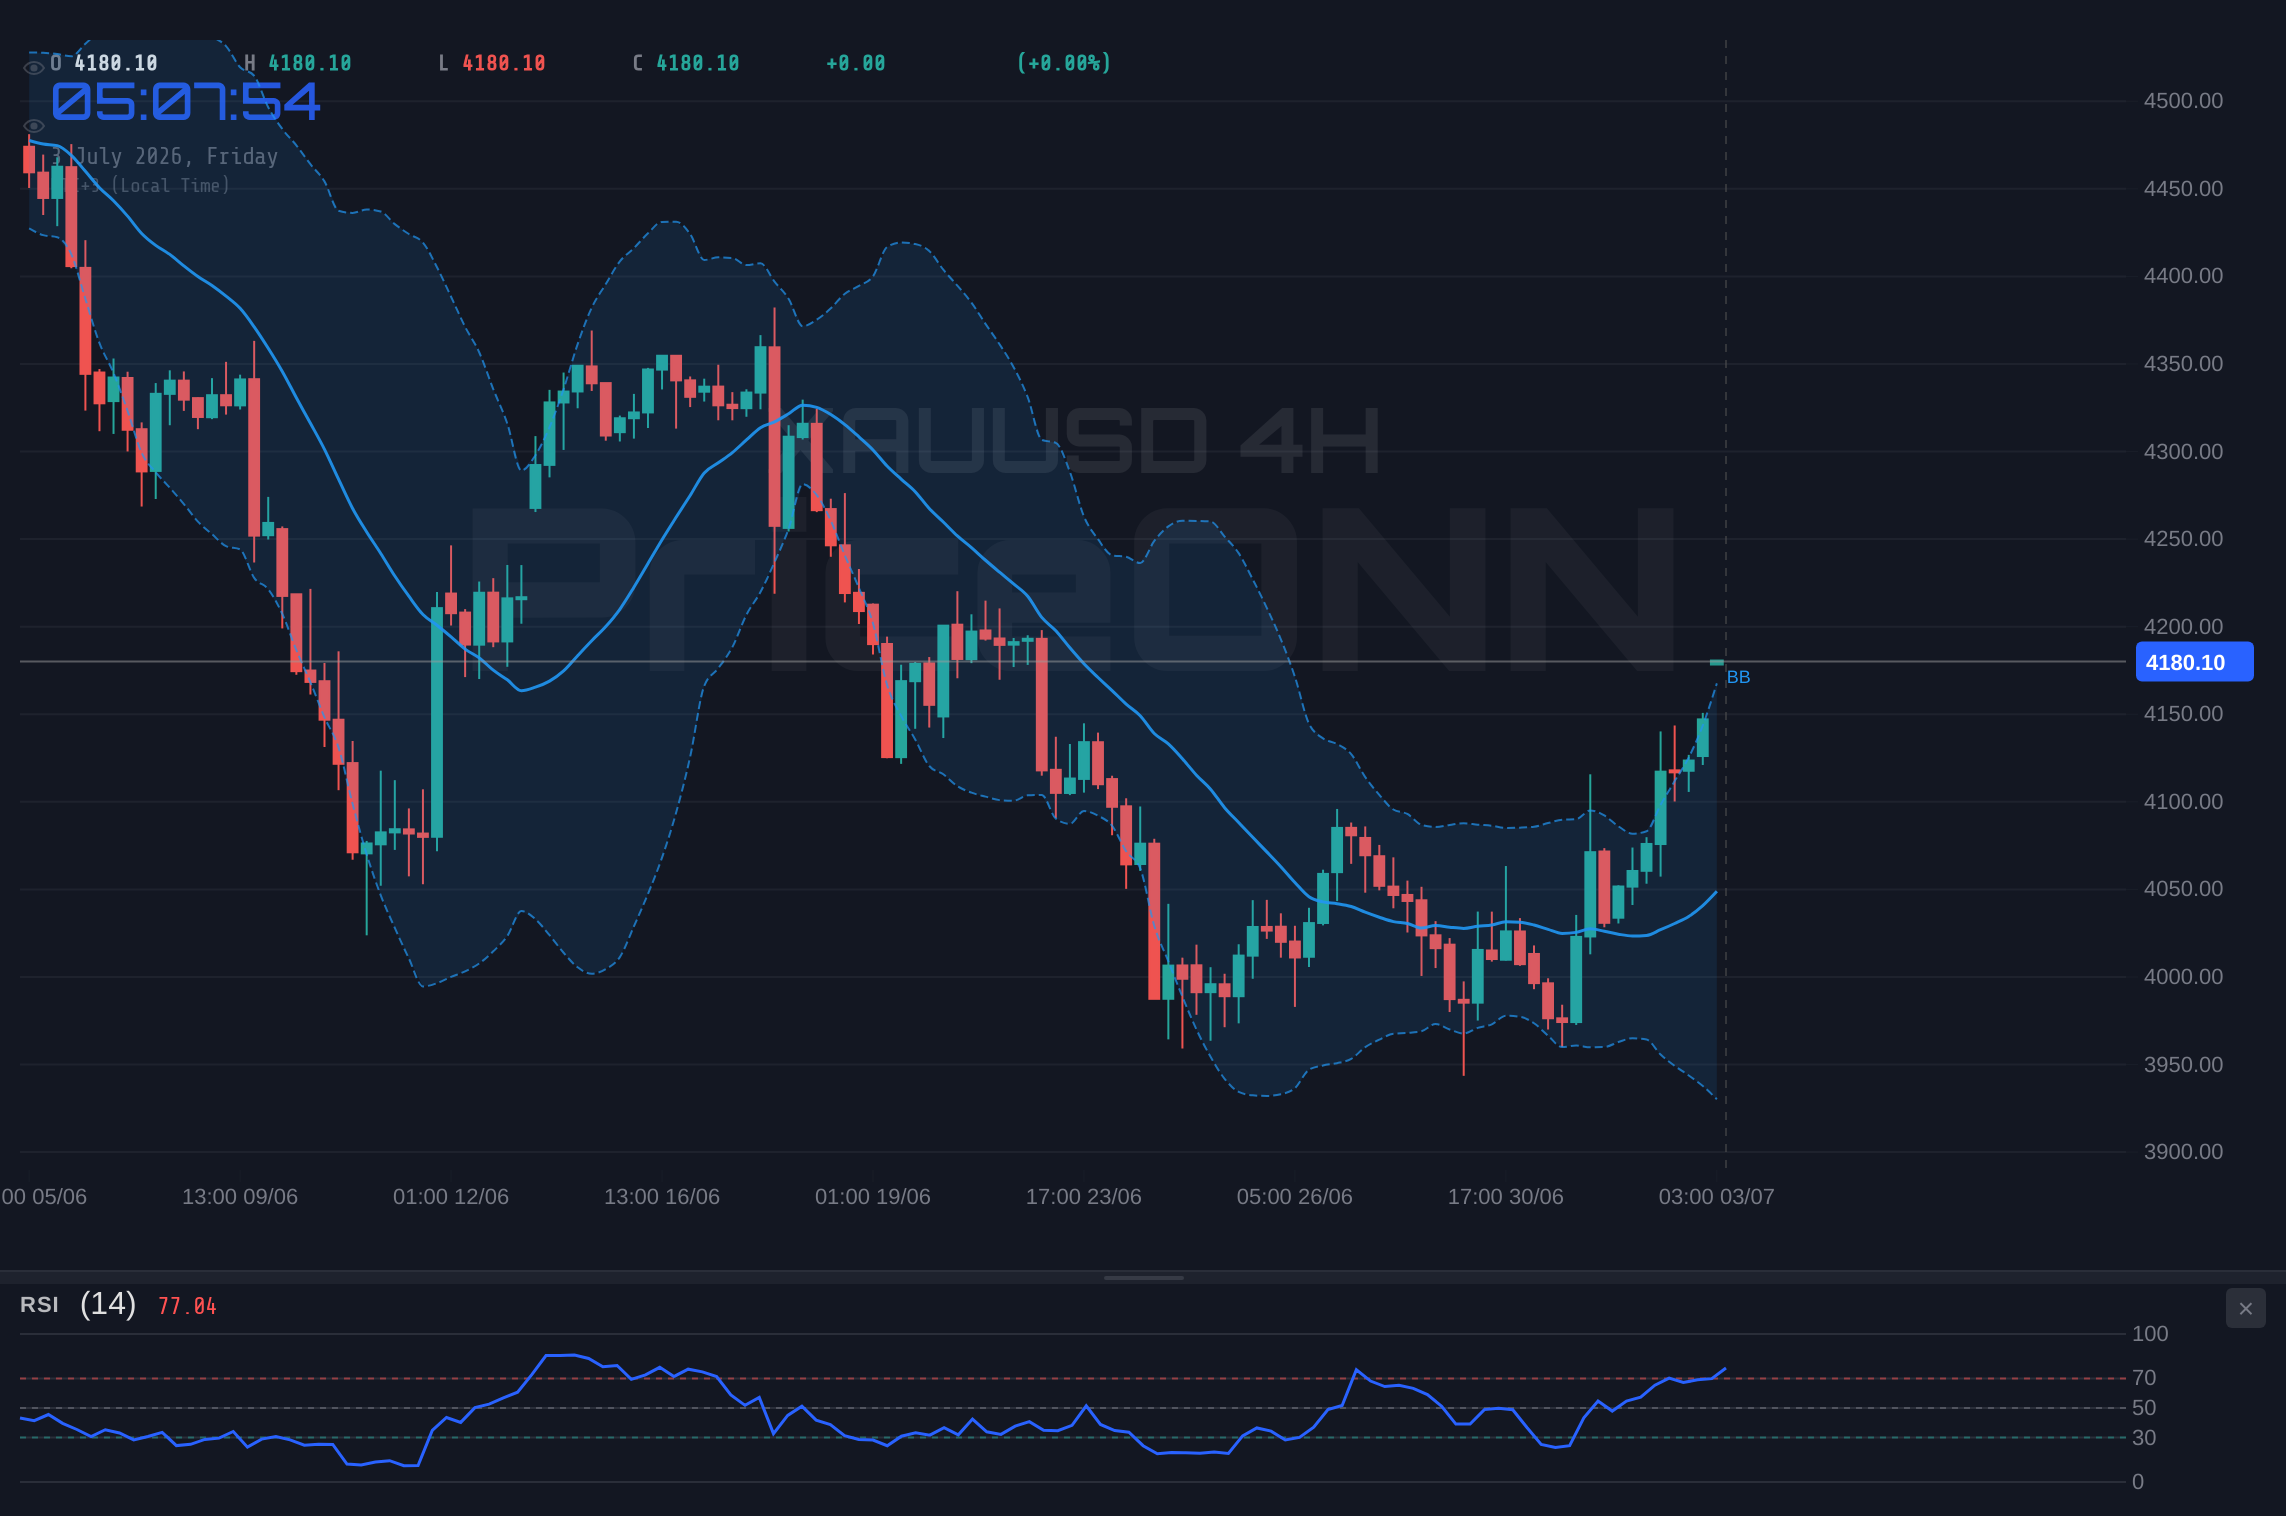
The 4-hour chart for XAUUSD offers a slightly more balanced perspective, showing a neutral trend with 50% strength. The RSI here is at 70.74, still firmly in overbought territory, hinting at potential exhaustion. The Stochastic Oscillator, with K at 91.44 and D at 76.47, is in extreme overbought conditions, signalling that a reversal or at least a pause could be on the cards. While the MACD remains positive, the ADX at 32.73 still indicates a strong trend, albeit less dominant than on the 1-hour chart. The key support levels to watch on this timeframe are $4,110.53, $4,097.51, and $4,089.37. These levels will be crucial in determining whether the current ascent is sustainable or if profit-taking will lead to a deeper retracement. The Bollinger Bands are also showing the price above the upper band, a common signal for overbought conditions or potential continuation of a strong trend. The conflicting signals across different timeframes emphasize the need for traders to exercise caution and wait for clearer confirmation before committing to large positions.
Looking at the broader daily timeframe, the picture for gold becomes more nuanced. The trend is officially neutral, reflecting a market in equilibrium between buyers and sellers, with a 50% strength rating. The RSI at 46.85 is comfortably in the neutral zone, showing no immediate signs of extreme overbought or oversold conditions, though it does indicate a slight downward bias. The MACD, however, shows positive momentum with the MACD line above its signal line, suggesting underlying strength. The Bollinger Bands are trading above the middle band, indicating an upward bias on this longer timeframe. The Stochastic Oscillator, with K at 44.49 and D at 23.09, shows a bullish signal, with the %K line above the %D line, suggesting potential for upward movement. Yet, the ADX is a significant outlier here, standing at 41.15 and indicating a strong *downward* trend. This stark contrast between the MACD and Stochastic suggesting bullishness, and the ADX indicating a strong downtrend, underscores the complexity of the current market environment. It suggests that while short-term momentum might be positive, the longer-term trend could be shifting, or that the current price action is occurring within a larger consolidation phase. The support levels on the daily chart are significantly lower, at $3,955.4, $3,879.88, and $3,799.73, providing substantial room for a downturn if the current resistance at $4,179.77 holds firm.
Macroeconomic Currents Shaping Gold's Trajectory
The geopolitical landscape and central bank policies are increasingly influencing gold's price action, often acting as a powerful counterpoint to purely technical signals. Heightened geopolitical tensions, particularly in regions that could impact global energy supply and stability, tend to drive 'safe-haven' flows into gold. While the provided data doesn't detail specific geopolitical events, the general market context often reflects these undercurrents. For instance, news regarding potential supply disruptions or escalations in conflicts can immediately boost gold's appeal. On the other side of the coin, the monetary policy stance of major central banks, especially the Federal Reserve, plays a critical role. If the Fed signals a more hawkish approach, potentially through higher-than-expected interest rate hikes or a slower pace of rate cuts, this typically strengthens the US dollar and weighs on gold prices. Conversely, dovish signals or a pause in tightening cycles can reduce the opportunity cost of holding non-yielding assets like gold, thereby supporting its price. The current DXY at 100.85, while showing a slight dip, needs to be watched closely. A sustained weakening of the dollar, perhaps driven by expectations of Fed rate cuts or other central banks adopting a more aggressive stance, would likely provide further impetus for XAUUSD to break through its current resistance.
The relationship between gold and other commodities, particularly oil, is also a key consideration, especially given its role as an inflation hedge. Brent crude, currently at $72.19, and WTI crude at $69.31, are both showing signs of upward momentum on shorter timeframes, though their daily charts indicate a strong downward trend. Higher oil prices can translate into increased inflation expectations, which historically supports gold as a store of value. However, if oil prices surge due to supply-side shocks rather than demand, it could also signal a global economic slowdown, which might dampen demand for riskier assets and indirectly benefit gold as a safe haven. The current data shows Brent with a strong downward trend on the daily chart, despite short-term gains, and WTI mirroring this, suggesting that the inflationary pressure from oil might not be as pronounced as it could be. This complex dynamic means that while rising oil prices might seem bullish for gold on the surface, the underlying economic conditions driving those oil prices are equally important.
The performance of major stock indices also provides a crucial lens through which to view gold's movements. The SP500's current price of 6572.87 and Nasdaq 100 at 29445.26 are trading with mixed signals across different timeframes. The SP500 shows a clear uptrend on 1H and 4H charts but a bearish daily outlook, while the Nasdaq 100 exhibits bearish signals on lower timeframes. This mixed equity performance suggests a degree of caution in the broader market. If risk appetite continues to falter, as indicated by the bearish daily outlooks for these indices, investors may flock to traditional safe-haven assets like gold, potentially driving XAUUSD higher. The current price of $4,179.77 is therefore being tested in an environment where traditional risk assets are showing signs of vulnerability, adding another layer of support to the bullish case for gold, provided no major negative catalysts emerge. The key is to monitor whether the short-term bullish technicals on gold are supported by a deteriorating risk sentiment, or if the gains are merely a technical correction within a broader risk-on environment.
The $4,179.77 Threshold: What the Scenarios Foretell
Given the current technical and macroeconomic landscape, multiple scenarios are plausible for XAUUSD as it approaches the $4,179.77 mark. The confluence of strong short-term bullish technicals, particularly on the 1-hour timeframe, coupled with lingering geopolitical uncertainties and mixed equity market performance, creates a fertile ground for volatility. The key is to assess the probability of each scenario playing out and to identify the triggers and invalidation points that will define the market's direction. The ADX readings across different timeframes highlight a strong trend on the 1H (38.71) and 4H (32.73) charts, but a weaker, albeit still strong, trend on the daily (41.15). This suggests that while the momentum is currently bullish, the conviction might be waning on longer timeframes, making the $4,179.77 level a significant point of decision.
Bearish Scenario: Resistance Holds Firm
55% ProbabilityNeutral Scenario: Consolidation Around $4,179.77
25% ProbabilityBullish Scenario: Breakout Above Resistance
20% ProbabilityTrading Implications and Risk Management
The current technical setup for XAUUSD, particularly the divergence between short-term bullish momentum and longer-term neutral-to-bearish signals, demands a cautious approach. The RSI at 76.16 on the 1H chart is a clear warning sign of potential overextension. While the ADX at 38.71 on the 1H indicates a strong trend, the daily ADX at 41.15 pointing downward suggests that the underlying trend might be weakening or consolidating. Traders should be wary of chasing the current price without clear confirmation of a breakout above the $4,185.48 resistance. A more prudent strategy might involve waiting for a pullback to a key support level, such as $4,129.70 or $4,110.53, to establish long positions, or waiting for a confirmed break above resistance with sustained volume. The correlation with the DXY is also vital; a rebound in the dollar could quickly turn the tide against gold.
For those considering short positions, the failure of gold to decisively break above $4,185.48, coupled with a potential shift in market sentiment towards risk-off, could present an opportunity. A break below the 1H support at $4,129.70 would be a significant bearish signal, potentially opening the door for a test of the 4H support at $4,110.53. However, given the strong uptrend on lower timeframes, betting against gold at these levels without clear confirmation of a reversal carries substantial risk. It is imperative to manage risk diligently, utilizing stop-losses to protect capital. For instance, a stop-loss below $4,129.70 for a long position, or above $4,185.48 for a short position, would be prudent depending on the chosen entry strategy. The market is currently at a crossroads, and patience will likely be rewarded for those who wait for clearer signals rather than attempting to anticipate the next move.
The broader economic calendar also plays a crucial role. While no specific upcoming events are detailed in the provided data, any significant data releases concerning inflation, employment, or central bank policy decisions could act as catalysts for a decisive move in gold. For example, stronger-than-expected US Non-Farm Payrolls data could strengthen the dollar and pressure gold, while weaker data might have the opposite effect. Similarly, any hints from the Federal Reserve regarding future monetary policy could dramatically shift market sentiment. Traders should stay informed about these macroeconomic developments and adjust their strategies accordingly. The current neutral stance on the daily chart suggests that the market is waiting for a clear catalyst to break out of its current equilibrium, making the $4,179.77 level a critical pivot point.
Frequently Asked Questions: XAUUSD Analysis
What happens if XAUUSD breaks above the $4,185.48 resistance level?
A decisive breakout above $4,185.48, confirmed by strong volume, would likely trigger further bullish momentum. The next significant resistance target would be the daily chart level at $4,266.74, with a potential to test the psychological level around $4,300.00 if market sentiment remains strongly bullish.
Is the current RSI at 76.16 a sell signal for XAUUSD at $4,179.77?
An RSI of 76.16 on the 1-hour chart indicates overbought conditions, suggesting that gold may be due for a short-term pullback or consolidation. However, in a strong uptrend, RSI can remain elevated for extended periods. It's not a definitive sell signal on its own but warrants caution and confirmation from other indicators or price action.
How will the DXY's movement affect XAUUSD's price around $4,179.77?
With the DXY currently at 100.85 and showing a slight downtrend on the 1-hour chart, it provides some underlying support for gold. If the dollar continues to weaken, it could help XAUUSD break through its resistance. Conversely, any sign of dollar strength would likely put downward pressure on gold prices.
Should traders consider buying XAUUSD at $4,179.77 given the mixed daily trend signals?
Buying directly at $4,179.77 carries risk due to the overbought conditions on lower timeframes and the neutral-to-bearish signals on the daily chart. A more conservative approach would be to wait for a pullback to support levels like $4,129.70 or $4,110.53, or for a confirmed breakout above $4,185.48 with strong volume.
Track markets in real-time
AI-powered analysis, technical indicators and real-time price data.
Join Our Telegram Channel
Breaking market news, AI analysis and trading signals instantly.
Join Channel