The global financial stage is constantly shifting, and the precious metals market is no exception. Amidst evolving geopolitical tensions and fluctuating central bank policies, silver (XAGUSD) has recently found itself in the spotlight, currently trading at the critical juncture of $60.31. This price point is not just a number; it represents a significant level where past price action suggests a battleground between buyers and sellers. As traders and investors eye this level, understanding the underlying technical signals and macroeconomic undercurrents becomes paramount for navigating the potential volatility ahead. This analysis delves into the intricate details of silver's current technical posture, examining multiple timeframes and key indicators to paint a comprehensive picture of where the market might be headed.
- RSI at 64.16 on the 1H chart indicates neutral momentum with a slight upward bias, while the 1D RSI at 37.1 suggests a downward trend.
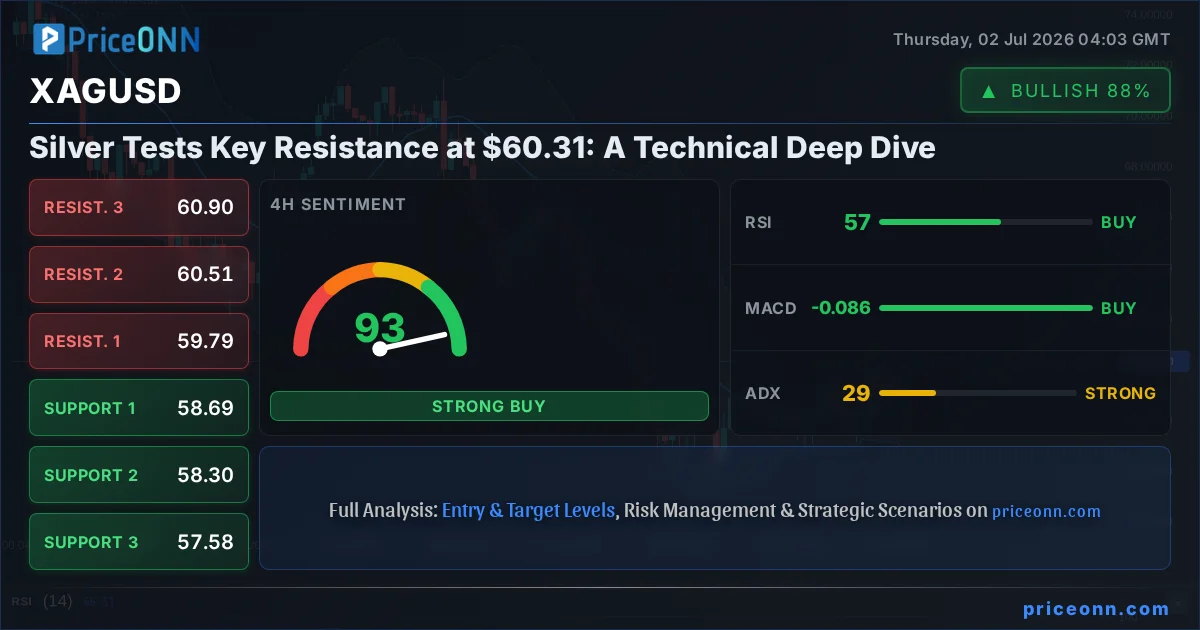
- Critical support for XAGUSD sits at $59.16, tested multiple times in the recent past, while resistance is forming around $60.74 and $60.99.
- The ADX reading of 22.37 on the 1H chart points to a medium-strength uptrend, contrasting with the 1D ADX of 40.03 suggesting a strong downtrend.
- Current market sentiment shows a mixed signal, with 1H and 4H timeframes leaning towards 'Buy' (8/0/0 and 7/1/0 respectively) while the 1D timeframe strongly favors 'Sell' (1/7/0).
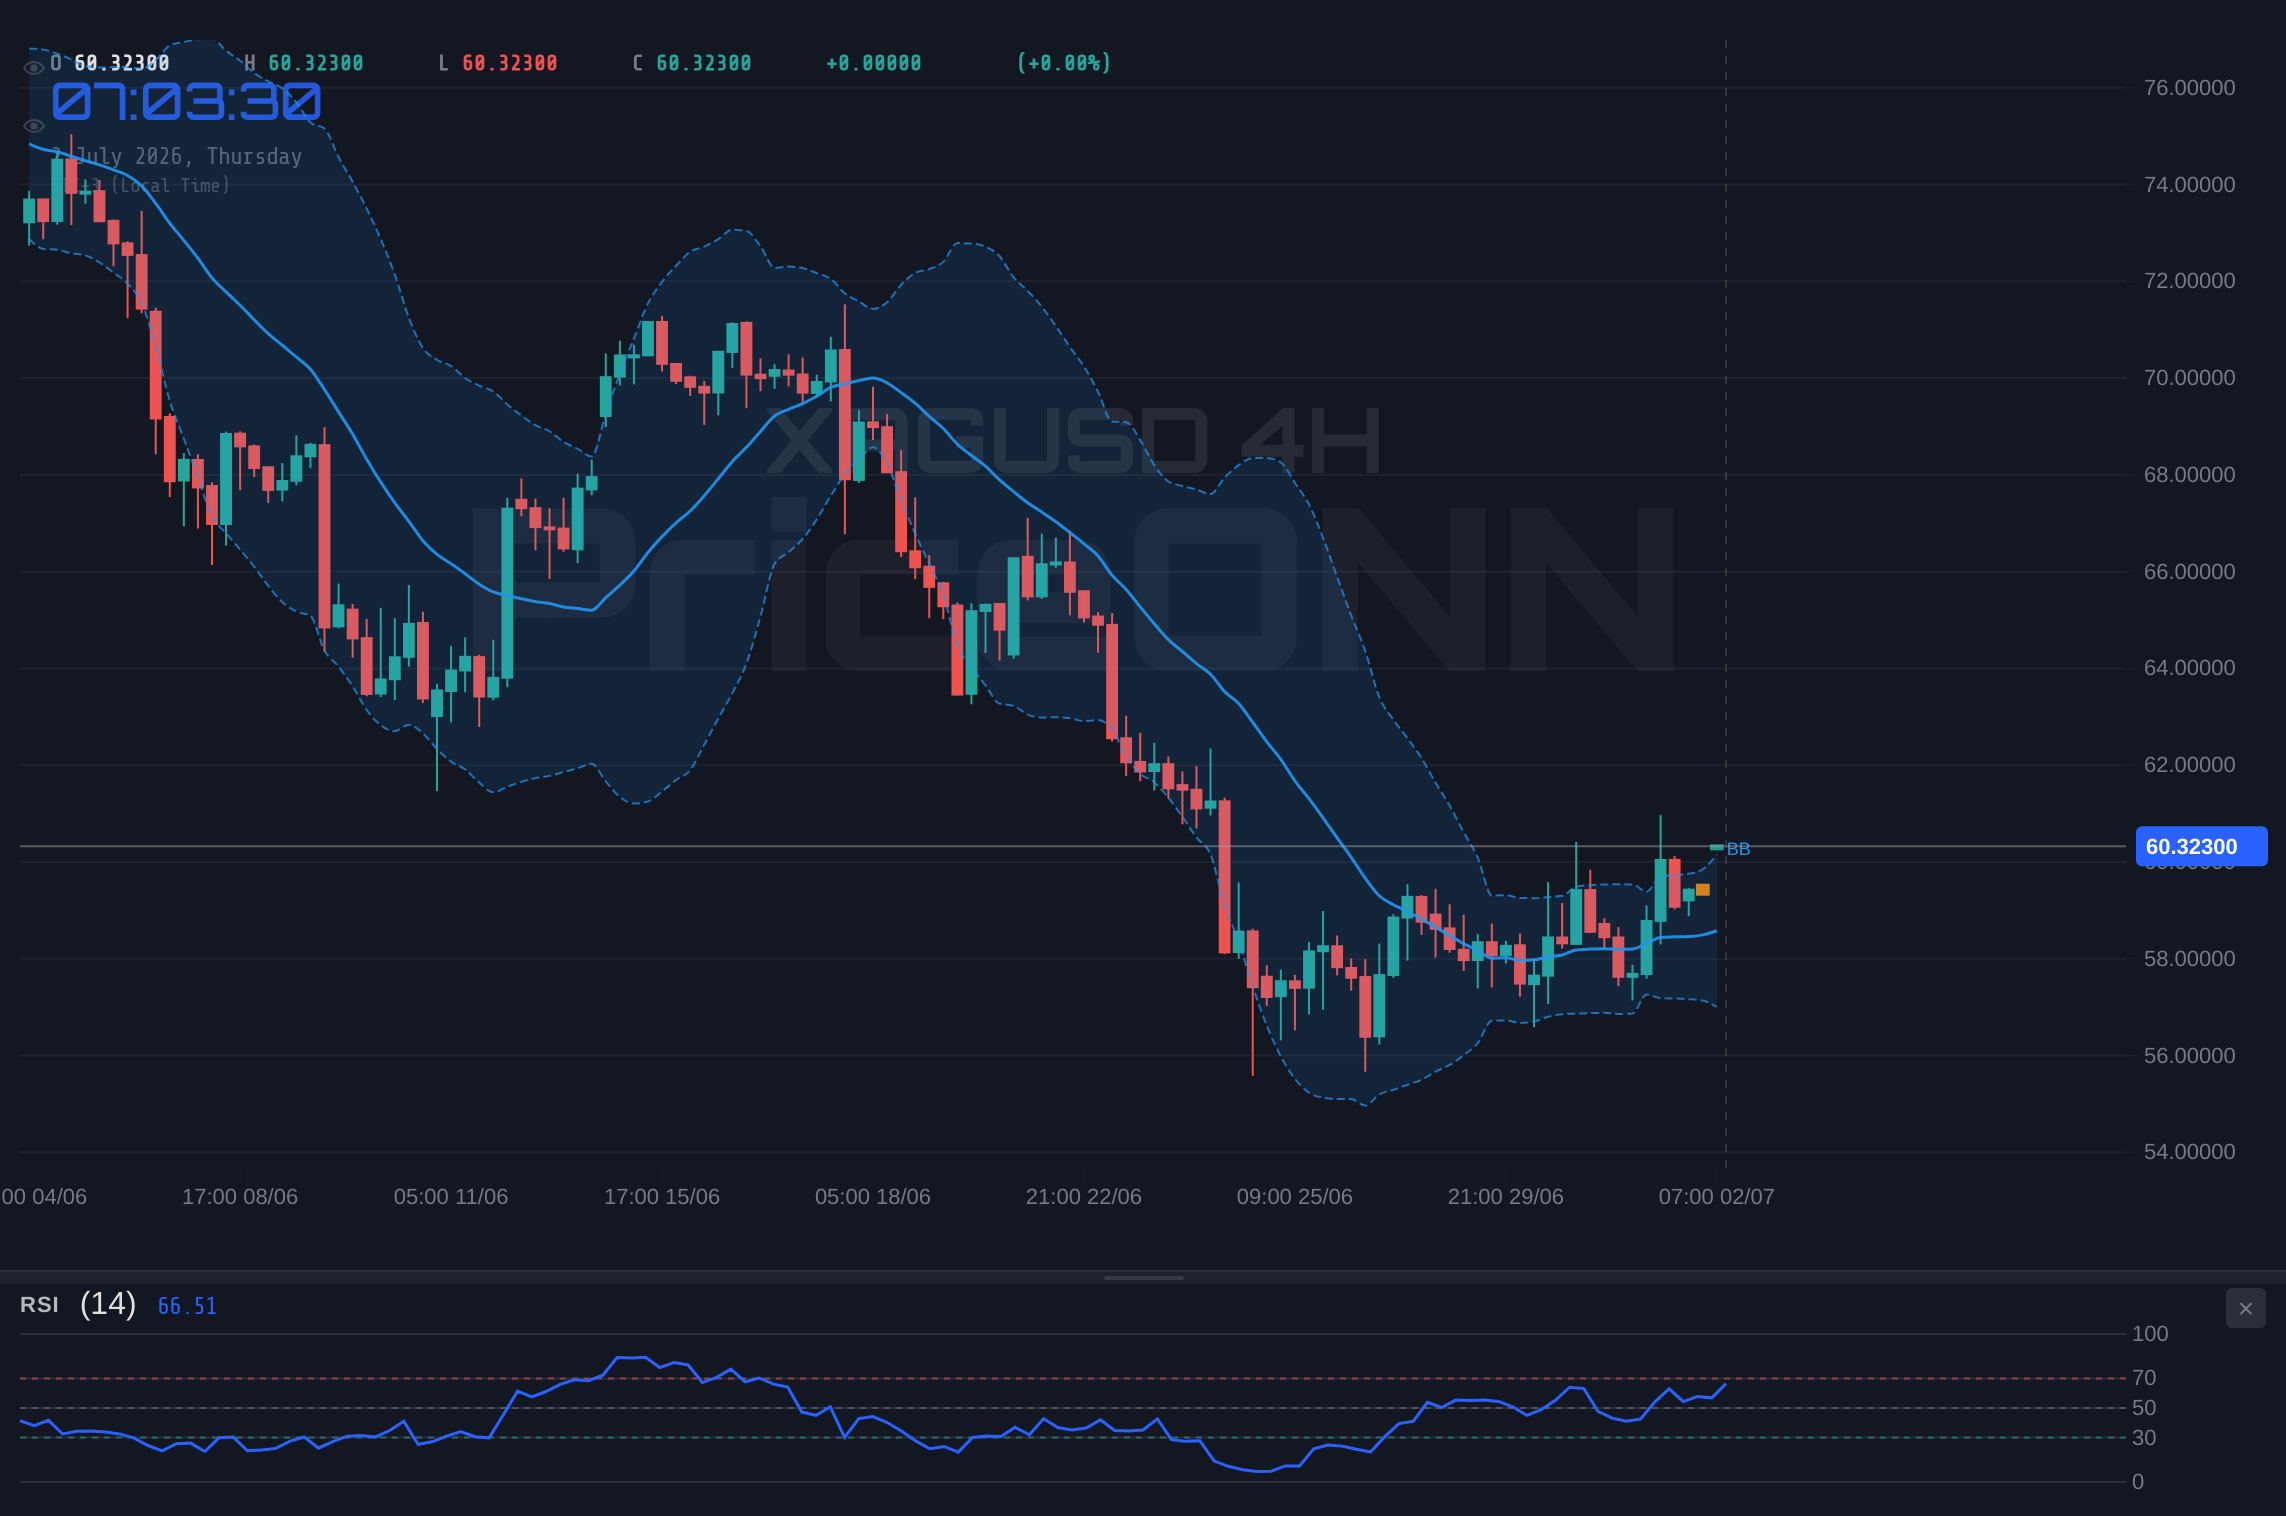
The narrative surrounding silver's recent performance is complex, marked by a divergence in signals across different timeframes. On the shorter 1-hour and 4-hour charts, technical indicators are flashing a predominantly bullish sentiment. The 1-hour chart, for instance, shows a strong 'BUY' signal with 8 out of 8 indicators aligned for an upward move. Similarly, the 4-hour timeframe echoes this optimism with a 'BUY' signal leaning heavily (7 buys, 1 sell). This short-to-medium term bullishness is supported by indicators like the Stochastic Oscillator, which is showing strong upward momentum (K=80.95, D=43.23 on 1H; K=69.8, D=50.05 on 4H), and positive MACD readings. The Bollinger Bands also suggest an upward bias, trading above the middle band. This confluence of factors on lower timeframes paints a picture of immediate buying pressure, potentially driving the price higher in the short term.
However, the longer-term daily chart presents a starkly different perspective, casting a shadow of doubt on the sustainability of any immediate upward moves. The 1-day timeframe indicators are overwhelmingly bearish, with a 'SELL' signal dominating (1 buy, 7 sells). The RSI on the daily chart is at 37.1, indicating a downward trend and suggesting that any rallies might be short-lived or corrective in nature. The MACD is also below its signal line, reinforcing the bearish momentum. Furthermore, the ADX on the daily timeframe stands at a robust 40.03, signifying a strong existing downtrend. This significant divergence between the short-term bullish signals and the long-term bearish trend is the crux of the current market puzzle for XAGUSD. It suggests that while there might be intraday or intraweek opportunities for bulls, the overarching trend on the daily chart remains a significant headwind.
Delving deeper into the technical landscape, the 1-hour chart for XAGUSD at $60.31 reveals a market that, on this granular level, appears to be in a controlled ascent. The trend strength is rated at 50%, indicating a neutral stance but with a clear bullish lean given the overall signal. Key support levels are identified at $59.69, $59.37, and $59.16, levels that have historically acted as floors for the price. On the resistance side, immediate hurdles are placed at $60.21, $60.42, and notably $60.74. The RSI at 64.16 is in the neutral zone but trending upwards, suggesting room for further gains without immediately entering overbought territory. The Stochastic Oscillator, with its %K line (80.95) significantly above its %D line (43.23), strongly signals a bullish move, indicating that momentum is building. The ADX at 24.77 confirms a medium-strength uptrend on this timeframe, providing a reasonable basis for short-term bullish expectations. This intricate dance of indicators on the 1H chart creates an environment where short-term traders might find opportunities to play the upward momentum.
Transitioning to the 4-hour timeframe, the picture becomes more complex, yet still leans towards a bullish bias in the medium term. The trend is identified as 'Downtrend' with a high strength of 84%, which might seem contradictory to the 1H bullish signals. However, it's crucial to interpret this within the context of a larger potential correction or a bear market rally. Support levels here are more robust, situated at $58.69, $58.30, and $57.58. Resistance is seen at $59.79, $60.51, and $60.90. The RSI at 57.25 remains in the neutral zone, showing a potential for further upward movement before hitting overbought conditions. The Stochastic Oscillator continues its upward trajectory, with K=69.8 and D=48.66, reinforcing the bullish signal. The ADX at 28.95 indicates a strong uptrend on this timeframe, suggesting that the current price action, even if within a larger downtrend, has significant momentum. The Bollinger Bands are trading above the middle band, aligning with this bullish interpretation. The aggregate signal here is still 'BUY', but the 'Downtrend' label on the trend itself warrants caution, hinting that this might be a counter-trend move within a larger bearish structure.
The daily chart, however, paints the most significant picture for long-term investors and traders. Here, the trend is neutral with a 50% strength, but the overall signal is a strong 'SELL'. The current price of $60.31 is below the middle Bollinger Band, and the RSI at 39.2 indicates a downward trend, suggesting bearish momentum is building. The MACD is negative and below its signal line, further confirming the bearish sentiment. The ADX at 42.07 is a critical reading here; it signifies a strong downtrend, indicating that the prevailing market condition is one of sustained selling pressure. Support levels on this timeframe are substantially lower, at $39.55, $38.79, and $37.99, highlighting the significant distance the price would need to fall to reach these points. Resistance levels are much higher, starting at $41.11 and extending to $42.66. The Stochastic Oscillator, while showing an upward signal (K=31.35, D=20.9), is still in oversold territory, meaning this bullish signal might be a precursor to a bounce rather than a sustained trend reversal. The overwhelming bearish indicators on the daily chart suggest that any short-term bullish moves are likely to face strong headwinds and could be opportunities for profit-taking or short entries.
Considering the macroeconomic backdrop, recent news highlights potential headwinds for silver. Goldman Sachs' warning of an oil market surplus in 2027, while directly impacting energy markets, can indirectly influence precious metals. A potential glut in oil could signal broader economic slowdown concerns, which typically leads to a flight towards safe-haven assets like gold, but silver's industrial demand component can make it more susceptible to economic downturns. Furthermore, the strengthening US Dollar Index (DXY), currently around 101.38, often exerts downward pressure on dollar-denominated commodities like silver. A stronger dollar makes silver more expensive for holders of other currencies, potentially dampening demand. While the DXY has seen a slight dip recently, its overall strength remains a key factor to monitor. The cooling inflation expectations mentioned in the EUR/USD forecast context could also reduce the appeal of silver as an inflation hedge, a traditional driver of its price.
The recent Forex market movements also provide context. The EUR/USD pair trading near 1.1410, with cooling inflation bets and a softer Fed stance, suggests a potential shift in global monetary policy expectations. While this might typically weaken the dollar, the DXY's resilience indicates other factors are at play. The Canadian Dollar languishing near year-to-date lows against the USD, awaiting US Non-Farm Payrolls (NFP) data, underscores the market's sensitivity to US economic releases. The upcoming NFP report is crucial; strong employment figures could bolster the Fed's hawkish stance, potentially strengthening the dollar and pressuring silver, while weak figures might lead to a dollar pullback and a reprieve for commodities. The mention of Fed's Warsh potentially triggering a silver selloff without saying much highlights how sensitive the market is to any hint of monetary tightening, even indirectly. This suggests that any data reinforcing a tighter monetary policy could be a significant bearish catalyst for silver.
The technical indicators, when viewed holistically, present a classic scenario of conflicting signals across timeframes. The 1-hour and 4-hour charts are screaming 'BUY', driven by momentum indicators and recent price action. However, the daily chart's strong 'SELL' signal, supported by a high ADX value and oversold RSI, cannot be ignored. This situation often leads to choppy price action, where short-term gains are quickly eroded by longer-term selling pressure. For traders, the key is to identify which timeframe's signals are more likely to prevail or to wait for a clearer directional bias. The current price of $60.31 sits precariously between the immediate resistance at $60.42 and the more significant $60.74, while immediate support is found at $60.21. A break above $60.42 could ignite a short-term rally towards $60.74 and potentially $60.99, aligning with the bullish short-term signals. Conversely, a failure to hold support at $60.21 could see a rapid decline towards $59.79 and potentially $59.16, validating the bearish daily outlook.
The recent news about Harmony Gold Mining being a top metals pick, while focused on gold, indicates a general positive sentiment within the broader precious metals sector, which could spill over to silver. However, silver's dual nature as both a monetary and industrial metal means it is susceptible to economic cycles in a way that gold is not. If the anticipated oil surplus and potential economic slowdown materialize, the industrial demand for silver could be significantly impacted, overriding any safe-haven appeal. This makes the economic calendar, particularly upcoming growth and employment data from the US, critically important. The market is currently pricing in a certain Fed stance, but any deviation from expectations, especially concerning interest rate policy, could trigger substantial volatility across all asset classes, including silver.
The immediate price action around $60.31 is crucial. The price is currently testing the resistance at $60.42. A decisive close above this level on the 1-hour chart, backed by increasing volume, could signal a short-term bullish continuation towards $60.74 and potentially $60.99. However, traders must remain vigilant. The strong bearish trend on the daily chart suggests that this resistance might hold, leading to a reversal. The ADX on the daily chart at 42.07 is a strong indicator of a prevailing downtrend, meaning any upward moves are likely to be met with significant selling pressure from participants who are positioned for a continued decline. The RSI at 39.2 on the daily chart also supports this, indicating that the market is still favoring sellers. Therefore, while short-term traders might look for intraday opportunities based on the 1H and 4H signals, longer-term investors should be cautious and await confirmation of a trend reversal on the daily timeframe.
The confluence of technical signals and macroeconomic factors presents a complex trading environment for silver. The bullish momentum on shorter timeframes is battling against a firmly established bearish trend on the daily chart. This creates a high degree of uncertainty. The upcoming US Non-Farm Payrolls report is a significant event risk that could provide the catalyst needed to break this indecision. A strong report could bolster the dollar and reinforce the bearish daily outlook for silver, while a weak report could trigger a short-covering rally, potentially pushing silver prices higher in the short term, though its long-term sustainability would still be questioned given the daily chart's bearish indicators. Traders should exercise caution, manage risk diligently, and look for clear confirmation before committing to significant positions. The $60.99 level remains a key resistance to watch, while support at $59.16 could be tested if the bearish daily trend reasserts itself.
Bearish Scenario: Daily Downtrend Resumes
65% ProbabilityBullish Scenario: Short-Term Momentum Continues
25% ProbabilityNeutral Scenario: Range-Bound Consolidation
10% ProbabilityFrequently Asked Questions: XAGUSD Analysis
What happens if XAGUSD breaks above the $60.74 resistance level?
If XAGUSD breaks and sustains above the $60.74 resistance, it could trigger a bullish scenario targeting $60.99 and potentially $61.35, aligning with short-term bullish momentum signals on the 1H and 4H charts.
Should I consider buying silver at current levels around $60.31 given the mixed signals?
Buying at $60.31 requires caution due to conflicting signals. The 1H and 4H charts show bullish momentum, but the daily chart indicates a strong downtrend. A confirmation above $60.74 is needed for a higher probability bullish trade, while a hold below $60.21 could signal a bearish continuation.
Is the RSI at 37.1 on the daily chart a sell signal for XAGUSD?
An RSI of 37.1 on the daily chart suggests a downward trend and bearish momentum. While not an immediate 'sell' signal in isolation, it reinforces the bearish outlook and indicates that any rallies might face selling pressure, aligning with the dominant daily trend.
How will the upcoming US Non-Farm Payrolls report affect XAGUSD trading?
Strong NFP data could strengthen the US Dollar and reinforce the bearish daily trend for XAGUSD, potentially pushing prices lower. Conversely, weak data might lead to a dollar pullback and a short-covering rally in silver, though long-term sustainability would be questioned.
Technical Outlook Summary
| Indicator | Value | Signal | Interpretation |
|---|---|---|---|
| RSI (14) | 64.16 | Neutral | Uptrend bias on 1H, Downtrend on 1D |
| MACD Histogram | +0.24 | Bullish | Positive momentum on 1H/4H, negative on 1D |
| Stochastic | K=80.95, D=43.23 | Bullish | Strong upward signal on 1H |
| ADX | 22.37 | Bullish | Medium strength uptrend on 1H, Strong downtrend on 1D |
| Bollinger Bands | Middle Band | Watch | Price above middle band on 1H/4H, below on 1D |
Key Levels
Track markets in real-time
AI-powered analysis, technical indicators and real-time price data.
Join Our Telegram Channel
Breaking market news, AI analysis and trading signals instantly.
Join Channel