Is gold poised for another leg higher, or will the $4,065.91 resistance level prove too formidable? XAUUSD is currently trading at $4,046.58, caught in a tug-of-war between a strengthening US Dollar and persistent inflation concerns. The market's delicate balance, influenced by everything from Fed rate expectations to geopolitical undercurrents, makes understanding the interplay of these forces absolutely crucial for any gold trader right now.
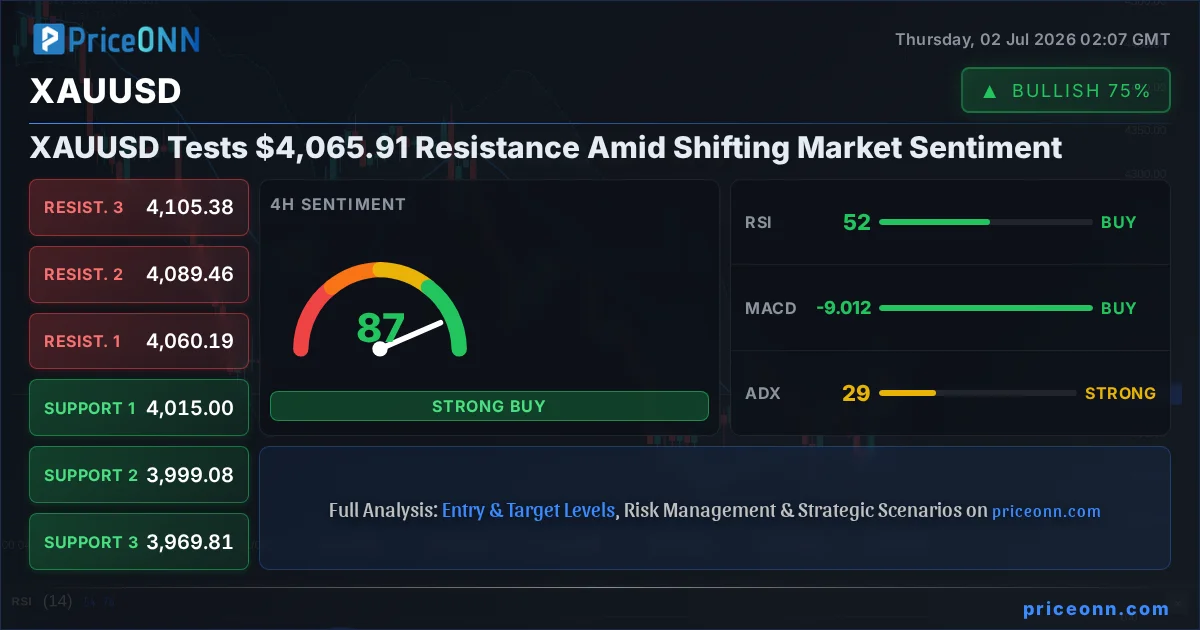
- XAUUSD is currently trading at $4,046.58, approaching the significant $4,065.91 resistance.
- The US Dollar Index (DXY) is showing strength, currently at 101.38, which typically pressures gold prices.
- Risk appetite is mixed, with Nasdaq showing weakness while SP500 trades higher, creating a complex sentiment backdrop for gold.
- Technical indicators on the daily chart show a strong downtrend (ADX 42.26), but shorter timeframes suggest a potential rebound.
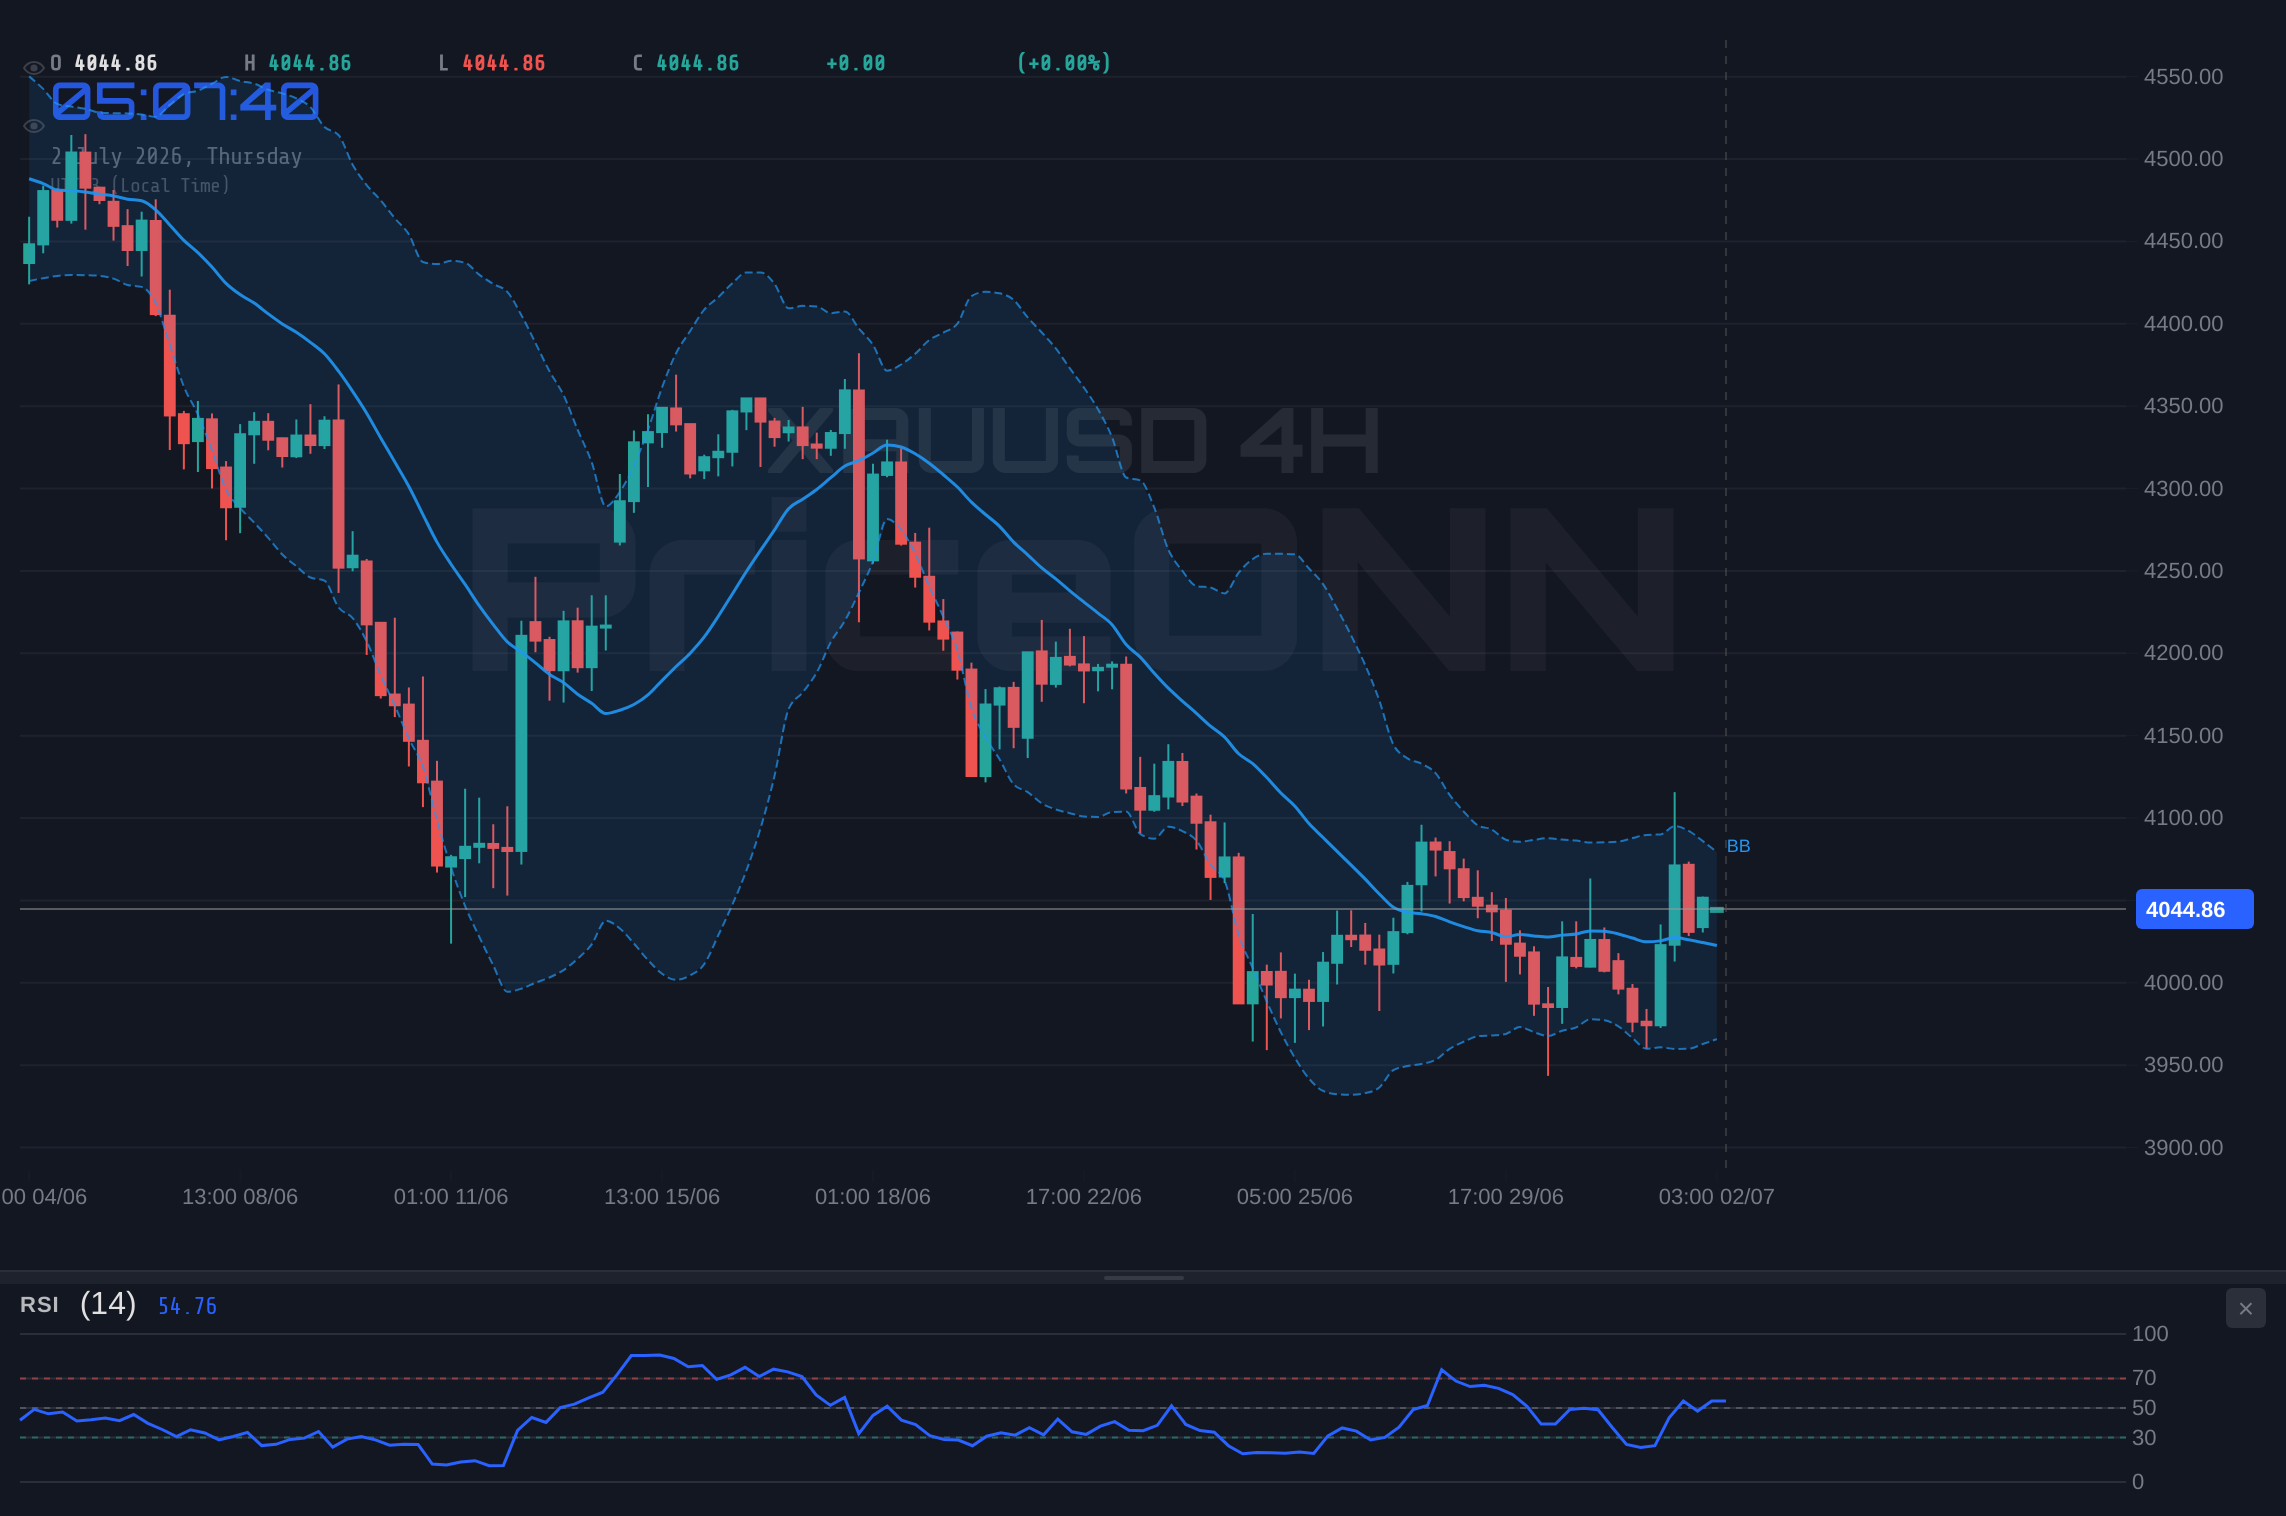
The precious metal has seen a notable recovery, climbing 0.98% on the day to $4,046.58. This upward momentum, however, faces a stern test at the $4,065.91 resistance level. The daily chart paints a picture of a strong downtrend with an ADX reading of 42.26, indicating significant trend strength. Yet, the 1-hour and 4-hour charts present a more nuanced, even bullish, picture with general buy signals and rising RSI values, suggesting short-term strength that could challenge the longer-term bearish outlook. This divergence is where the real trading opportunity lies – identifying the conditions under which short-term strength can overcome the prevailing downtrend.
Understanding the broader market context is paramount. The US Dollar Index (DXY), currently at 101.38 and showing a strong upward trend on the daily timeframe (ADX 42.51), often acts as a headwind for gold. A stronger dollar generally makes gold more expensive for holders of other currencies, potentially dampening demand. However, gold's safe-haven appeal can sometimes override this correlation, especially when inflation fears or geopolitical tensions rise. The current DXY strength, while typically bearish for gold, is occurring within a complex market environment where inflation remains a persistent concern, creating a potential for gold to either defy the dollar's strength or be pulled down by it.
Risk sentiment is a critical, albeit mixed, factor. The Nasdaq Composite, currently at 29,947.88, is showing a strong downtrend on the 1-hour chart, signaling a potential risk-off mood. Conversely, the SP500, trading at 6572.87, is showing a strong daily uptrend. This divergence in major equity indices creates uncertainty. In a true risk-off environment, we would expect gold to benefit from safe-haven flows as investors flee riskier assets. However, the current price action suggests this relationship is not straightforward. The market seems to be weighing different factors, making it essential to watch how these indices evolve as potential catalysts for gold's next move.
The Bull's Roadmap: Chasing $4,080
For the bulls to regain control, several technical and fundamental conditions must align. The immediate hurdle is the resistance at $4,065.91. A decisive break and sustained hold above this level, ideally with increasing volume, would signal a shift. The 1-hour chart's buy signal, coupled with a rising RSI (currently 54.36) and a MACD that is attempting to move above its signal line, provides an early indication of potential strength. If gold can clear $4,065.91, the next logical target would be the resistance at $4,080.93. Further upside could see prices testing $4,105.38, though this would require a significant shift in broader market sentiment and a potential weakening of the US Dollar.
The 4-hour timeframe offers a more optimistic outlook for a bullish scenario, despite the daily trend being bearish. The 4-hour chart shows a general 'AL' signal, with RSI at 52.39 and ADX at 28.83 indicating a strong uptrend on this timeframe. If the intraday strength can be sustained and translate into a daily close above $4,065.91, it could invalidate the immediate bearish pressure seen on the daily chart. This scenario hinges on the market's ability to digest current inflation data without triggering aggressive Fed tightening expectations, which would likely boost gold's appeal as an inflation hedge. The Stochastic indicator on the 4-hour chart, with K at 57.52 and D at 47.8, supports this bullish momentum, showing a clear upward crossover.
However, the daily chart's persistent bearish signals cannot be ignored. The ADX at 42.26 signifies a strong established downtrend. For a sustained bullish move, price would need to not only break resistance but also show a clear reversal pattern on the daily timeframe. This would involve RSI moving decisively above 50, MACD histogram turning positive and crossing above its signal line, and the ADX beginning to decline, indicating trend exhaustion. Without these confirmations, any rally above $4,065.91 could be viewed as a 'bear trap' – a temporary surge before a resumption of the downtrend. The support levels on the daily chart, starting at $3,946.12, loom large as potential areas where sellers might re-emerge if the bullish momentum falters.
Where Bears Take Control: Testing the $4,015 Floor
The bearish case remains strong, particularly given the daily chart's technical setup. The current price of $4,046.58 is well below the daily resistance at $4,065.91. A failure to break this resistance, coupled with a potential downturn in risk sentiment or a further strengthening of the US Dollar, could easily send gold lower. The 1-hour chart's MACD is currently showing negative momentum, and the Stochastic oscillator (K=24.32, D=31.1) is signaling a potential bearish crossover, reinforcing the downside risk. If gold breaks below the immediate support at $4,037.33, the next key level to watch would be $4,023.04, followed by the more significant support at $4,015.53.
The daily chart's technical indicators are predominantly bearish. RSI at 37.1 suggests room for further downside before reaching oversold territory. The MACD is below its signal line with negative momentum, and the Bollinger Bands show price trading below the middle band, indicating a bearish bias. The ADX at 42.26 confirms a strong existing downtrend. If gold fails to hold the $4,037.33 support, the path of least resistance would be downwards, targeting the daily support levels. A break below $4,015.53 would significantly increase the probability of a move towards $3,999.08 and potentially lower, especially if broader market conditions turn decidedly risk-averse.
Geopolitical events or unexpected hawkish shifts from central banks could act as catalysts for a bearish move. For instance, any news suggesting a faster-than-expected interest rate hike from the Federal Reserve would likely strengthen the USD and reduce gold's attractiveness. Similarly, a de-escalation of geopolitical tensions could reduce gold's safe-haven demand. The recent news about Brent crude futures dropping and Goldman Sachs warning of an oil market surplus might suggest cooling inflation expectations, which could indirectly weaken gold's inflation hedge narrative, though this is a complex relationship.
The Waiting Game: Consolidation Around $4,040
A neutral scenario, where gold trades within a defined range, is also plausible, especially if conflicting signals persist and no clear directional catalysts emerge. This could occur if the US Dollar stabilizes without a strong directional push, and risk sentiment remains mixed. In such a scenario, gold might consolidate between the immediate support at $4,037.33 and resistance at $4,065.91. This range-bound trading could persist until a significant economic data release or a geopolitical event provides a clear directional impetus.
During consolidation, technical indicators often provide mixed signals. The RSI hovering around 54 on the 1-hour chart and 52 on the 4-hour chart indicates neither strong buying nor selling pressure. The MACD might oscillate around its signal line, and Stochastic oscillators could fluctuate between overbought and oversold territory without sustained crossovers. This choppy, directionless price action is typical of consolidation phases. Traders in this environment often look for range boundaries to play short-term trades, but the overall trend remains uncertain until a decisive breakout occurs. The ADX values, particularly the weaker ones on the 1-hour (24.85) and 4-hour (28.83) charts compared to the daily (42.26), could support a view of a temporary pause in trend.
The key to a neutral scenario is the absence of strong directional conviction from either bulls or bears. This could be a period of waiting for crucial economic data, such as upcoming employment figures or inflation reports, or for clearer signals from central bank policy. Until then, price action might be characterized by volatility within the established range, with short-term fluctuations driven by minor news events or technical levels being tested and holding. The $4,046.58 current price sits squarely within this potential consolidation zone, making it a pivotal point to observe for signs of accumulation or distribution.
Probability Assessment and Key Triggers
Considering the technical indicators across different timeframes and the broader market context, the most probable scenario in the short to medium term appears to lean towards a cautious bearish outlook, primarily driven by the strong daily downtrend signals and the strengthening US Dollar. However, the intraday strength and mixed signals on shorter timeframes suggest that a bounce towards resistance is possible before any significant downside move.
Scenario Probabilities:
Bearish Scenario: Dollar Strength Dominates
65% ProbabilityNeutral Scenario: Range-Bound Indecision
25% ProbabilityBullish Scenario: Inflation Hedge Takes Hold
10% ProbabilityThe key triggers to watch this week will be crucial economic data releases, particularly any news impacting inflation expectations or Federal Reserve policy outlook. The US Non-Farm Payrolls report, due soon, will be a significant event. If the data comes in significantly above expectations, it could strengthen the dollar and pressure gold lower, aligning with the bearish scenario. Conversely, weaker-than-expected data might fuel safe-haven demand for gold and weaken the dollar, potentially opening the door for the bullish scenario, though this is currently the least probable outcome given the daily technicals.
Furthermore, closely monitoring the DXY's reaction to US Treasury yields will be vital. Any sustained move in the DXY above 101.50 would likely add pressure on gold. Conversely, a dip in yields and a weakening dollar below 101.00 could provide a tailwind for XAUUSD. The interplay between equities and gold also warrants attention; a significant selloff in the Nasdaq, currently showing weakness, could spill over into gold if it triggers a broader flight to safety, but the conflicting signals from the SP500 complicate this picture. For now, the $4,065.91 resistance level remains the immediate battleground.
Frequently Asked Questions: XAUUSD Analysis
What happens if XAUUSD fails to break above the $4,065.91 resistance?
If XAUUSD fails to decisively break above $4,065.91, the strong daily downtrend is likely to resume. We could see price retrace towards the $4,037.33 support level, with a potential move towards $4,015.53 if selling pressure intensifies.
Should I buy XAUUSD at current levels around $4,046.58 given the mixed signals?
Caution is advised. While shorter timeframes show some bullish momentum, the dominant daily downtrend and strong DXY suggest a high-risk entry. A confirmed break above $4,065.91 or a dip to stronger support levels like $4,015.53 might offer clearer opportunities, but risk management is paramount.
Is the RSI at 54.36 on the 1-hour chart a buy signal for XAUUSD?
An RSI of 54.36 on the 1-hour chart indicates a neutral to slightly bullish leaning, suggesting some upward momentum. However, it's not an extreme overbought or oversold reading. This level alone is not a strong buy signal, especially with the daily chart showing a strong downtrend (RSI 37.1).
How will upcoming NFP data affect XAUUSD this week?
Stronger-than-expected NFP data could boost the US Dollar and pressure gold lower, aligning with the prevailing bearish scenario. Conversely, weaker data might increase safe-haven demand for gold and weaken the dollar, potentially supporting a short-term bounce towards resistance levels.
Track markets in real-time
AI-powered analysis, technical indicators and real-time price data.
Join Our Telegram Channel
Breaking market news, AI analysis and trading signals instantly.
Join Channel