The relentless battle between bullish and bearish forces is on full display in the silver market, with XAGUSD currently hovering around the critical $60.84 mark. Today's analysis delves into the intricate dance of price action, technical indicators, and fundamental drivers shaping silver's trajectory. As traders eye the key resistance level near $60.84, the question remains: can the bulls maintain their momentum, or are bears poised to reclaim control?
- XAGUSD is currently trading at $60.84, with a strong bullish trend on the 1-hour and 4-hour timeframes.
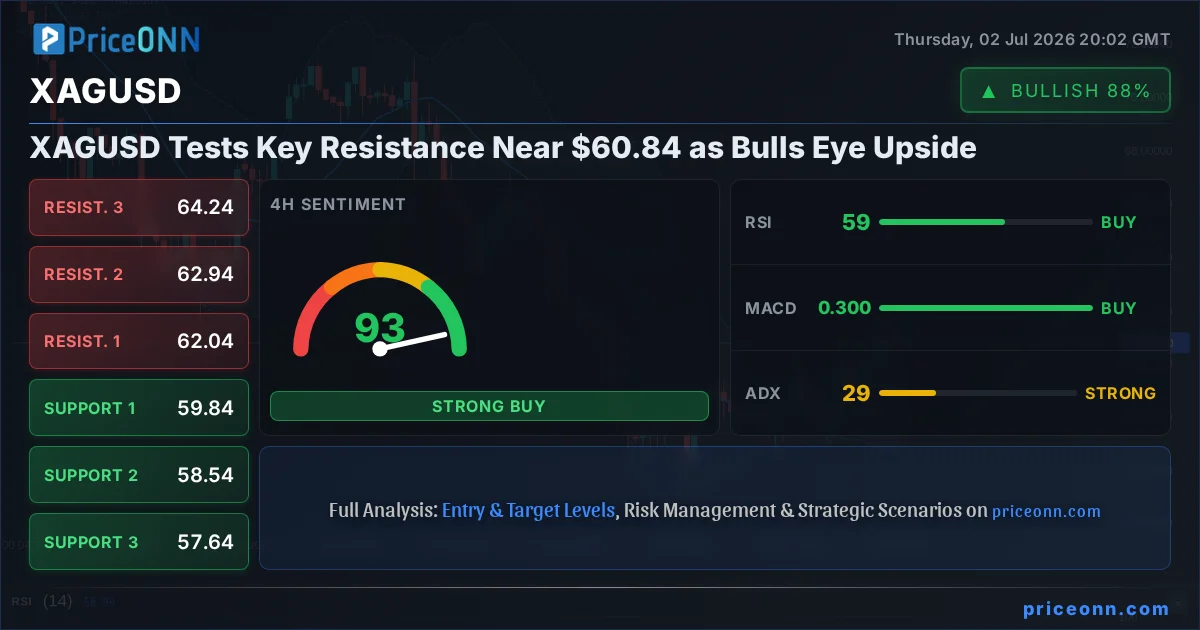
- Key resistance is identified at $60.97 on the 1H chart and $62.04 on the 4H chart, while support lies at $60.46 and $59.84 respectively.
- The RSI at 57.35 (1H) and 59.54 (4H) indicates a bullish inclination, though the Stochastic oscillator on the 1H chart shows a potential pullback signal (%K
- Fundamental factors such as a weakening US Dollar (DXY at 100.9) and ongoing inflation concerns support a bullish outlook for silver.
- Upcoming economic data releases, particularly those impacting interest rate expectations, will be crucial in determining the next directional move for XAGUSD.
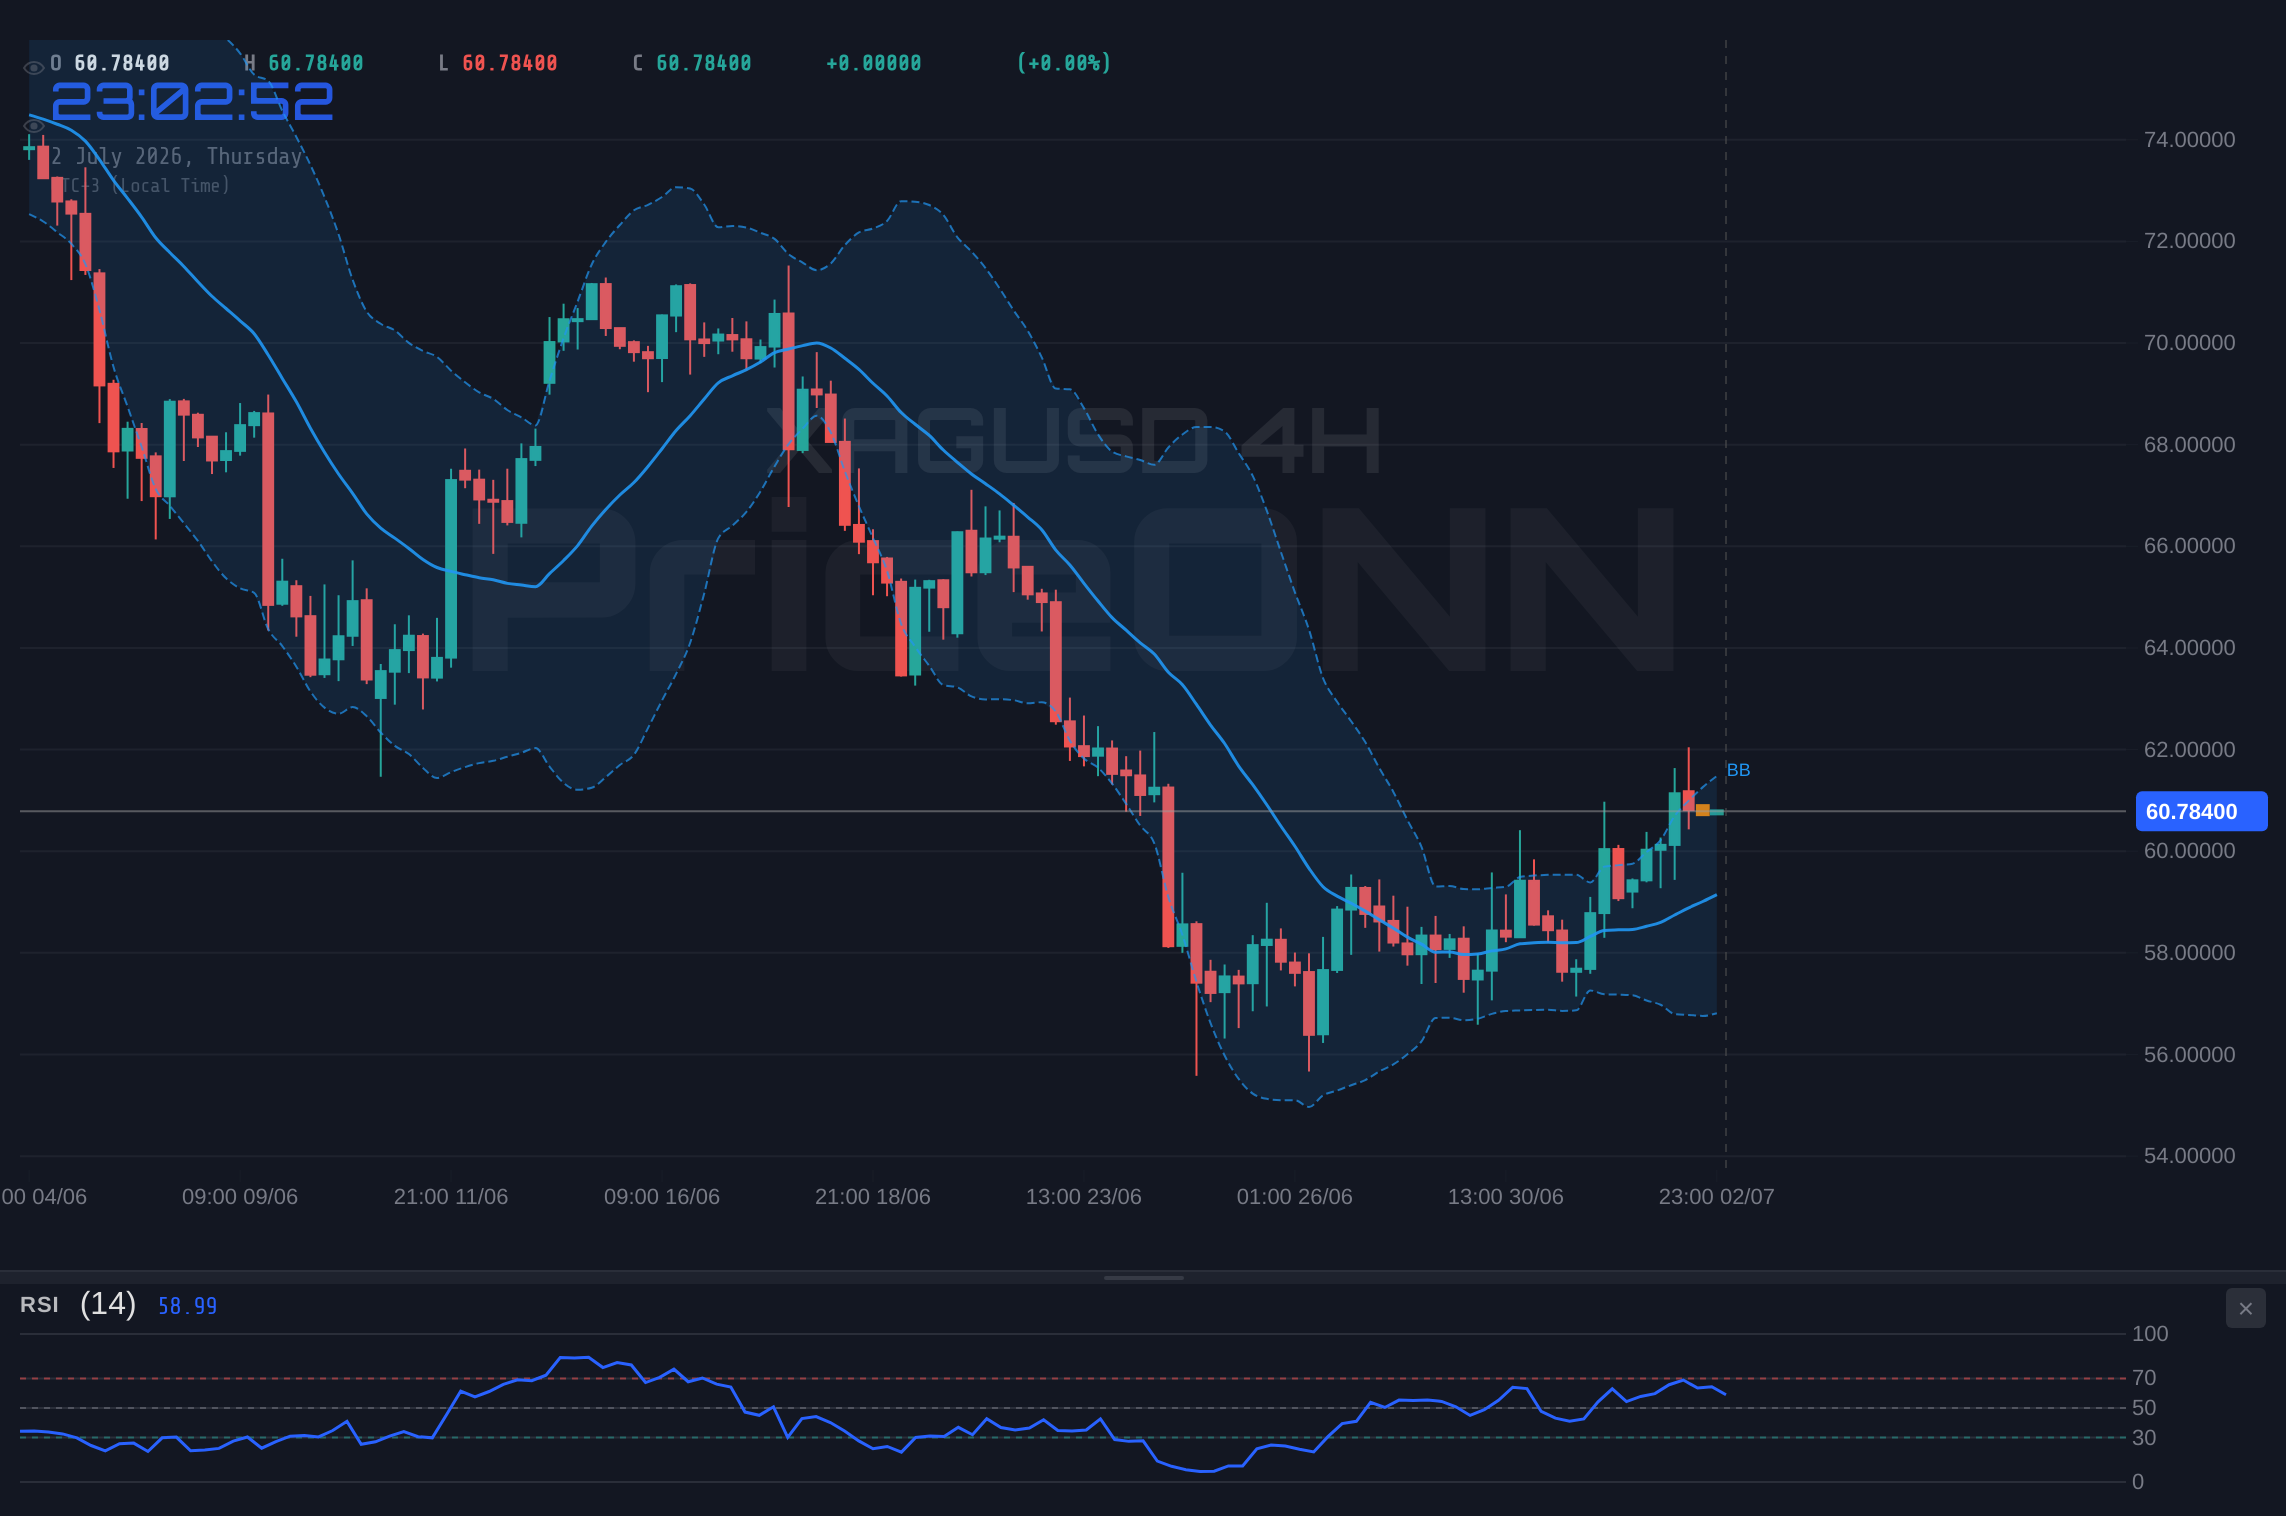
The narrative around silver is currently dominated by a significant upward push, evident in the current price of $60.84. This surge is supported by a confluence of technical signals across multiple timeframes, suggesting that buyers are actively accumulating the precious metal. On the 1-hour chart, silver exhibits a clear bullish trend with an impressive 87% strength, bolstered by a positive MACD momentum and prices trading above the middle Bollinger Band. The ADX at 33.31 further confirms a strong trending environment, indicating that the upward move has considerable force behind it. While the Stochastic oscillator on this timeframe hints at a potential short-term pullback (K=68.61, D=75.49), the overwhelming 'BUY' signals across most indicators on the 1H chart paint a picture of short-term optimism.
Expanding the view to the 4-hour timeframe, the bullish sentiment for XAGUSD continues, albeit with a slightly more neutral overall trend strength of 50%. Here, the price is also comfortably above the middle Bollinger Band, and the MACD remains in positive territory, signaling ongoing upward momentum. The ADX at 30.38 still points to a strong trending market, reinforcing the idea that the current price action is not merely a fleeting spike. The RSI at 59.54 remains in bullish territory, suggesting room for further upside before entering overbought conditions. The Stochastic oscillator on this timeframe, with K=83.01 and D=66.72, strongly supports the prevailing upward trend, indicating that momentum is building. The 7-to-1 'BUY' signal ratio across indicators on this timeframe amplifies the bullish conviction, suggesting that the path of least resistance for silver in the medium term appears to be to the upside.
However, a stark contrast emerges when we shift our focus to the daily timeframe. Here, the trend is classified as neutral with 50% strength, and the technical picture becomes more mixed, even leaning towards caution. The RSI(14) at 42.94 is in the neutral zone but exhibits a downward eğilimi, suggesting that the longer-term upward momentum might be waning. The MACD, while still showing positive momentum, is positioned below its signal line, hinting at potential slowing. Crucially, the Bollinger Bands are positioned below the middle band, indicating a bearish bias on the daily chart, and the ADX at 41.65 signals a strong *downward* trend. This divergence between the shorter timeframes and the daily view is critical. It suggests that while short-term traders are pushing silver higher, the longer-term outlook might be more subdued or even bearish, presenting a significant challenge for sustained rallies. This conflict highlights the importance of carefully managing risk and understanding the prevailing trend across different analytical perspectives.
The fundamental backdrop for precious metals, particularly silver, appears to be constructive, lending credence to the bullish case. The US Dollar Index (DXY) is currently trading at 100.9, showing a daily decline of 0.5%. A weaker dollar typically acts as a tailwind for dollar-denominated commodities like silver, as it becomes cheaper for holders of other currencies. This inverse correlation is a well-established market dynamic. Furthermore, ongoing concerns about inflation, despite recent data, continue to support gold and silver as a hedge against rising prices. While specific inflation figures are not provided in the live data, the general market sentiment often reflects these underlying economic pressures. The fact that Brent crude oil is trading at $71.67 and WTI at $68.86, both showing upward movement, also hints at inflationary pressures or geopolitical risks, which historically benefit safe-haven assets like silver.
The recent news flow also provides context for silver's current strength. A July 2nd report from forex analysis indicated that the Silver price forecast shows XAGUSD climbing to the top of its weekly range as the US Dollar slides to a two-week low. This aligns perfectly with the current price action and the weakening DXY. The report suggests that this upward momentum is being driven by the dollar's slide, reinforcing the importance of monitoring currency markets for clues on silver's next move. Additionally, while not directly about silver, the weakness in EUR/USD near 1.1400 as ECB hike bets recede, and the general pressure on oil prices due to potential market surpluses, create a complex global economic picture. In such an environment, assets perceived as safe havens or inflation hedges, like silver, tend to find support.
From a purely technical standpoint, the immediate resistance for XAGUSD on the 1-hour chart lies at $60.97, followed by $61.19 and $61.48. A decisive break and hold above these levels would be crucial for bulls to maintain their upward trajectory and challenge higher price points. Conversely, immediate support on the 1H chart is found at $60.46, then $60.17 and $59.95. A break below $60.46 could signal a short-term reversal or consolidation. On the 4-hour chart, the resistance levels are more pronounced, with $62.04 standing out as a significant hurdle, followed by $62.94 and $64.24. The support on this timeframe is located at $59.84, $58.54, and $57.64. The daily chart presents a more challenging scenario for bulls, with immediate resistance at $60.99 and significant overhead supply extending to $62.90 and $64.82. The daily support levels are considerably lower, at $57.15, $55.23, and $53.32, underscoring the bearish divergence observed in the daily indicators.
The divergence in signals across timeframes is a classic market scenario that often leads to volatility. On the 1-hour chart, the overall signal is a strong 'BUY' (7 out of 8 indicators), driven by positive MACD momentum and strong ADX readings. The 4-hour chart also leans heavily towards 'BUY' (7 out of 8 indicators), with strong ADX and bullish Stochastic signals. However, the daily chart presents a different story, with a 'SELL' signal (5 out of 8 indicators), a bearish ADX trend at 41.65, and RSI trending downwards. This conflict suggests that short-term traders might be driving the price higher, potentially anticipating a breakout, while longer-term investors may be more cautious or even looking for selling opportunities at higher prices. The ADX value of 41.65 on the daily chart is particularly noteworthy, indicating a very strong trend, but its direction is currently bearish, contrasting sharply with the bullish trends seen on the shorter timeframes.
Considering the interplay of these technical and fundamental factors, the immediate future of XAGUSD appears to hinge on its ability to overcome the resistance levels identified on the 1-hour and 4-hour charts. A sustained push above $60.97 and, more importantly, $62.04 could signal a continuation of the bullish trend, potentially attracting more buyers and pushing prices towards the daily resistance levels. The weakening dollar and potential inflationary pressures provide a favorable macro environment for such a move. However, the bearish divergence on the daily chart cannot be ignored. If silver fails to break decisively above these resistance levels, or if the broader market sentiment shifts towards risk aversion, we could see a pullback towards the immediate support levels, starting with $60.46 on the 1H chart and $59.84 on the 4H chart. The daily chart's strong bearish trend, indicated by the ADX, suggests that any rally could be met with significant selling pressure.
The current market environment for silver is characterized by a tug-of-war between short-term bullish momentum and longer-term bearish technicals. The price of $60.84 represents a crucial battleground. While shorter timeframes are flashing 'BUY' signals, the daily chart's bearish trend strength (ADX 41.65) and downward-sloping RSI are significant headwinds. Investors must remain vigilant, paying close attention to how price action behaves around the immediate resistance levels of $60.97 and $62.04. A failure to break these could lead to a significant retracement, especially given the divergence between the 1H/4H bullish signals and the 1D bearish trend. The broader economic context, particularly the direction of the US Dollar and inflation expectations, will undoubtedly play a pivotal role in shaping the ultimate outcome.
The market sentiment appears to be leaning towards short-term optimism for XAGUSD, driven by a weakening dollar and positive momentum on intraday charts. However, the underlying technical structure on the daily timeframe presents a cautionary tale. The ADX at 41.65 on the daily chart indicates a strong trend, but it is currently a bearish trend, which starkly contrasts with the bullish signals on the 1-hour and 4-hour charts. This divergence is where the real trading edge lies. Traders need to ascertain whether the shorter-term bullish sentiment can overcome the longer-term bearish technicals, or if the daily trend will eventually assert its dominance. The ability of silver to hold above its immediate support levels, such as $60.46 and $59.84, will be critical in determining if the current bullish push is sustainable or merely a temporary reprieve before a potential larger correction.
The economic calendar will be a key determinant in the coming days. Upcoming data releases that influence interest rate policy, such as inflation reports or central bank commentary, will likely dictate the next significant move in the US Dollar and, by extension, silver. If these events signal a more hawkish stance from major central banks, it could strengthen the dollar and put pressure on XAGUSD, aligning with the daily chart's bearish outlook. Conversely, signs of economic cooling or a dovish shift could weaken the dollar further, potentially providing the catalyst for silver to break through its immediate resistance levels and challenge higher targets. The current price of $60.84 is a pivotal point, and the market's reaction to upcoming economic data will be crucial in determining whether silver embarks on a sustained rally or succumbs to the bearish undertones of its longer-term technical picture.
The silver market is at a critical juncture, with XAGUSD trading at $60.84. The bullish momentum on shorter timeframes is undeniable, supported by a weaker dollar and positive short-term technicals. However, the significant bearish divergence on the daily chart, highlighted by a strong ADX trend in the opposite direction and a downward-sloping RSI, presents a substantial challenge. The battle between bulls and bears will likely be decided by silver's ability to decisively break key resistance levels at $60.97 and $62.04, and by the forthcoming economic data that shapes the global monetary policy outlook. Traders must navigate this divergence with caution, employing robust risk management strategies as the market digests these conflicting signals.
Frequently Asked Questions: XAGUSD Analysis
What happens if XAGUSD breaks above $62.04 resistance?
A sustained break above $62.04 on the 4-hour chart could signal a continuation of the bullish trend, potentially targeting the daily resistance levels around $62.90 and $64.82, supported by a weaker dollar.
Is RSI at 59.54 a buy signal for XAGUSD right now?
The RSI at 59.54 on the 4-hour chart indicates bullish momentum but is not yet in overbought territory. While it supports the current upward move, confirmation from other indicators and price action above key resistance is advised before initiating a buy.
How will the daily chart's ADX at 41.65 affect XAGUSD's trend?
The ADX at 41.65 on the daily chart signifies a strong trend, but its bearish direction conflicts with shorter-term bullish signals. This suggests that any rallies might face significant selling pressure from longer-term investors, potentially capping upside.
How will upcoming economic data affect XAGUSD this week?
Economic data influencing interest rate policy, such as inflation or central bank statements, will be critical. A hawkish outlook could strengthen the USD and pressure XAGUSD, aligning with the daily bearish trend, while dovish signals could support a move higher.
Track markets in real-time
AI-powered analysis, technical indicators and real-time price data.
Join Our Telegram Channel
Breaking market news, AI analysis and trading signals instantly.
Join Channel