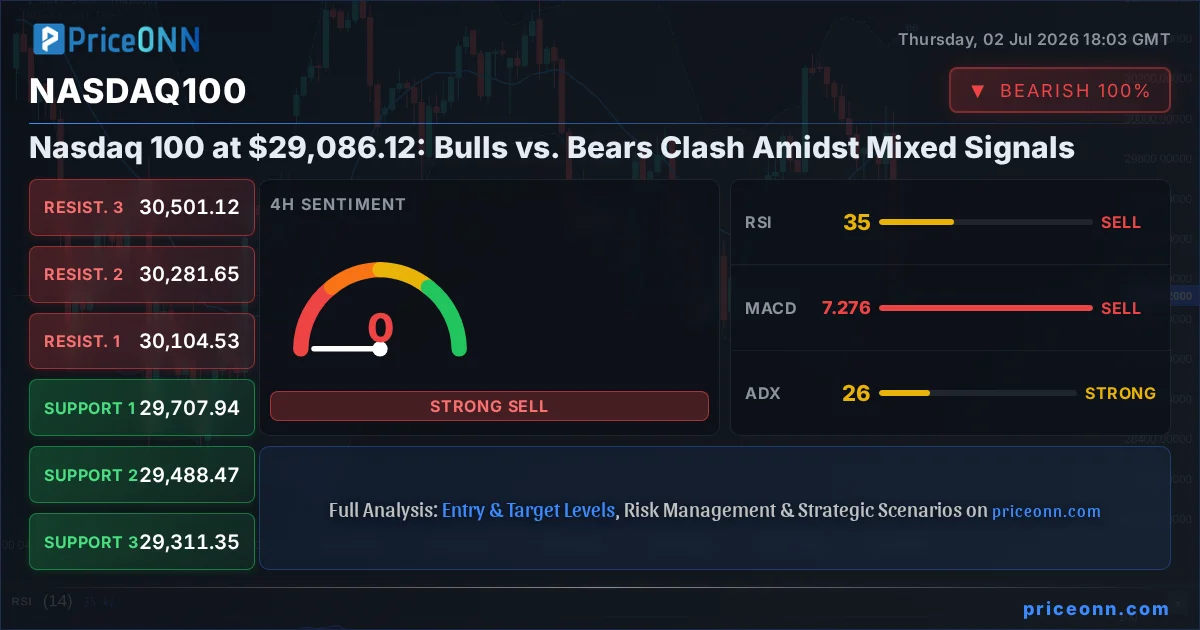
The Nasdaq 100 is currently locked in a fierce battle around the $29,086.12 mark, a pivotal zone where bulls and bears are wrestling for control. This critical level, representing a confluence of technical factors and shifting market sentiment, has become the focal point for traders navigating today's complex financial landscape. With the index showing a neutral trend on the daily chart but exhibiting strong momentum in shorter timeframes, the question isn't just where it's going, but what signals are truly reliable in this indecisive environment. A deep dive into the latest market data reveals a nuanced picture, where conflicting indicators and the ever-present influence of broader market correlations demand careful consideration.
- Nasdaq 100 hovers at $29,086.12 with mixed daily signals; RSI at 46.02 suggests waning bearish momentum.
- Critical support for the Nasdaq 100 is identified at $29,055.73, while resistance looms at $30,139.43.
- MACD histogram shows positive momentum, but ADX at 17.2 indicates a weak trend, signaling potential consolidation.
- DXY at 100.9 is showing a bearish lean on shorter timeframes, potentially offering some support to risk assets like the Nasdaq 100.
The Nasdaq 100's current position at $29,086.12 presents a classic bull vs. bear scenario. On one hand, the 1-hour and 4-hour charts display strong bullish signals, with positive MACD momentum and RSI readings generally above 50, suggesting short-term buying interest. The 4-hour trend strength is rated at 50%, indicating a neutral stance, yet the sheer number of 'Buy' signals across these shorter timeframes might tempt some into believing a sustained rally is imminent. However, the daily chart paints a more cautious picture. The trend is also neutral (50% strength), but the RSI at 46.02 is drifting lower, and the MACD is below its signal line, hinting at underlying weakness. This divergence between short-term optimism and daily caution is precisely what creates the current market tension.
Let's dissect the bull case first. Proponents of a rising Nasdaq 100 point to the resilience shown in overcoming the $29,055.73 support level on the 1-hour chart. The fact that the index is trading above its 1-hour middle Bollinger Band and the MACD histogram is in positive territory are often seen as precursors to upward movement. The Stochastic Oscillator, while showing a slight bearish cross on the 1-hour (K=4.37, D=40.04), has a strong 'Buy' signal on the 4-hour chart (K=26.86, D=27.49), indicating potential for a bounce. Furthermore, the broader market context offers some succor. The Dollar Index (DXY), currently at 100.9, shows a bearish trend on the 1-hour chart, which historically can correlate with a risk-on environment, potentially boosting tech-heavy indices like the Nasdaq 100. With the SP500 showing a strong bullish trend on the 1-hour and 4-hour charts, a general appetite for risk assets could lift the Nasdaq 100 too.
However, the bear case is far from insignificant. The most compelling argument against a bullish outlook lies in the daily timeframe's technical indicators. The RSI at 46.02, while not deeply oversold, is trending downwards, suggesting that selling pressure is gradually increasing. The MACD on the daily chart is also showing negative momentum, with the histogram below the signal line, indicating that the recent upward moves might be mere retracements within a larger downtrend. The ADX on the daily chart stands at a significant 47.51, confirming a strong downtrend. This contradicts the weaker ADX readings on the shorter timeframes (17.2 on 1H, 26.09 on 4H), highlighting the potential for a bearish reversal. The Nasdaq 100 is currently trading below its daily middle Bollinger Band, a bearish sign, and the Stochastic on the daily chart (K=47.06, D=41.47) is showing a bullish crossover, but this is occurring in a lower range, which can sometimes precede further downside.
The correlation with other market instruments is also a key battleground. While the DXY's short-term weakness might be a tailwind, its daily chart shows a rising RSI and a bullish trend with ADX at 40.89, suggesting that any dollar weakness might be temporary. The SP500, despite bullish signals on shorter timeframes, has a strong bearish trend (ADX 47.51) on the daily chart, indicating that the broader equity market is under pressure. Similarly, the Nasdaq 100's correlation with the tech-heavy Nasdaq 100 index is usually strong, and the daily chart for Nasdaq 100 shows a significant bearish trend. This pervasive bearishness across major indices on the daily timeframe cannot be ignored by even the most optimistic traders.
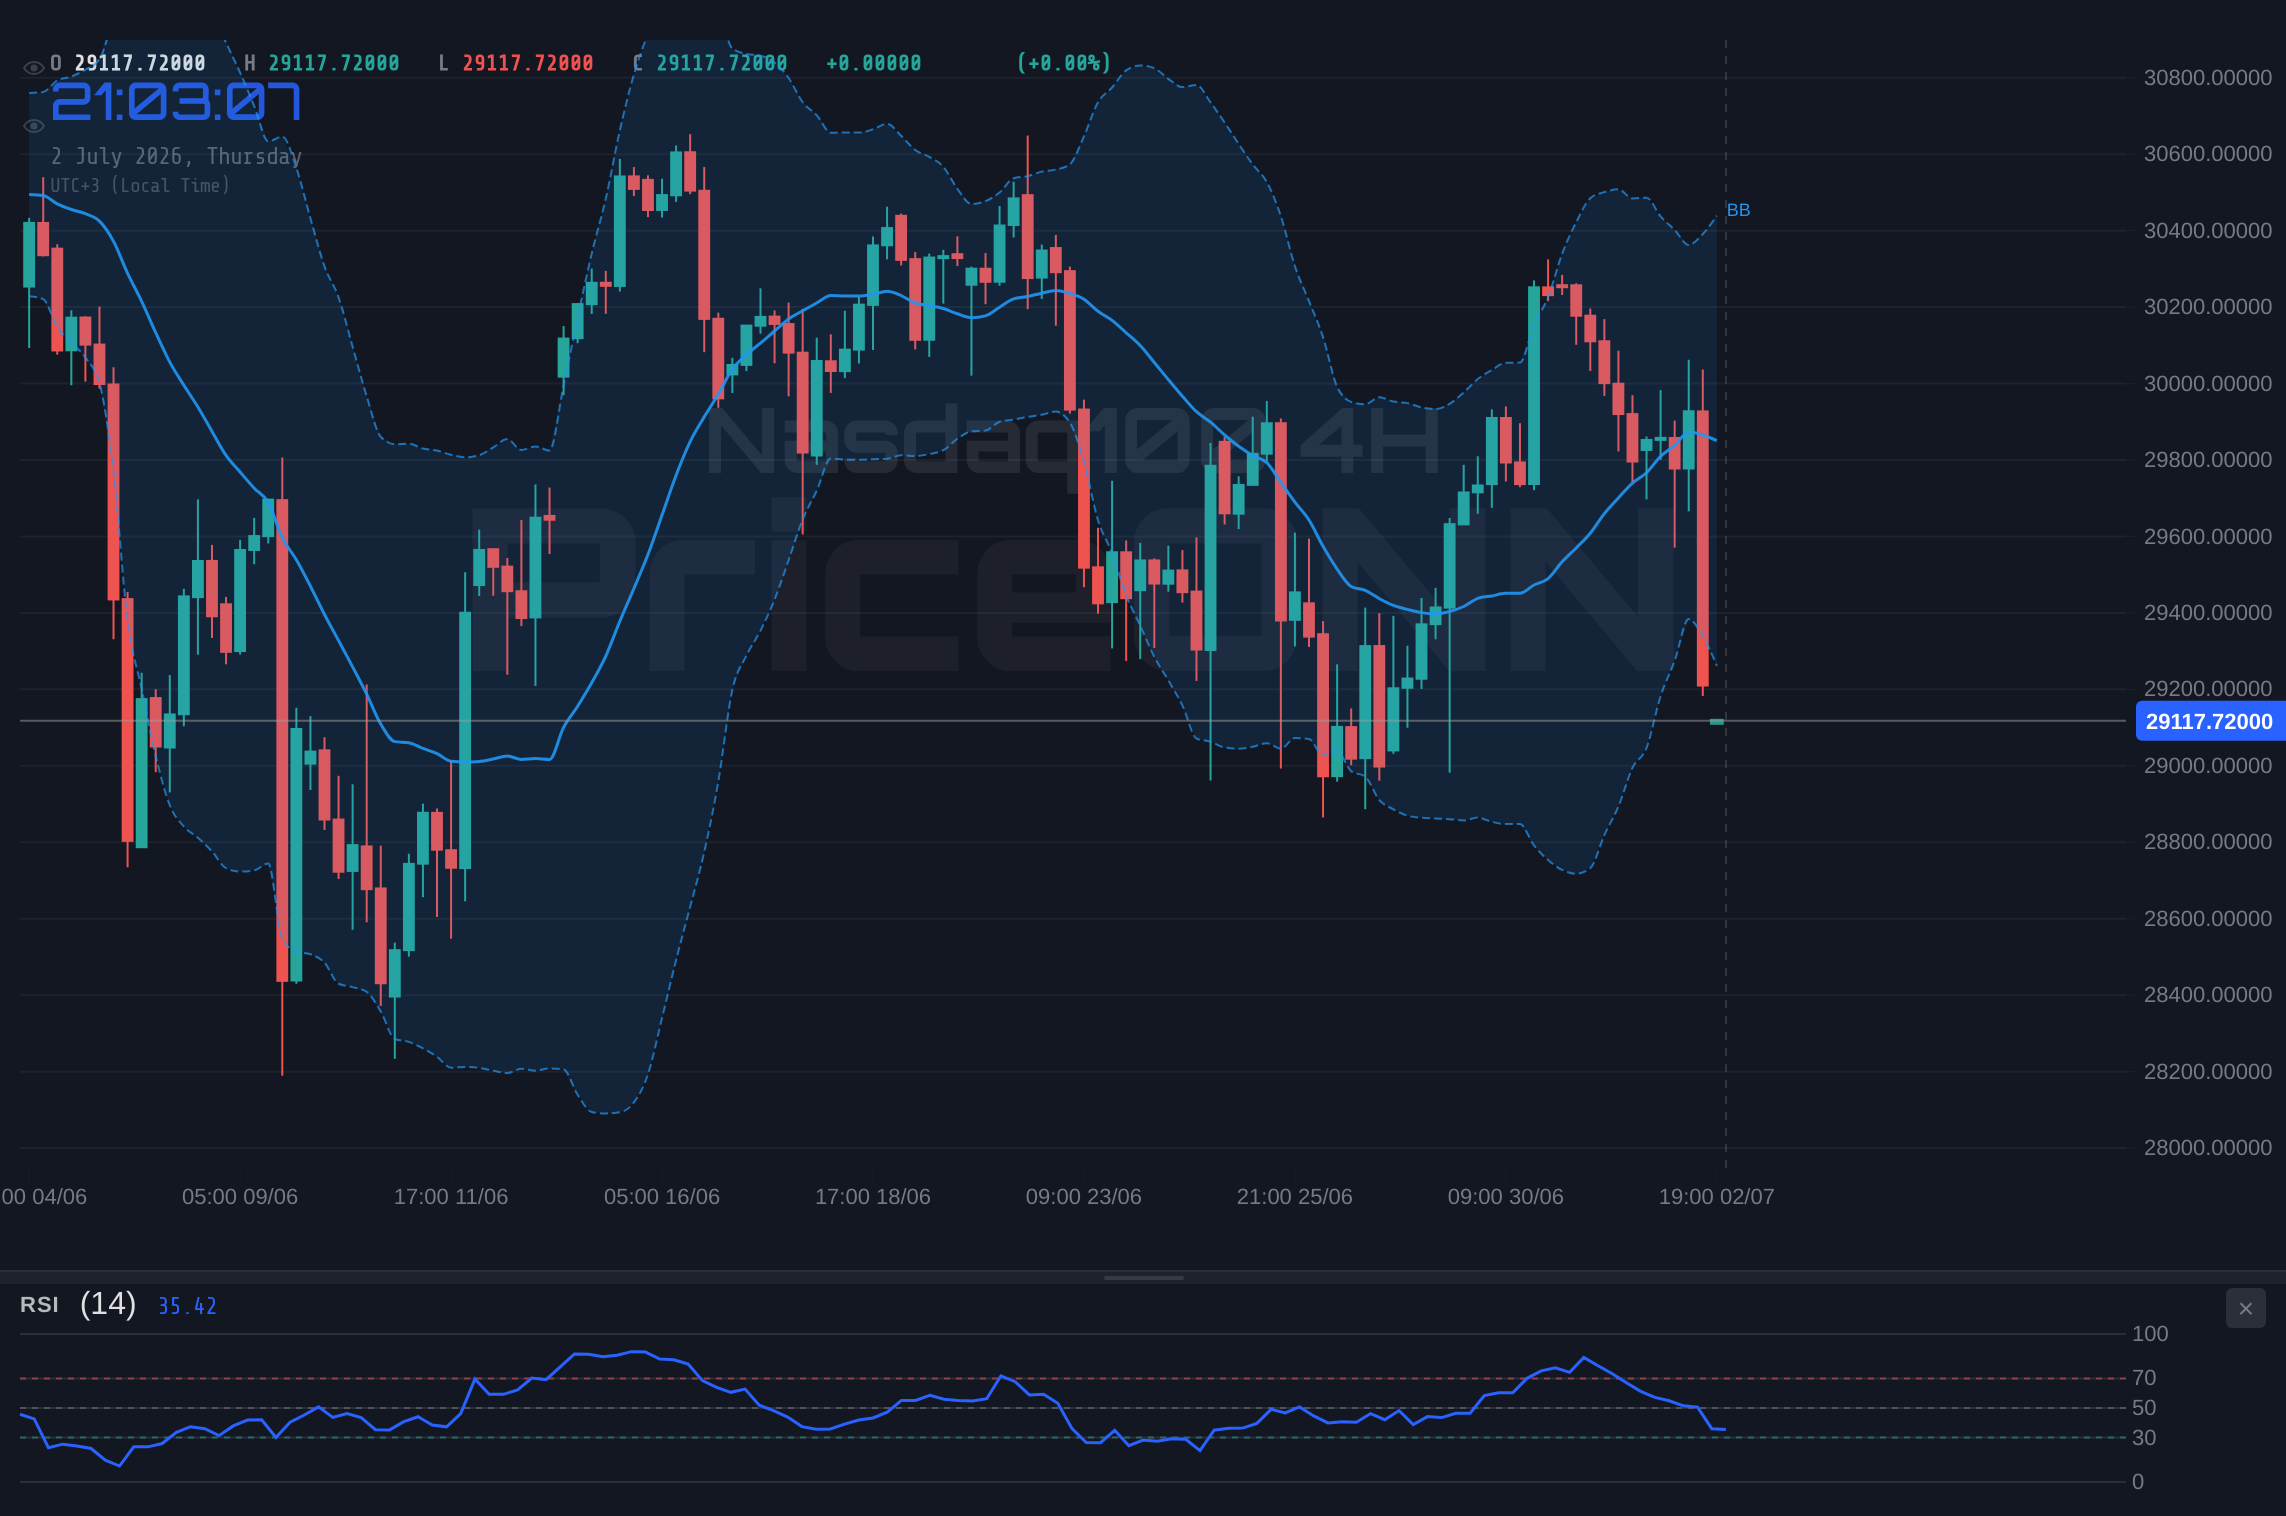
Looking at the specific price action, the Nasdaq 100's daily chart shows a clear downtrend channel. The current price of $29,086.12 is struggling to break above the resistance at $29,139.43 (R1). If it fails to do so, the next logical move would be a retest of the support at $29,055.73 (S1). A decisive break below this level, confirmed by increased volume and bearish indicator alignment on shorter timeframes, could open the door for a steeper decline towards $28,865.07 (S3). On the flip side, a sustained push above $29,139.43, ideally with confirmation from the RSI moving above 50 and MACD histogram expanding positively on the daily chart, could signal a shift. Such a move would then target the next resistance at $30,139.43 (R2).
The intraday dynamics add another layer of complexity. On the 1-hour chart, the Nasdaq 100 is showing signs of consolidation, with the ADX at a relatively low 17.2. This suggests that the current price action might be a period of indecision before a more significant move. The Stochastic Oscillator's bearish crossover on this timeframe is a red flag for bulls, hinting that the immediate upward momentum might be stalling. However, the sheer number of buy signals on the 1-hour (7 buys, 1 sell) and 4-hour (7 buys, 1 sell) charts cannot be entirely dismissed. It indicates strong buying pressure at lower levels, which could provide a floor for the price action.
The interplay of indicators on different timeframes presents a classic case of conflicting signals. For instance, the daily RSI at 46.02 suggests a bearish bias, while the 1-hour RSI at 26.16 points towards oversold conditions, implying a potential bounce. Similarly, the daily MACD is bearish, but the 1-hour MACD is bullish. This divergence is common in choppy or consolidating markets. Traders must decide which timeframe's signals hold more weight or wait for confluence across multiple timeframes. The ADX reading on the daily chart (47.51) strongly indicates a downtrend, suggesting that any bullish signals on shorter timeframes might be short-lived counter-trend moves.
Considering the current technical landscape, the bear case appears to have more weight due to the dominant daily trend signals. The strong ADX on the daily chart, coupled with the daily RSI and MACD readings, suggests that the path of least resistance is still downwards. Even if shorter-term charts show bullish tendencies, they could be mere traps within a larger bearish structure. The fact that the Nasdaq 100 is currently testing resistance levels that have historically capped rallies adds to the bearish conviction. The market often exhibits 'trend persistence,' meaning that established daily trends tend to continue until strong evidence suggests otherwise.
However, the possibility of a bullish reversal cannot be entirely ruled out. If the Nasdaq 100 can decisively break above the $29,139.43 resistance and sustain the move, it would invalidate the short-term bearish outlook. Confirmation would come from the daily RSI moving above 50 and the MACD histogram turning positive. The current low ADX on the 1-hour chart (17.2) could also indicate that the market is consolidating before a potential breakout to the upside, especially if broader market sentiment shifts positively. The correlation with a potentially weakening DXY could also fuel such a move, as seen in the 1-hour and 4-hour bullish signals.
The neutral scenario, perhaps the most likely in the short term given the conflicting signals, involves the Nasdaq 100 continuing to trade within a range around $29,086.12. This would be characterized by choppy price action, with attempts to break higher being sold into and attempts to break lower finding buyers. This could persist until a significant catalyst, such as upcoming economic data or a clear shift in central bank rhetoric, forces a decisive move. The weak ADX on the 1-hour chart supports this possibility, indicating a lack of directional conviction.
The key levels provided by the market data are crucial for navigating this uncertainty. Support at $29,055.73, $28,865.07, and $28,525.73 forms the lower boundary. Resistance at $29,139.43, $30,139.43, and $30,482.82 defines the upper boundary. A break below the immediate support at $29,055.73 would likely trigger further selling pressure, while a sustained move above $29,139.43 could signal a potential reversal. The current price of $29,086.12 sits precariously between these levels, underscoring the indecision.
Bearish Scenario: The Trend Resumes
65% ProbabilityNeutral Scenario: Range-Bound Consolidation
25% ProbabilityBullish Scenario: The Reversal Takes Hold
10% ProbabilityFrequently Asked Questions: Nasdaq100 Analysis
What happens if Nasdaq 100 breaks below $29,055.73 support?
A decisive close below $29,055.73 on the 1-hour chart, especially with confirmation from daily indicators like a falling RSI and negative MACD momentum, would likely trigger further selling pressure. This could lead to a retest of the $28,865.07 support level as bears attempt to regain control.
Should I buy Nasdaq 100 at current levels of $29,086.12 given the mixed signals?
Buying at $29,086.12 requires caution due to conflicting signals across timeframes. A high-probability entry for bulls would ideally wait for a confirmed break above $29,139.43 resistance, with daily indicators turning bullish. Otherwise, risk management is paramount, with a tight stop loss below $29,055.73.
Is the daily RSI at 46.02 a sell signal for Nasdaq 100 right now?
An RSI of 46.02 on the daily chart is not an immediate sell signal but indicates bearish momentum is present and trending downwards. It suggests that any rallies might face selling pressure, and it's not yet in oversold territory, leaving room for further downside if selling intensifies.
How will the current DXY trend affect Nasdaq 100 this week?
The DXY's bearish trend on the 1-hour chart (at 100.9) could offer some short-term support to the Nasdaq 100 by fostering a risk-on sentiment. However, the DXY's daily chart shows a strong bullish trend, implying that any dollar weakness may be temporary. Traders should monitor the DXY's ability to hold its daily support levels for a clearer picture.
The Nasdaq 100 is at a critical crossroads near $29,086.12. While shorter timeframes offer glimmers of hope for the bulls, the daily chart's persistent bearish signals, particularly the strong ADX and downward-trending RSI, suggest caution is warranted. The market is currently stuck between conflicting indicators, making a decisive move uncertain in the immediate term. Patience and rigorous risk management will be key. Traders should look for clear confirmation, ideally a sustained break above daily resistance or a confirmed breakdown below daily support, before committing significant capital.
Track markets in real-time
AI-powered analysis, technical indicators and real-time price data.
Join Our Telegram Channel
Breaking market news, AI analysis and trading signals instantly.
Join Channel