

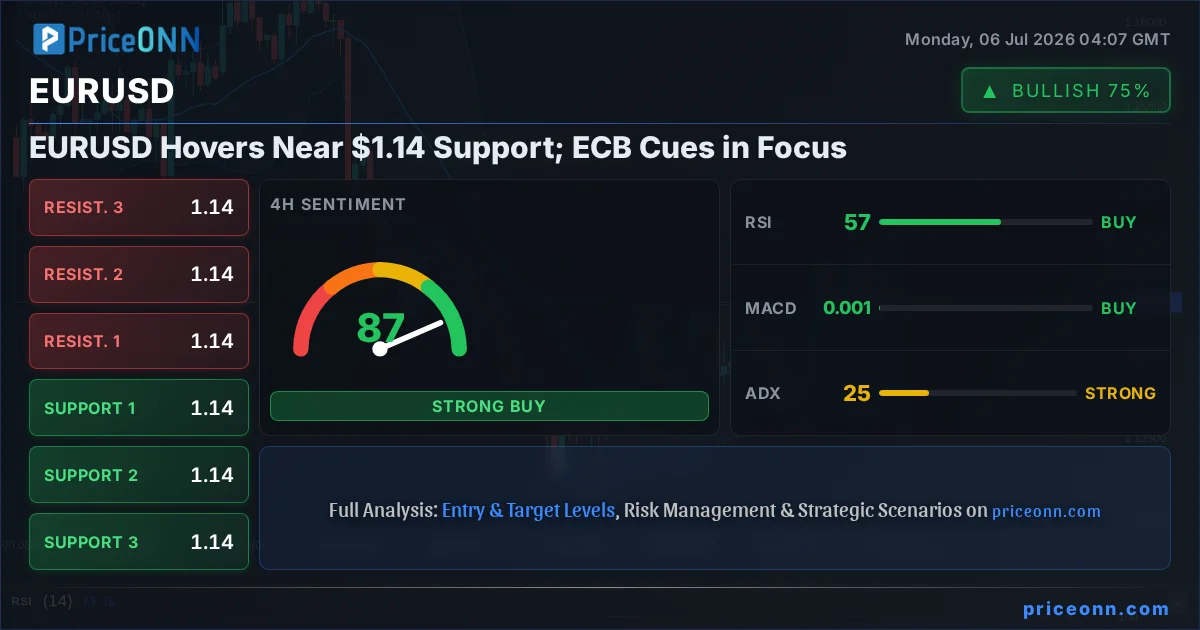
The EUR/USD pair is currently locked in a tight range, hovering precariously close to the critical $1.14 support level. This stalemate isn't born out of indecision alone; it's a calculated pause as the market digests a complex tapestry of technical signals and anticipates crucial directional clues from the European Central Bank (ECB). With the daily chart showing a neutral trend but with underlying strength in shorter timeframes, the $1.14 mark has become a focal point, a level that could dictate the next significant move for the Euro.
- EUR/USD is testing the $1.14 support level, with the 1H RSI at 45.91 indicating bearish momentum.
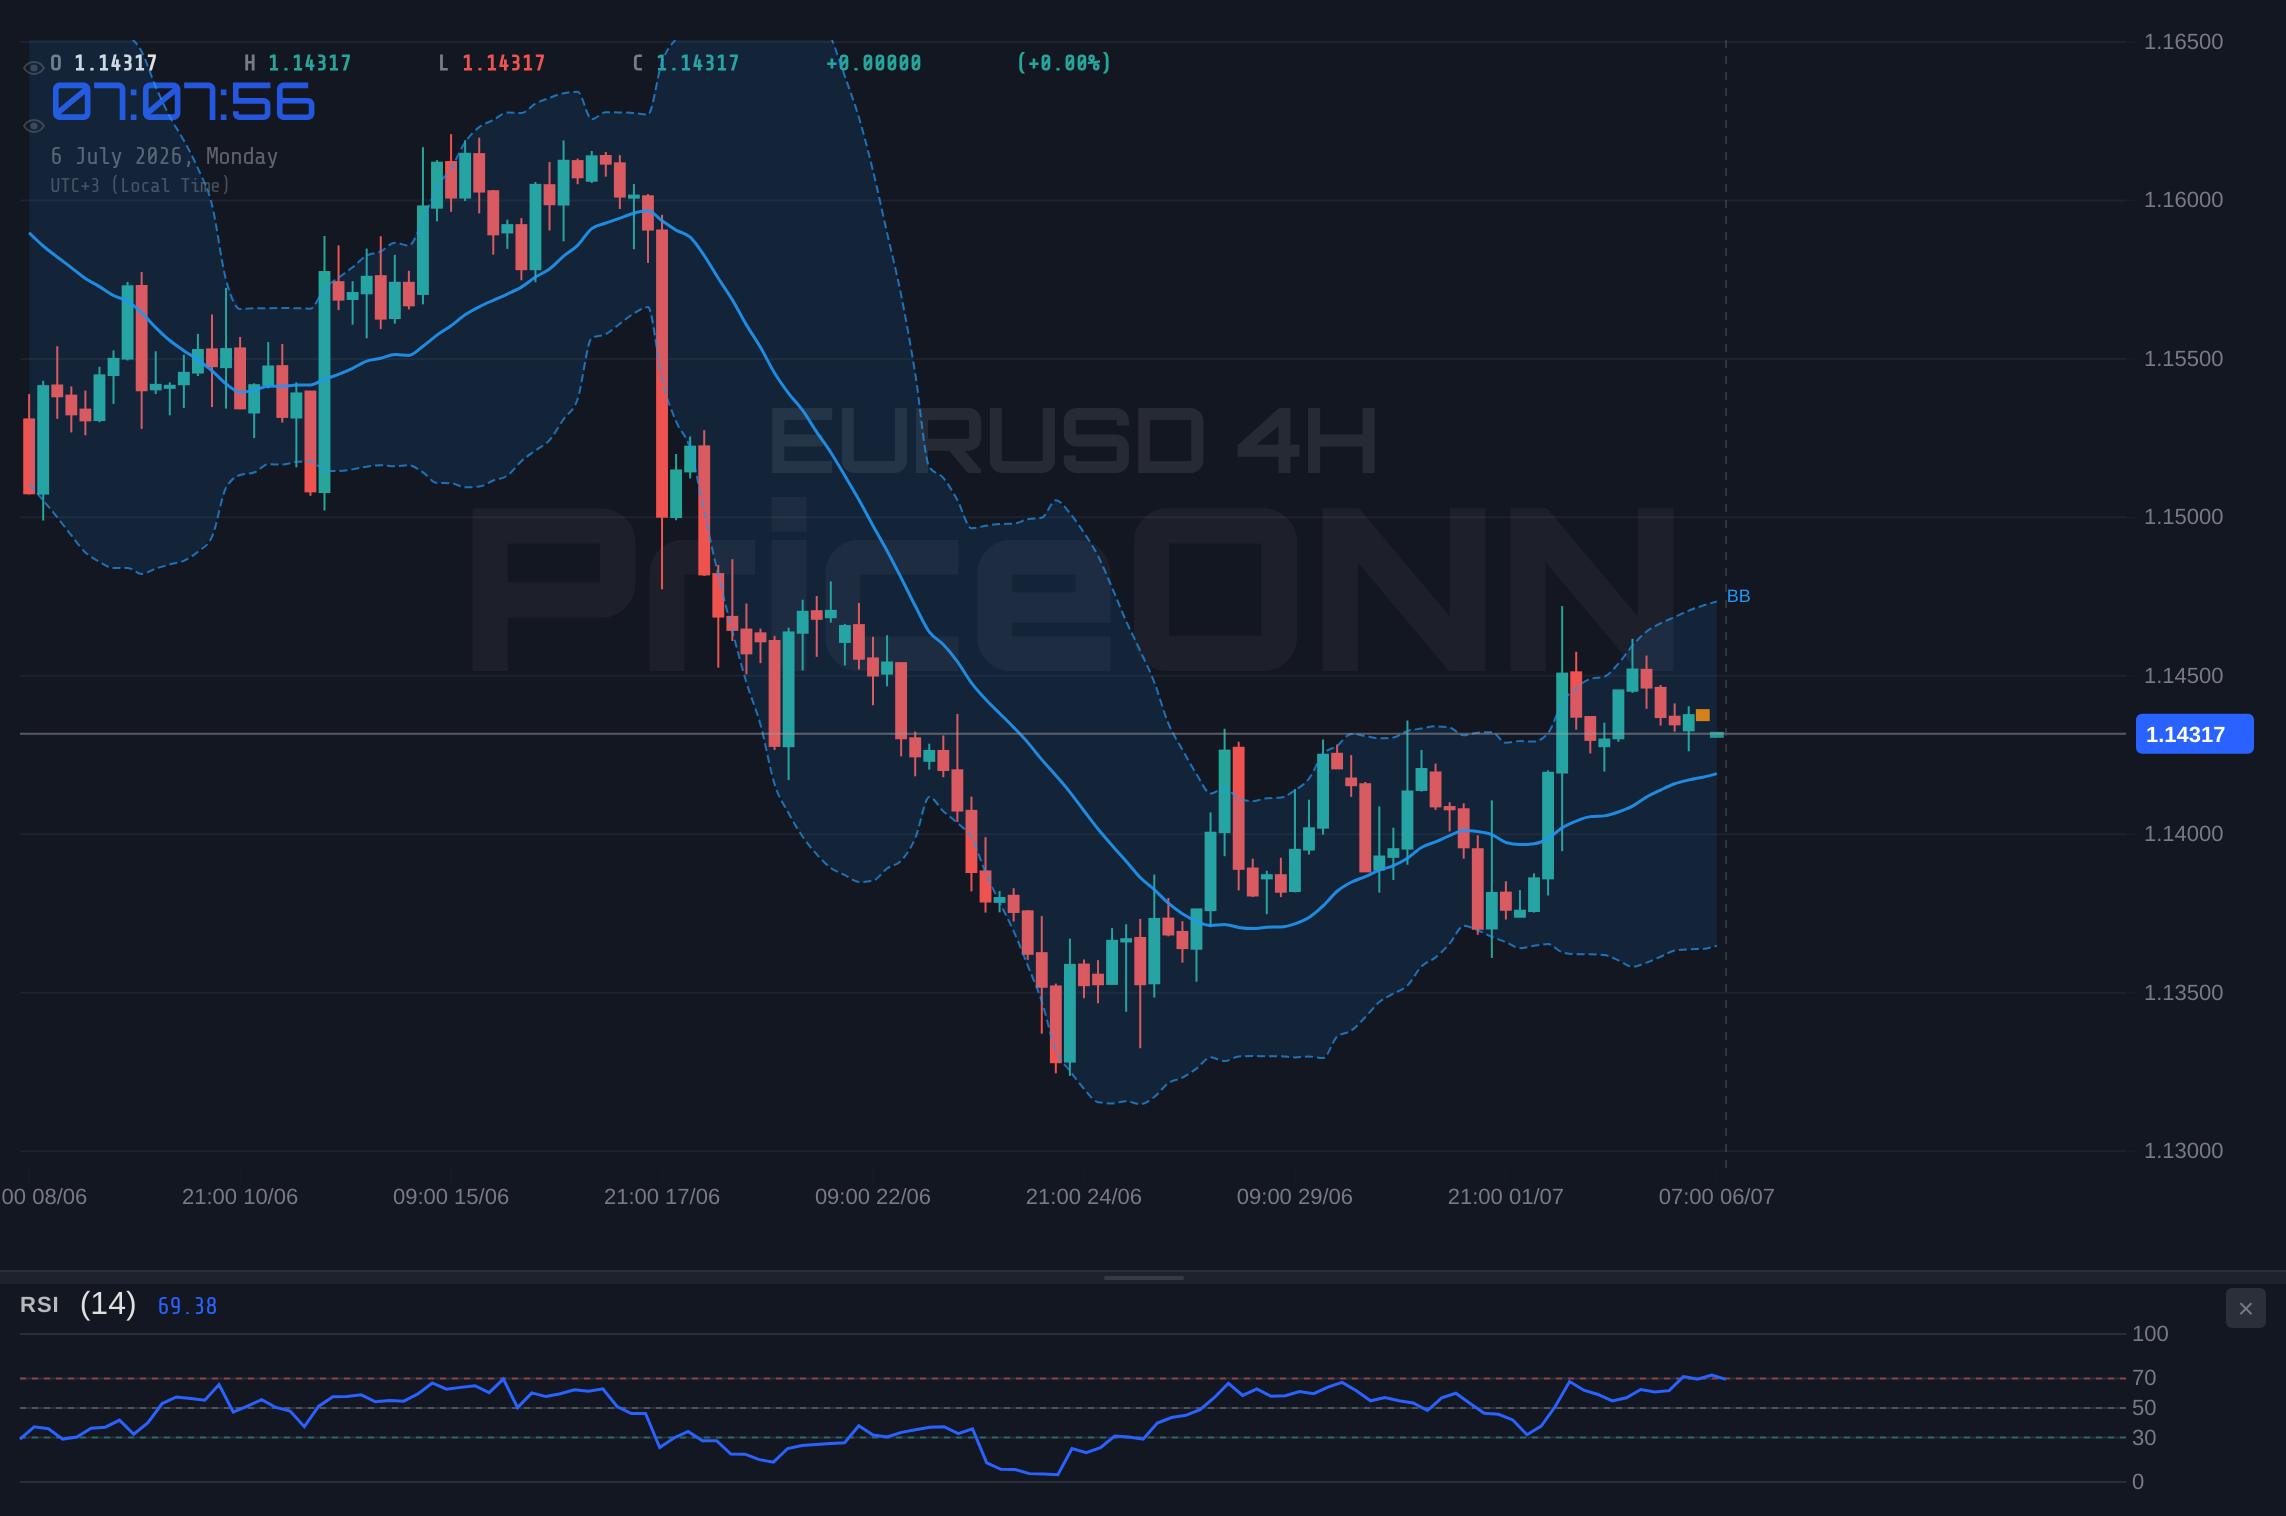
- The 4H chart shows a strong bullish trend (ADX 25.43) with the pair trading above its middle Bollinger Band, suggesting potential upside.
- ECB Governing Council member Emmanuel Moulin's recent comments suggest a 'good position' after rate hikes, but market awaits further clarity.
- The US Dollar Index (DXY) is showing mixed signals across timeframes, currently at 100.94, influencing EUR/USD's correlation.
The current technical landscape for EUR/USD paints a picture of cautious equilibrium, yet beneath the surface, forces are at play that could soon shatter this delicate balance. On the 1-hour chart, the pair is teetering, with an RSI reading of 45.91 suggesting a slight bearish bias, and the MACD histogram lurking below its signal line. Stochastic oscillators are also leaning towards a sell signal, with the %K line below the %D line. This short-term bearish momentum, however, is juxtaposed against a more robust picture on the 4-hour timeframe. Here, the ADX at 25.43 signals a strong upward trend, and the price is comfortably above the middle Bollinger Band, pointing towards potential gains. This duality - short-term weakness versus medium-term strength - is precisely what makes the $1.14 support level so pivotal right now.
Understanding the interplay between different timeframes is crucial for any trader navigating these choppy waters. While the 1H chart might be whispering caution, the 4H chart is shouting potential opportunity. This conflict often resolves when one timeframe's signal gains dominance, or when external factors provide a decisive push. The daily chart, currently neutral with an ADX of 32.94 suggesting a strong downtrend, adds another layer of complexity. It highlights that the longer-term trend might still be bearish, making any upside on the 4H a potential counter-trend move or the start of a significant reversal. The key will be how price action behaves around the $1.14 support. A firm hold here, especially if accompanied by bullish divergences or confirmed by a break above immediate resistance, could validate the 4H bullish signals. Conversely, a decisive break below $1.14 could confirm the daily bearish bias and open the door for further downside.
The US Dollar Index (DXY) is a critical counterpart in this narrative. Currently trading around 100.94, its movements often dictate the direction of major currency pairs like EUR/USD. The DXY exhibits its own temporal discrepancies: a bullish signal on the 1H chart, but a bearish one on the 4H, and a bullish signal on the daily. This mixed picture for the dollar itself contributes to the indecision seen in EUR/USD. Generally, a strengthening dollar, as suggested by the 1H and 1D DXY trends, would typically exert downward pressure on EUR/USD. However, the current price action around $1.14 suggests that either the dollar's strength is being tempered by Euro-specific factors or market participants are anticipating a shift in monetary policy that could favor the Euro. Traders are keenly watching how the DXY performs around its own key levels, as this will undoubtedly spill over into EUR/USD.
The fundamental backdrop, particularly concerning the European Central Bank (ECB), is the wildcard that could resolve this technical ambiguity. ECB Governing Council member Emmanuel Moulin recently stated that the central bank is in a "good position" following its June rate hike. This suggests a degree of confidence from policymakers, potentially hinting at a pause in aggressive tightening or at least a data-dependent approach. However, the market will be dissecting every word from ECB officials for any subtle shifts in tone regarding inflation and growth. Any hint of dovishness, even if couched in cautious language, could weaken the Euro. Conversely, a more hawkish stance, emphasizing the need to combat persistent inflation, could bolster the single currency and help EUR/USD reclaim higher ground. The market's reaction to these cues will be swift and decisive.
Looking at the broader economic calendar, upcoming data releases will be crucial. While the immediate focus is on ECB commentary, any significant economic news from the US or the Eurozone could act as a catalyst. For instance, recent US Non-Farm Payrolls data (NFP) has shown volatility in USD/JPY, indicating how sensitive currency pairs are to employment figures. If upcoming US data points to a weakening economy, it could put pressure on the dollar, indirectly supporting EUR/USD. Conversely, strong European data could reinforce the ECB's stance and provide further impetus for a Euro rally. The interplay between these macroeconomic releases and central bank policy expectations forms the fundamental narrative that technical traders will be watching to confirm their chart-based strategies.
The immediate price action around the $1.14 support is where the rubber meets the road for short-term traders. Support levels at $1.14284, $1.14237, and $1.14207 on the 1H chart are being tested. A failure to hold these levels could lead to a rapid descent towards the 4H support zone, starting with $1.1431, $1.14272, and then $1.14221. However, the presence of strong buying interest in the 4H timeframe, indicated by its bullish trend and positive MACD, suggests that sellers might face resistance. Resistance levels on the 1H chart are seen at $1.14361, $1.14391, and $1.14438. A break above these could signal a shift in short-term momentum, potentially aligning with the 4H bullish bias and setting the stage for a move towards the daily resistance zone, which begins at $1.14577.
For those focusing on longer-term trends, the daily chart offers a more cautious perspective. The ADX at 39.03 on the daily timeframe indicates a strong downtrend, despite the MACD being positive and the Bollinger Bands showing an upward eğilim. This divergence between trend strength and momentum indicators suggests that the underlying downtrend might be losing steam, but a clear reversal signal is yet to emerge. The RSI at 46.06 is also leaning bearish. This means that while the 4H chart might offer short-term trading opportunities, the daily trend still requires respect. Any significant move higher would need to overcome the daily resistance cluster starting at $1.14577 and ideally be confirmed by a shift in daily indicators, such as the RSI moving decisively above 50 and the MACD crossing its signal line from below.
The recent news flow adds another layer of context. Comments from ECB's Moulin, suggesting the bank is in a "good position" after its June rate hike, provide a subtle hint of confidence. However, this doesn't negate the ongoing inflation concerns that necessitate careful monitoring of economic data. The fact that NZD/USD saw a relief rally post-US NFP data, only to decline later, highlights the fickle nature of market sentiment and the importance of sustained economic trends over single data points. Similarly, the volatility in USD/JPY above 162, driven by weak US employment data, underscores how macroeconomic surprises can quickly alter currency pair dynamics. These events serve as reminders that technical setups can be invalidated by fundamental shifts.
Considering the current technical setup and the market's anticipation of ECB cues, a balanced approach is warranted. While the 4H chart presents a bullish case with an ADX of 38.6 and a positive MACD, the short-term 1H indicators and the daily trend's strength (ADX 39.03) suggest caution. The $1.14 support level is the immediate battleground. A failure to hold this crucial level could see EUR/USD retest lower supports, potentially targeting the $1.14221 mark on the 1H or even deeper if selling pressure intensches. Conversely, a successful defense of $1.14, coupled with positive ECB rhetoric or strong European economic data, could ignite a rally towards the $1.14361 to $1.14438 resistance zone on the 1H chart, aligning with the more optimistic 4H outlook.
The ADX indicator across all timeframes presents an interesting dichotomy. On the 1H, it's at 18.74, indicating a weak trend, which aligns with the choppy price action. However, on the 4H, it jumps to 25.43, signaling a strong trend, and on the daily, it's at 32.94, also indicating a strong trend. This suggests that while short-term moves might be range-bound, the underlying medium to long-term trend, particularly on the 4H, has some conviction. The key question for traders is whether the short-term weakness will be absorbed by the stronger 4H trend or if the bearish signals on the 1H and the persistent daily downtrend will eventually prevail. The $1.14 support level is the linchpin in this technical puzzle.
Given the confluence of mixed signals and the anticipation of central bank commentary, the market is in a state of flux. The Stochastic oscillators on the 1H and 4H charts are particularly noteworthy. On the 1H, they are in a downward trajectory, confirming the bearish momentum. However, on the 4H, they are in the overbought region but showing a downward cross (%K
The current price action around $1.14 is critical. If this support holds, the bulls will look to push towards the immediate 1H resistance at $1.14361 and potentially higher. The 4H chart's bullish trend, supported by an ADX of 25.43, provides the ammunition for such a move. However, if $1.14 gives way, the bears will likely target the 4H support at $1.14221, and possibly deeper if the daily bearish trend reasserts itself. The market sentiment, currently influenced by mixed DXY signals and awaiting ECB guidance, is the ultimate arbiter of which scenario plays out. Traders should remain vigilant, manage risk tightly, and wait for clear confirmation before committing to a direction.
The strategy here involves closely monitoring the $1.14 support. A bounce from this level, confirmed by bullish price action and potentially positive ECB news, could signal a trade towards the $1.14577 daily resistance. Conversely, a sustained break below $1.14, especially with increasing volume and bearish confirmation from indicators like the 1H RSI falling further, could open up a short trade targeting lower levels. The key is not to anticipate, but to react to price action and fundamental developments as they unfold. Patience is paramount, as the market often presents clearer opportunities after initial uncertainty is resolved.
Bearish Scenario: Support Breakout
65% ProbabilityBullish Scenario: Support Defense & ECB Boost
25% ProbabilityNeutral Scenario: Consolidation Around $1.14
10% ProbabilityFrequently Asked Questions: EURUSD Analysis
What happens if EURUSD breaks below the $1.14207 support level?
A break below $1.14207 on the 1H chart would invalidate the bullish setup and likely trigger a move towards the $1.14158 daily support. This scenario is assigned a 65% probability, indicating that bears have a slight edge if this key level fails.
Should I consider buying EURUSD at current levels around $1.14 given the 4H bullish trend?
Buying at current levels carries risk due to mixed short-term signals. A more prudent approach would be to wait for confirmation: either a hold of $1.14 with a break above $1.14361 resistance, or a clear bearish breakdown below $1.14207. The bullish scenario has a 25% probability.
Is the RSI at 45.91 on the 1H chart a sell signal for EURUSD?
An RSI of 45.91 on the 1H chart leans bearish, suggesting downward momentum. However, it's not yet in oversold territory. This reading, combined with the MACD histogram below its signal line, supports the bearish scenario but requires confirmation from price action breaking key support levels.
How might ECB comments influence EURUSD's direction this week?
Positive or hawkish remarks from ECB officials could boost EUR/USD, potentially leading to a move towards the $1.14577 daily resistance. Conversely, dovish signals or concerns about Eurozone growth could weaken the pair, reinforcing the bearish outlook and pushing it towards $1.14158.
Track markets in real-time
AI-powered analysis, technical indicators and real-time price data.
Join Our Telegram Channel
Breaking market news, AI analysis and trading signals instantly.
Join Channel