

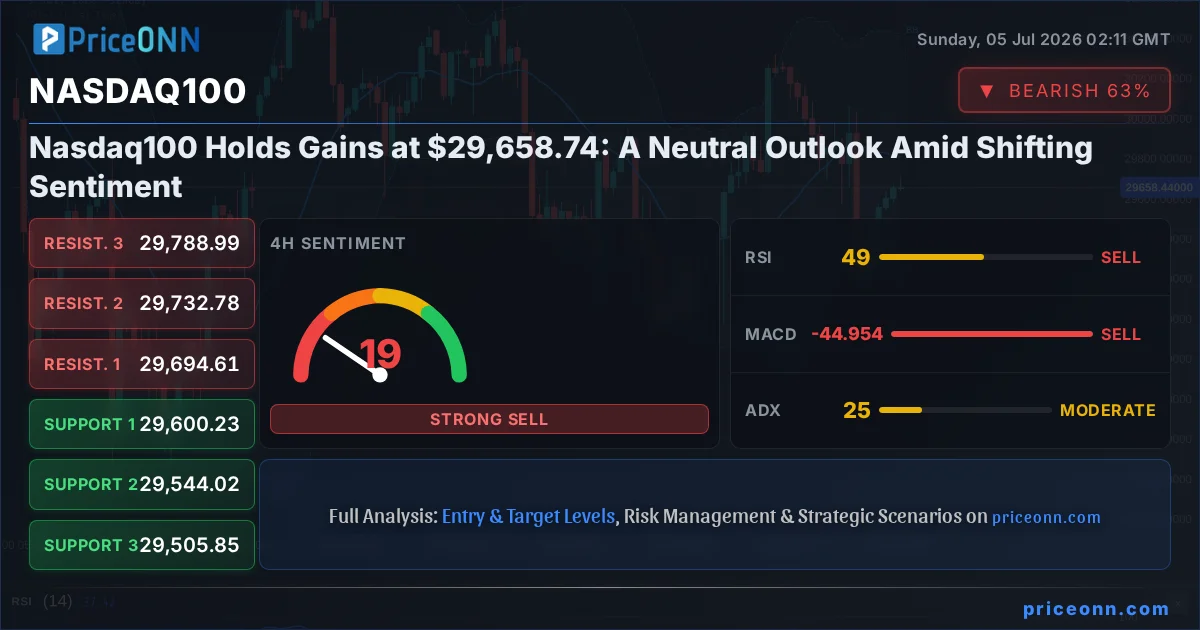
The Nasdaq100 index is currently navigating a period of consolidation, trading around the critical $29,658.74 mark. After a week that saw significant price action, the question on many traders' minds is whether the recent gains can hold, or if a shift in market sentiment will lead to a retest of lower levels. This analysis delves into the current technical readings, cross-market correlations, and the broader economic backdrop to paint a comprehensive picture of the Nasdaq100's position, offering insights for traders looking to navigate this complex market environment.
- RSI at 49.28 on the 4H chart signals a neutral momentum, indicating neither overbought nor oversold conditions for the Nasdaq100.
- Key support for the Nasdaq100 is identified at $29,505.85, a level that has shown resilience during intraday pullbacks this week.
- MACD histogram is negative on the 4H chart, suggesting bearish momentum is currently in play, despite the price hovering near highs.
- The correlation between the Nasdaq100 and the DXY, currently at 100.82, remains a key factor to watch for potential directional cues.
Navigating the Neutral Zone: Nasdaq100's Current Stance
From Peak to Pause: A Week of Consolidation
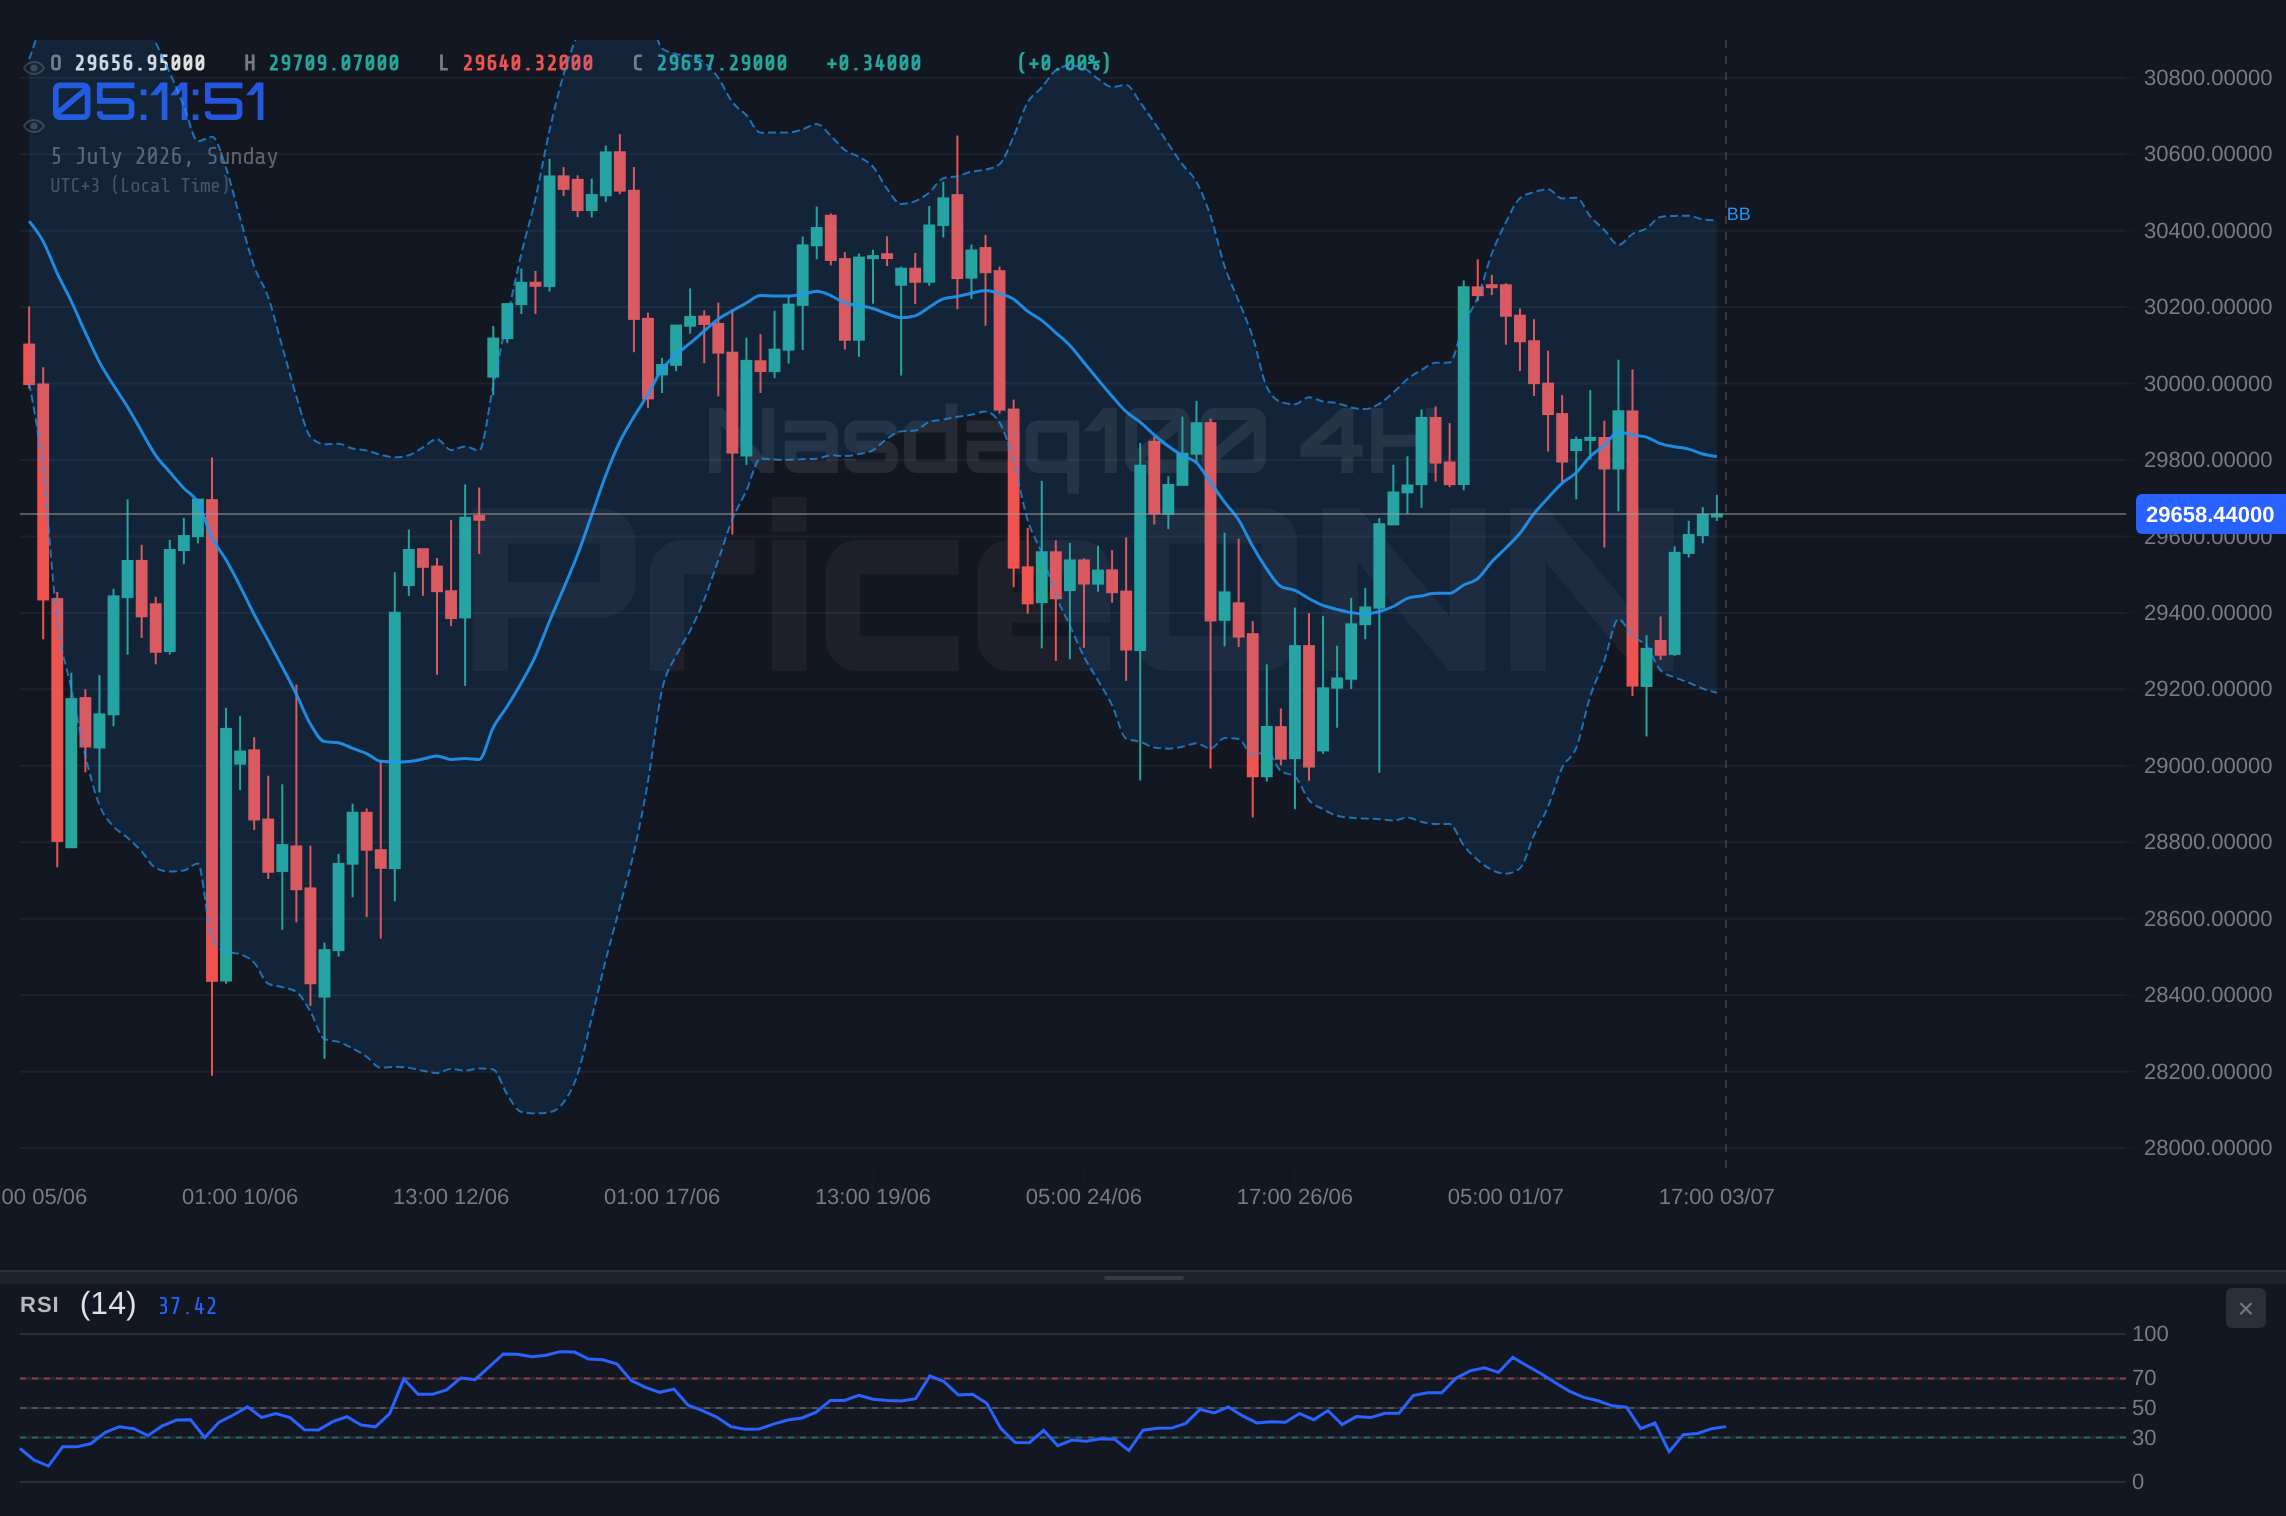
The past week has been characterized by a cautious approach from market participants regarding the Nasdaq100. After a period of upward momentum, the index appears to be consolidating its gains, trading within a relatively tight range around $29,658.74. This pause in the rally suggests a market that is taking a breath, evaluating recent price action, and perhaps waiting for fresh catalysts to dictate the next significant move. The daily chart shows the Nasdaq100 hovering near its mid-Bollinger Band, a classic sign of indecision. While the overall trend on the daily timeframe is neutral, the 4-hour chart shows a stronger bullish trend (92% strength), indicating that short-to-medium term sentiment leans positive, but the daily picture tempers outright bullish conviction. This divergence in timeframes is precisely why a neutral outlook is warranted at this juncture.
The current price of $29,658.74 is a crucial psychological level, and its defense or breach will likely define the short-term trajectory. Traders are closely watching if the index can sustain its position above this level, especially considering the mixed signals from various technical indicators. The lack of a strong directional bias across all timeframes suggests that the market is in a delicate balance, where either bulls or bears could seize control with the right catalyst. This period of consolidation is not uncommon after significant rallies, and it often precedes a more decisive move once underlying conditions shift.
The Tug-of-War: Bulls vs. Bears at Key Levels
Examining the intraday technicals, the 1-hour chart presents a somewhat neutral picture, with a trend strength of 50%. However, the RSI at 54.53, while in the neutral zone, shows a slight upward eğilim, hinting at potential underlying buying interest. Conversely, the MACD is showing negative momentum on this timeframe, with the MACD line below its signal line, suggesting that sellers are currently exerting some pressure. This internal conflict is mirrored in the Stochastic indicator, which shows K=65.14 and D=83.3, indicating an overbought condition and a potential bearish signal as %K
On the 4-hour chart, the picture becomes slightly more bullish, with a trend strength of 92%. The RSI at 49.28, however, leans towards a slight bearish eğilim, while the MACD histogram is negative, reinforcing the notion of bearish momentum. This is particularly interesting given the price is trading above the middle Bollinger Band, which typically suggests upward pressure. The Stochastic indicator on the 4H chart shows K=57.12 and D=35.05, a bullish signal with %K > %D, but it is moving out of oversold territory rather than indicating a strong continuation. The ADX of 24.84 indicates a moderate trend, which, combined with the other indicators, paints a picture of uncertainty rather than a clear path forward. The conflict between the daily's neutral stance and the 4-hour's stronger bullish trend, coupled with mixed signals within each timeframe, solidifies the neutral outlook.
Cross-Market Correlations: The Dollar, Equities, and Commodities
The Dollar Index (DXY): A Silent Watcher
The US Dollar Index (DXY), currently trading at 100.82, plays a pivotal role in shaping the market landscape for assets like the Nasdaq100, especially given the inverse correlation often observed between the dollar and risk assets. A rising DXY typically exerts downward pressure on equities and gold, as it makes dollar-denominated assets more expensive for holders of other currencies, potentially dampening demand. Conversely, a weakening dollar can fuel risk appetite, leading to inflows into growth-oriented assets like tech stocks. At 100.82, the DXY is showing a slight daily decline, which, in theory, should be supportive of the Nasdaq100. However, the intraday technicals on the DXY present a mixed bag. On the 1-hour chart, the DXY's RSI at 47.34 shows a bearish eğilim, while the MACD is positive, and Stochastic is in overbought territory with a bearish crossover signal.
The 4-hour chart for the DXY shows a more consistent bearish picture, with RSI at 40.39 and negative MACD momentum, suggesting further dollar weakness could be on the cards. This aligns with the slight daily drop. However, the ADX on both the 1-hour (29.56) and 4-hour (28.23) charts indicates a strong downtrend, which, if it continues, could provide a tailwind for the Nasdaq100. The divergence between the 1-hour and 4-hour Stochastic signals on the DXY adds another layer of complexity. The 1-hour shows an overbought condition with a bearish signal, while the 4-hour shows a bullish signal as %K crosses above %D. This internal conflict within the dollar's own technicals means its influence on the Nasdaq100 might be less pronounced in the immediate short term, adding to the overall market's indecision. Traders should monitor the DXY's ability to hold its current levels or break lower; a sustained move below 100.00 could signal a broader risk-on sentiment.
Equity Market Interplay: S&P 500 and Nasdaq100 Dynamics
The relationship between the Nasdaq100 and the broader S&P 500 index is intrinsically linked, given that the Nasdaq100 is heavily weighted towards technology and growth stocks, which also feature prominently in the S&P 500. Currently, the S&P 500 is showing a daily rise of 0.74%, trading around 6572.87. This positive movement in the broader market index should, in principle, provide support for the Nasdaq100. However, the technical indicators for the S&P 500 present a more conflicted picture than its daily price action might suggest. On the 1-hour chart, the RSI at 70.95 is nearing overbought territory, hinting at potential pullbacks, while the MACD shows negative momentum. The Stochastic indicator also signals a bearish divergence with %K
The 4-hour chart for the S&P 500 shows a neutral trend strength of 50%, with RSI at 62.83 still in the neutral zone but trending upwards. The MACD is positive here, suggesting underlying buying interest, and the Stochastic is in overbought territory with a strong bullish signal (%K > %D). The ADX at 24.23 indicates a moderate uptrend. The daily chart for the S&P 500, however, paints a bearish picture with a trend strength of 100% indicating a strong downtrend. The RSI at 45.35 shows a bearish eğilim, and the MACD is negative. This stark contrast between the daily bearish trend and the intraday bullish price action highlights the complexity of the current equity market. For the Nasdaq100, this means that while the S&P 500's upward move might offer some comfort, the underlying technical weaknesses, particularly on the daily timeframe, could limit upside potential or signal a potential reversal if broader market sentiment shifts.
Commodities and Inflation: The Brent and WTI Perspective
Oil prices, represented by Brent Crude at $71.89 and WTI at $69.02, serve as crucial indicators of global economic health and inflationary pressures. Currently, both benchmarks are showing daily gains, with Brent up 0.45% and WTI up 0.42%. This uptick in oil prices can be interpreted in several ways. On one hand, rising oil prices can signal increasing global demand, which is generally positive for risk assets like the Nasdaq100, as it implies a growing economy. However, oil is also a significant component of inflation. Sustained increases in energy costs can lead to higher inflation expectations, prompting central banks to maintain tighter monetary policies or even consider further rate hikes, which would be detrimental to growth stocks. Recent news indicates that WTI crude oil is advancing on softer US jobs data and lingering Middle East tensions, suggesting that geopolitical factors and a potentially cooling labor market are influencing prices.
The technical outlook for both Brent and WTI on the daily charts is predominantly bearish, despite the intraday gains. Brent's daily RSI is at 26.85, deep in oversold territory, and its ADX at 42.01 indicates a strong downtrend. Similarly, WTI's daily RSI is at 28.27, also oversold, with an ADX of 38.84 confirming a strong downtrend. This suggests that the current price increases might be short-term bounces within a larger bearish trend, possibly driven by short-covering or speculative plays rather than a fundamental shift in demand or supply dynamics. The fact that India's crude oil inventories are at a near one-year high, as reported, also points to potentially weaker demand or oversupply concerns globally. For the Nasdaq100, the current oil price action is a mixed signal: a slight rise in prices might reflect some demand, but the underlying bearish technicals and inventory data suggest that inflation fears might not be immediately reignited by energy prices, which could be a neutral to slightly positive factor for tech stocks if it allows central banks more flexibility.
Economic Calendar and Geopolitical Undercurrents
Central Bank Signals and Rate Expectations
The narrative surrounding central bank policy remains a dominant force in market direction. While the provided data doesn't include specific Fed Fund Futures or OIS rates, the general market sentiment, as reflected in recent news, suggests a potential cooling in economic data that could influence future rate decisions. News reports indicate that cooling economic data is lowering the odds of further Fed rate hikes. This is a critical development for growth stocks like those in the Nasdaq100. A pause or potential pivot in monetary policy from major central banks, particularly the US Federal Reserve, typically reduces borrowing costs and increases the attractiveness of equities relative to fixed income, thereby supporting stock valuations.
The June FOMC meeting minutes, scheduled for release next week, are expected to provide further insight into the Fed's thinking. Investors will be scrutinizing these minutes for any hints about the future path of interest rates. If the minutes reveal a more dovish tone or a greater concern about economic slowdown, it could boost risk appetite and provide a tailwind for the Nasdaq100. Conversely, any indication of a persistent hawkish stance, or continued concerns about inflation, could dampen sentiment and pressure the index. The current neutral stance of the Nasdaq100 suggests that the market is waiting for clearer signals from these monetary policy communications. The interplay between inflation data, employment figures, and central bank rhetoric will be key in shaping this outlook.
Geopolitical Ripples and Risk Sentiment
Geopolitical tensions, particularly those in the Middle East and the ongoing conflict in Eastern Europe, continue to cast a shadow over global markets. While these events primarily impact energy prices and supply chains, they also contribute to overall market uncertainty and can influence risk sentiment. Lingering Middle East tensions are cited as a factor supporting WTI crude oil prices. Any escalation in these regions could lead to a flight to safety, benefiting traditional safe-haven assets like gold and potentially the US dollar, while pressuring riskier assets such as equities. However, the Nasdaq100's current price action is not showing significant signs of distress attributed to these geopolitical factors, suggesting that the market might be pricing in a 'status quo' scenario for now, or that other factors are currently dominating the narrative.
The broader risk sentiment, often gauged by the performance of indices like the S&P 500 and Nasdaq100 themselves, along with the DXY, remains fluid. The slight daily decline in the DXY and the rise in US equity futures could be interpreted as a mild risk-on signal. However, the mixed technicals across multiple timeframes and asset classes suggest that this risk appetite is tentative. Traders are likely adopting a cautious stance, waiting for more definitive economic data or geopolitical developments to solidify a directional bias. The fact that the Nasdaq100 is holding its ground around $29,658.74, despite conflicting signals, indicates a degree of resilience, but the underlying fragility in some technical indicators and the broader economic uncertainty mean that sentiment could shift rapidly.
Technical Outlook and Trading Scenarios
The Daily Dance: A Neutral Equilibrium
On the daily timeframe, the Nasdaq100 exhibits a neutral trend strength of 50%. This lack of a dominant trend is reflected in the RSI at 45.35, which shows a bearish eğilim, suggesting that momentum might be waning. However, the MACD is positive with its signal line above, and the Stochastic indicator shows a bullish signal with %K > %D. The ADX at 40.35 indicates a strong downtrend, which seems contradictory to the MACD and Stochastic readings. This conflict is a hallmark of a market trying to find its footing after a period of directional movement. The price is trading above the middle Bollinger Band, which usually signifies an upward bias, yet the overall trend strength and RSI point towards caution. The support levels at $28,901.12, $28,496.28, and $29,41.83 are significantly below the current price, offering a wide buffer zone, while resistance is seen at $41,67.91, $42,12.27, and $42,80.95. The neutral daily outlook means that while there's no immediate sell signal, the conditions are not ripe for aggressive buying either.
Short-Term Signals: 4-Hour Chart Insights
The 4-hour chart offers a more defined, albeit still complex, picture. With a trend strength of 92%, the trend is decidedly bullish. The RSI at 62.83 is in the neutral zone but trending higher, indicating positive momentum. The MACD is positive, with the MACD line above its signal line, reinforcing the bullish bias. The Stochastic indicator is in overbought territory (K=97.85, D=86.96), suggesting that the upward momentum might be nearing exhaustion, and a pullback could be imminent. The ADX at 24.23 indicates a moderate uptrend. The support levels on this timeframe are $29,505.85, $29,33.23, and $29,23.67, while resistance is eyed at $29,61.07, $29,70.63, and $29,80.63. The confluence of a strong bullish trend on the 4H chart, combined with overbought Stochastic readings, suggests that while the immediate direction might favor buyers, the risk of a short-term correction is elevated. This makes the 4-hour chart a critical watch for short-term trading decisions, highlighting the potential for both upside continuation and downside reversal.
The 1-Hour Perspective: Micro-Trends and Divergences
On the 1-hour chart, the Nasdaq100 shows a neutral trend strength of 50%, underscoring the short-term choppiness. The RSI at 54.53 is in the neutral territory with a slight upward eğilim, suggesting some buying interest, but it's not a strong signal. The MACD histogram is negative, indicating bearish momentum on this very short timeframe, which contradicts the RSI's slight upward bias. The Stochastic indicator is signaling an overbought condition with K=65.14 and D=83.3, and crucially, %K
Trade Scenarios and Probabilities
Bearish Scenario: Profit-Taking Pressure Mounts
25% ProbabilityNeutral Scenario: Consolidation Continues
50% ProbabilityBullish Scenario: Momentum Resumes
25% ProbabilityKey Levels to Watch: Support and Resistance
Frequently Asked Questions: Nasdaq100 Analysis
What happens if the Nasdaq100 breaks below the 4-hour support at $29,505.85?
A break below $29,505.85 on the 4-hour chart would invalidate the current bullish momentum and likely trigger a move towards the next significant daily support level at $28,901.12. This scenario suggests increased selling pressure and a potential start of a deeper correction.
Should I consider buying the Nasdaq100 at current levels around $29,658.74 given the mixed RSI and MACD signals?
Buying at current levels requires caution due to conflicting signals. A more prudent approach would be to wait for confirmation: either a confirmed break above the $29,777.27 resistance with strong volume, or a clear bounce from the $29,505.85 support. A confirmation above resistance offers a higher probability trade setup with a target near $29,898.83.
Is the RSI at 49.28 on the 4-hour chart a bearish signal for the Nasdaq100?
An RSI of 49.28 is technically in the neutral zone, but it shows a slight bearish eğilim as it's below 50 and trending downwards. While not a direct sell signal, it indicates that bullish momentum might be weakening, especially when considered alongside the negative MACD histogram on the same timeframe.
How might the upcoming FOMC meeting minutes affect the Nasdaq100 this week?
The FOMC minutes are crucial for the Nasdaq100. If they reveal a hawkish tone, suggesting continued focus on inflation and potential for further tightening, it could pressure the index downwards towards $28,901.12. Conversely, any dovish hints or concerns about economic slowdown could boost sentiment and target resistance levels near $29,777.27 and beyond.
Track markets in real-time
AI-powered analysis, technical indicators and real-time price data.
Join Our Telegram Channel
Breaking market news, AI analysis and trading signals instantly.
Join Channel