

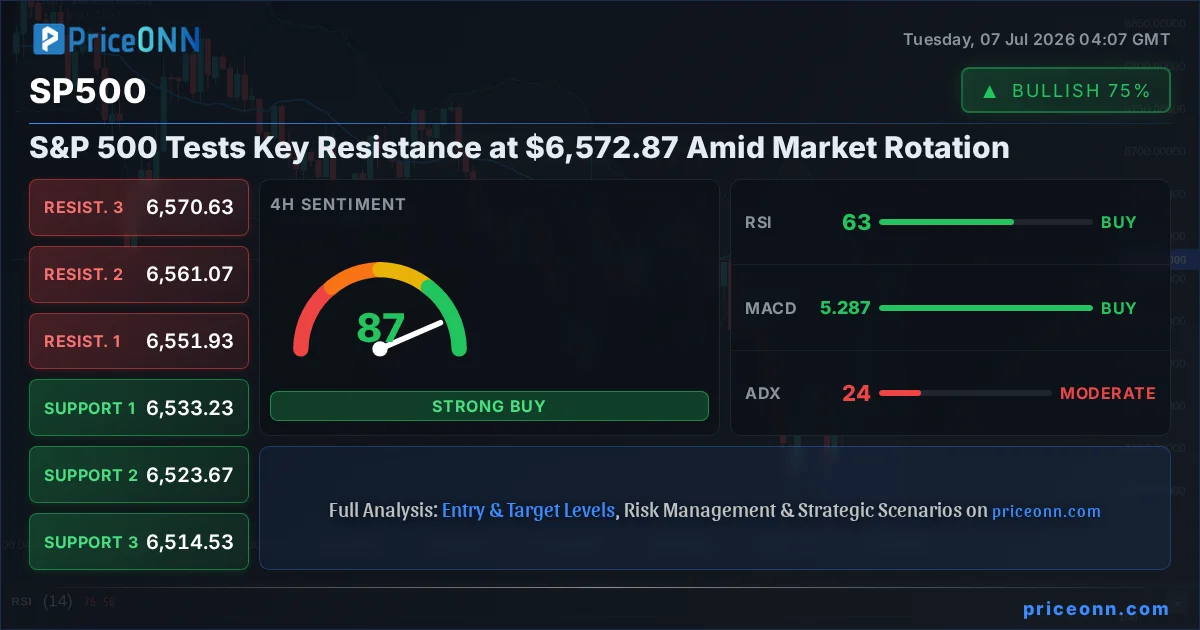
The S&P 500 is currently finding itself at a critical juncture, hovering near the $6,572.87 mark. This level represents a significant resistance point that, if challenged successfully, could signal further upside. However, recent market dynamics suggest a complex interplay of forces, with a noticeable rotation occurring across sectors. This rotation is not just a minor blip; it's actively slowing the broader market's momentum, making the path forward for the S&P 500 less straightforward than a simple trend following strategy might imply. The market's current state is characterized by a tug-of-war between seasonal factors, robust corporate earnings, and an increasingly cautious sentiment driven by macroeconomic uncertainties and shifting investor preferences. Understanding this nuanced environment is crucial for navigating the current trading landscape.
- RSI at 62.83 on the 4H chart signals a neutral to slightly bullish leaning, but nearing overbought territory on higher timeframes.
- Critical support for the SP500 sits at $6,533.23, a level tested multiple times as the market consolidates.
- MACD histogram shows positive momentum on the 4H chart, suggesting underlying strength, but divergence on daily charts warrants caution.
- Fed rate expectations and global risk sentiment are driving SP500 correlations with the DXY and Brent Crude, creating a complex intermarket dynamic.
The broader market narrative is currently dominated by a subtle yet significant shift in investor focus. While the S&P 500 has shown resilience, climbing to $6,572.87, the underlying breadth of the market is telling a different story. We are observing a rotation away from growth-oriented technology stocks and into more defensive sectors or value plays. This isn't a full-blown risk-off event, but rather a strategic reallocation by institutional players seeking stability amidst lingering inflation concerns and the Federal Reserve's uncertain path forward. The DXY, or Dollar Index, currently trading around 100.88, reflects this cautious sentiment, with its slight uptick suggesting a preference for the greenback as a safe haven. This correlation is vital; a stronger dollar often translates to pressure on commodities like gold and can weigh on dollar-denominated assets.
From a technical standpoint, the S&P 500's daily chart paints a picture of consolidation rather than a clear directional trend. The index is trading below its 1-day middle Bollinger Band, indicating a bearish inclination on this longer timeframe, yet the RSI at 44.14 suggests it's far from being oversold. Conversely, the 4-hour chart presents a more optimistic view, with the price above the middle band and the RSI at 62.83, signaling upward momentum. This divergence across timeframes is precisely what creates the current market choppiness. The ADX on the daily chart stands at 47.51, a strong reading indicating a robust downtrend is in play, while the 4-hour ADX at 24.23 suggests a moderate uptrend. This conflict highlights the indecision plaguing the market – longer-term trends suggest caution, while shorter-term signals hint at potential upside.
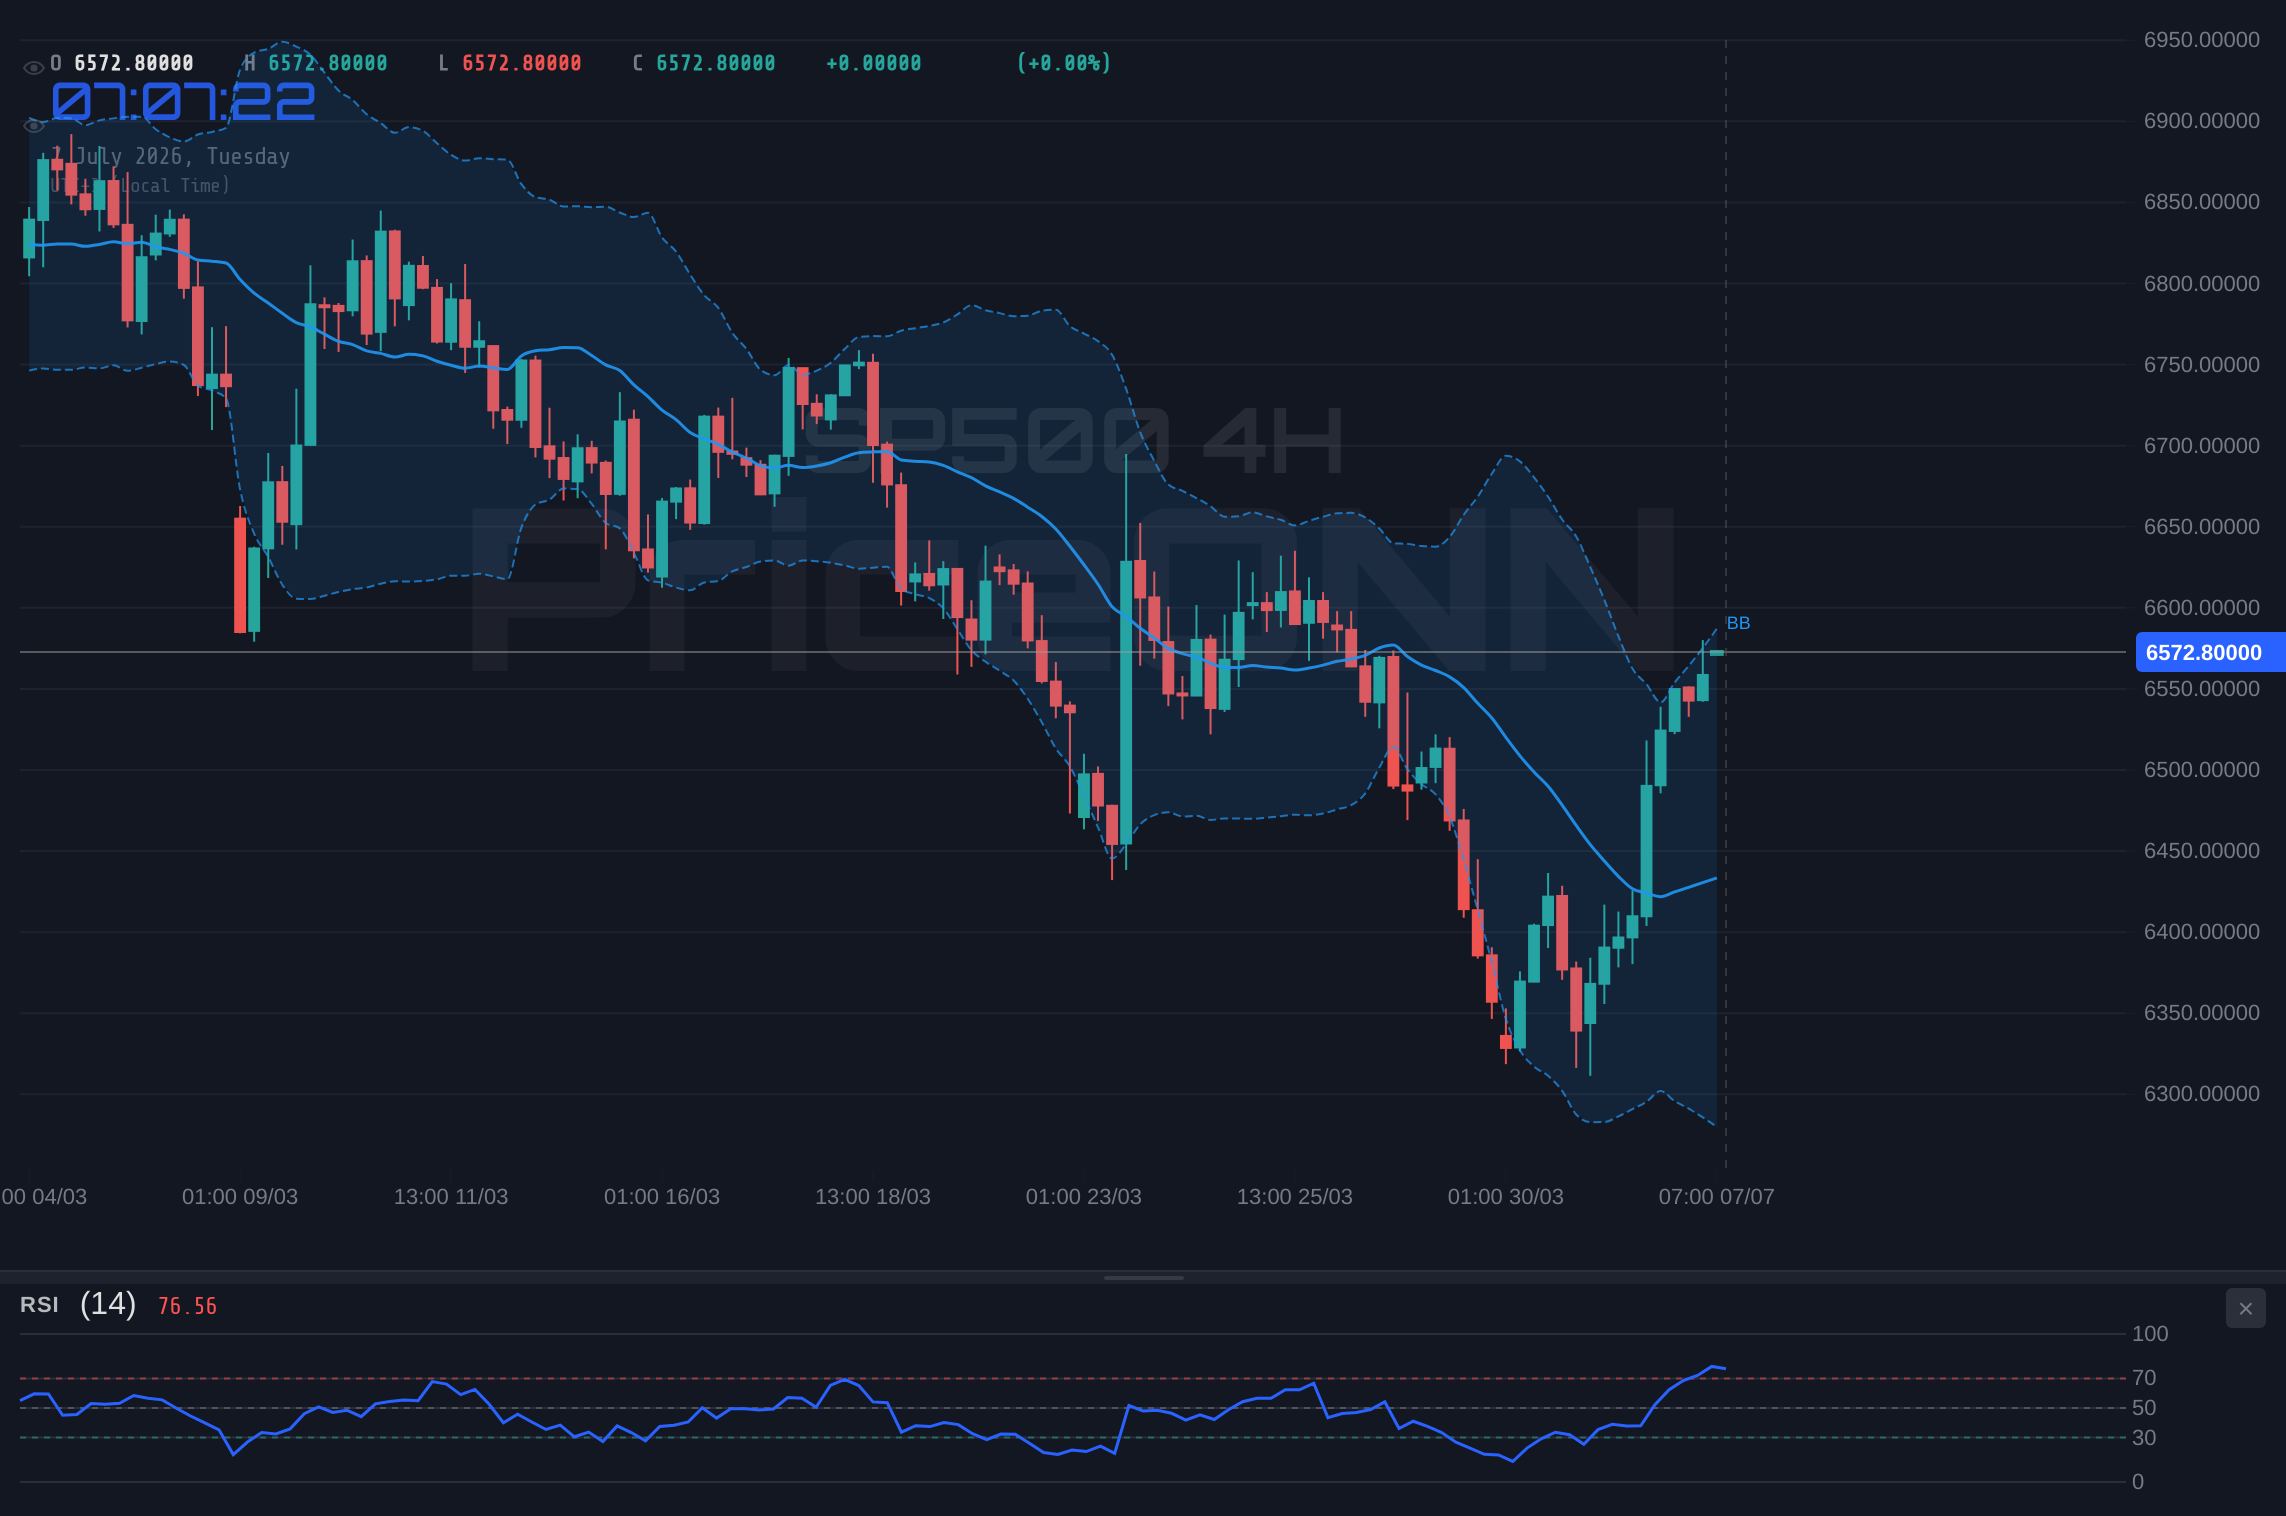
The current price action around $6,572.87 for the S&P 500 is being shaped by a complex web of intermarket relationships. The strength in the US Dollar Index (DXY) around 100.88 acts as a headwind, potentially dampening appetite for riskier assets. Simultaneously, Brent Crude is showing signs of life, trading around $72.51, which could be interpreted as a sign of underlying economic demand or, alternatively, as a precursor to renewed inflationary pressures. WTI crude oil, at $69.26, mirrors this trend. These energy price movements are critical; sustained increases in oil can fuel inflation fears, prompting the Fed to maintain a hawkish stance, which typically puts pressure on equity markets. The Nasdaq 100, currently at 29,423.88, has seen a more pronounced downturn, falling 0.95% today, indicating that growth-oriented tech stocks are bearing the brunt of this rotation and risk aversion.
Looking at the broader economic calendar, the market is keenly awaiting further clarity on the Federal Reserve's next moves. While recent employment data, like the weaker-than-expected US payrolls report mentioned in market commentary, provided some relief by suggesting a cooling labor market, the persistent inflation narrative remains a key concern. The S&P 500's performance is intrinsically linked to Fed policy expectations. Any indication of continued hawkishness from Fed officials could easily stall the index's advance, pushing it back towards support levels like $6,533.23. Conversely, signs of the Fed nearing a pause or pivot could reignite risk appetite, potentially propelling the index towards resistance at $6,551.93 and beyond. The market is currently pricing in a complex outlook, with traders weighing the possibility of a soft landing against the risk of recession.
The Pound Sterling's recent rally, noted as being supported by political stabilization, is an interesting cross-market development. While seemingly unrelated to the S&P 500 directly, it speaks to a broader global sentiment shift. A strengthening GBPUSD, currently around 1.33907, can sometimes indicate a tentative increase in global risk appetite, which *could* spill over positively into US equities. However, the correlation is not always direct. The Euro, trading around 1.14378 against the dollar, remains range-bound, with focus on upcoming Fed minutes. This lack of strong directional conviction in major currency pairs adds to the overall market indecision, reinforcing the idea that the S&P 500's current move is more about sector rotation than a broad-based bullish charge.
On the commodities front, Gold's resilience above $4,000, as reported following disappointing US payrolls, is a classic safe-haven signal. XAUUSD is currently trading at $4,132.57, down slightly today but finding support. This suggests that while equities are attempting to push higher, underlying anxieties persist. If inflation data continues to surprise to the upside, gold could find renewed strength, potentially drawing capital away from riskier assets like stocks. The inverse relationship between gold and the DXY is particularly relevant here; if the dollar weakens due to easing inflation expectations or a Fed pause, gold could see a significant rally, potentially at the expense of the S&P 500's gains. XAGUSD (Silver) at $61.14 is also showing weakness, trading below its 1-day middle Bollinger Band, indicating broader weakness in the precious metals complex.
Considering the technical indicators on the SP500, the 1-hour chart shows a strong uptrend signal (ADX 49.72, RSI 70.95), but this is immediately countered by the daily chart's strong downtrend signal (ADX 47.51, RSI 44.14). The Stochastic Oscillator on the 4-hour chart (K=97.85, D=86.96) is deeply overbought, flashing a warning sign for further immediate upside. This confluence of conflicting signals across different timeframes underscores the difficulty in calling a clear direction. While short-term traders might find opportunities in the intraday swings, the longer-term picture remains muddled. The MACD on the 4H chart shows positive momentum, but on the daily, it's negative, adding to the complexity. This is not a market for blindly chasing trends.
The Nasdaq 100's underperformance is a significant data point. Currently at 29,423.88 and down 0.95%, it suggests that the tech-heavy index is more sensitive to rising interest rate expectations or a general flight to quality. This weakness in growth stocks can act as a drag on the broader S&P 500, even if other sectors are performing relatively well. The Dow Jones Industrial Average, however, presents a more bullish picture, trading at 53,120.50 with a strong daily uptrend signal (ADX 32.23, RSI 70.16). This divergence between the Nasdaq and the Dow further emphasizes the sector rotation theme – investors are favoring traditional industrial and financial plays over speculative tech.
The current environment demands a strategic approach, focusing on risk management and patience. The S&P 500 at $6,572.87 is facing resistance, and the underlying market breadth suggests that a significant breakout might be premature without clearer macroeconomic catalysts. The conflicting signals from technical indicators across different timeframes – strong uptrend on 4H versus strong downtrend on 1D – mean that conviction is low. Traders should be wary of chasing price action without clear confirmation. The focus should be on identifying specific sector plays or waiting for a decisive break above resistance or a confirmed retest of key support levels like $6,533.23.
Geopolitical tensions, though not overtly flaring in headlines today, always remain a background risk. Any escalation in existing conflicts or new flare-ups could rapidly shift market sentiment from risk-on to risk-off, benefiting safe havens like gold and the dollar, and pressuring the S&P 500. Similarly, unexpected inflation data or hawkish commentary from Fed officials could trigger a sharp sell-off. The market's sensitivity to these factors is heightened by the current rotation, making it more susceptible to sudden shifts. Therefore, maintaining a flexible approach and closely monitoring correlation dynamics between the S&P 500, DXY, and commodities like Brent Crude is paramount for informed decision-making.
Ultimately, the S&P 500's journey above $6,572.87 hinges on a clearer fundamental narrative emerging. Until then, expect choppiness and sector-specific performance to dominate. The data suggests a market in transition, where patience and a disciplined approach to risk management will be the most valuable tools in a trader's arsenal. The key levels to watch remain $6,533.23 for support and $6,551.93 for initial resistance, with a decisive move above the latter needed to reignite broader bullish sentiment.
Bearish Scenario: Rotation Deepens
55% ProbabilityNeutral Scenario: Consolidation Continues
30% ProbabilityBullish Scenario: Resistance Breakout
15% ProbabilityFrequently Asked Questions: S&P 500 Analysis
What happens if the S&P 500 breaks above the $6,551.93 resistance level?
A sustained move above $6,551.93 on the 4-hour chart could trigger a bullish scenario, potentially targeting the next resistance at $6,561.07. This would indicate a shift in short-term momentum, possibly fueled by positive economic news or a dovish Fed signal.
Is the current RSI reading of 62.83 on the 4H chart a buy signal for the S&P 500?
An RSI of 62.83 on the 4-hour chart suggests bullish momentum but is not an immediate buy signal on its own. It indicates the market is in a neutral-to-bullish zone, but traders should look for confirmation, such as a break of resistance, before entering a long position, especially given the daily RSI is lower.
How will potential Fed rate hike expectations affect the S&P 500 around the $6,572.87 level?
If Fed rate hike expectations increase, it could pressure the S&P 500, pushing it towards support levels like $6,533.23. Conversely, expectations of a Fed pause or cut might support the index, potentially driving it towards resistance at $6,551.93. The market is sensitive to any shifts in monetary policy outlook.
Should I consider buying the S&P 500 if it tests the $6,533.23 support level?
Testing support at $6,533.23 presents a potential buying opportunity if the level holds firm, especially if accompanied by signs of waning selling pressure or positive divergence on shorter timeframes. However, a break below this level invalidates the bullish case, opening the door for further declines towards $6,514.53.
Track markets in real-time
AI-powered analysis, technical indicators and real-time price data.
Join Our Telegram Channel
Breaking market news, AI analysis and trading signals instantly.
Join Channel