

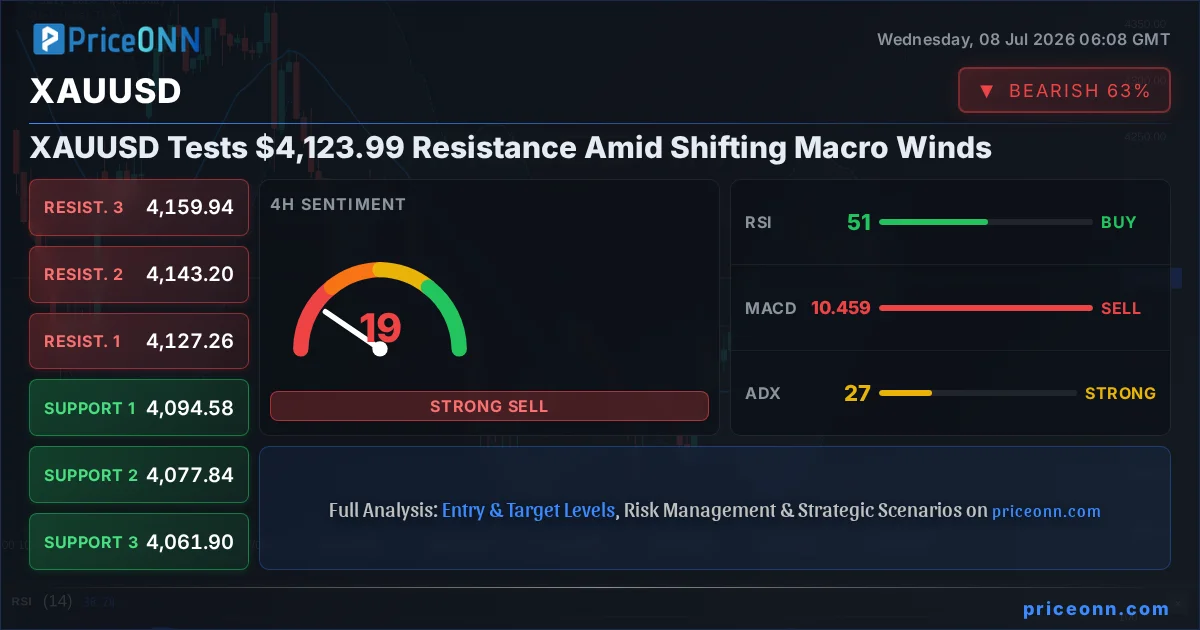
Gold, or XAUUSD, is currently navigating a complex technical landscape, trading precisely at $4,123.99. This pivotal price point places the precious metal uncomfortably close to significant resistance levels, while broader market correlations, particularly with the US Dollar Index (DXY) and equity indices like the S&P 500, are beginning to paint a nuanced picture. The current neutral to slightly bearish signals across shorter timeframes, contrasted with a strong underlying uptrend on the daily chart, create a scenario demanding careful observation rather than outright directional bets. This analysis delves into the confluence of technical indicators, macroeconomic drivers, and the critical price action unfolding around the $4,160 mark, exploring what it means for traders and investors navigating these choppy waters.
- The RSI on the 1-hour chart sits at 47.23, indicating neutral momentum with a slight bearish inclination.
- Gold's immediate resistance is identified at $4,128.83, with a more significant hurdle at $4,160.04 on the daily chart.
- The DXY is currently trading at 101.06, showing a strengthening dollar which typically exerts downward pressure on gold prices.
- Upcoming Federal Reserve minutes are a key event to watch, potentially influencing interest rate expectations and gold's trajectory.
The immediate trading environment for gold presents a delicate balance. On the 1-hour chart, the Relative Strength Index (RSI) at 47.23 suggests a lack of strong directional conviction, leaning slightly towards bearish momentum. This is further echoed by the Bollinger Bands, which are trading below the middle band, hinting at potential downside pressure in the short term. However, the Stochastic Oscillator on the same timeframe provides a conflicting bullish signal with K at 73.07 and D at 42.18, indicating a potential upward push. This divergence highlights the indecision in the market. The Average Directional Index (ADX) at 17.7 further supports this, pointing to a weak trend and a market that is essentially range-bound on the hourly view. This lack of a clear trend on lower timeframes means that any moves are likely to be choppy and require careful risk management.
Delving into the 4-hour timeframe, the picture becomes slightly more defined, yet still complex. The trend is marked as 'Uptrend' with a strong 88% power, but the overall signal leans towards 'SELL'. This apparent contradiction often arises when a longer-term uptrend is experiencing short-term pullbacks or consolidation. The RSI at 50.43 is hovering around the neutral line, showing a slight upward tendency, but the Stochastic Oscillator (K=24.42, D=28.63) is firmly in bearish territory, suggesting further downside potential on this timeframe. The ADX here registers 26.69, indicating a strong trend, which, when combined with the sell signal, suggests that the prevailing trend, despite being technically 'up', is currently facing significant headwinds and bearish pressure is building. This level of conflict between different indicators and timeframes underscores the need for a multi-faceted approach to understanding gold's current price action.
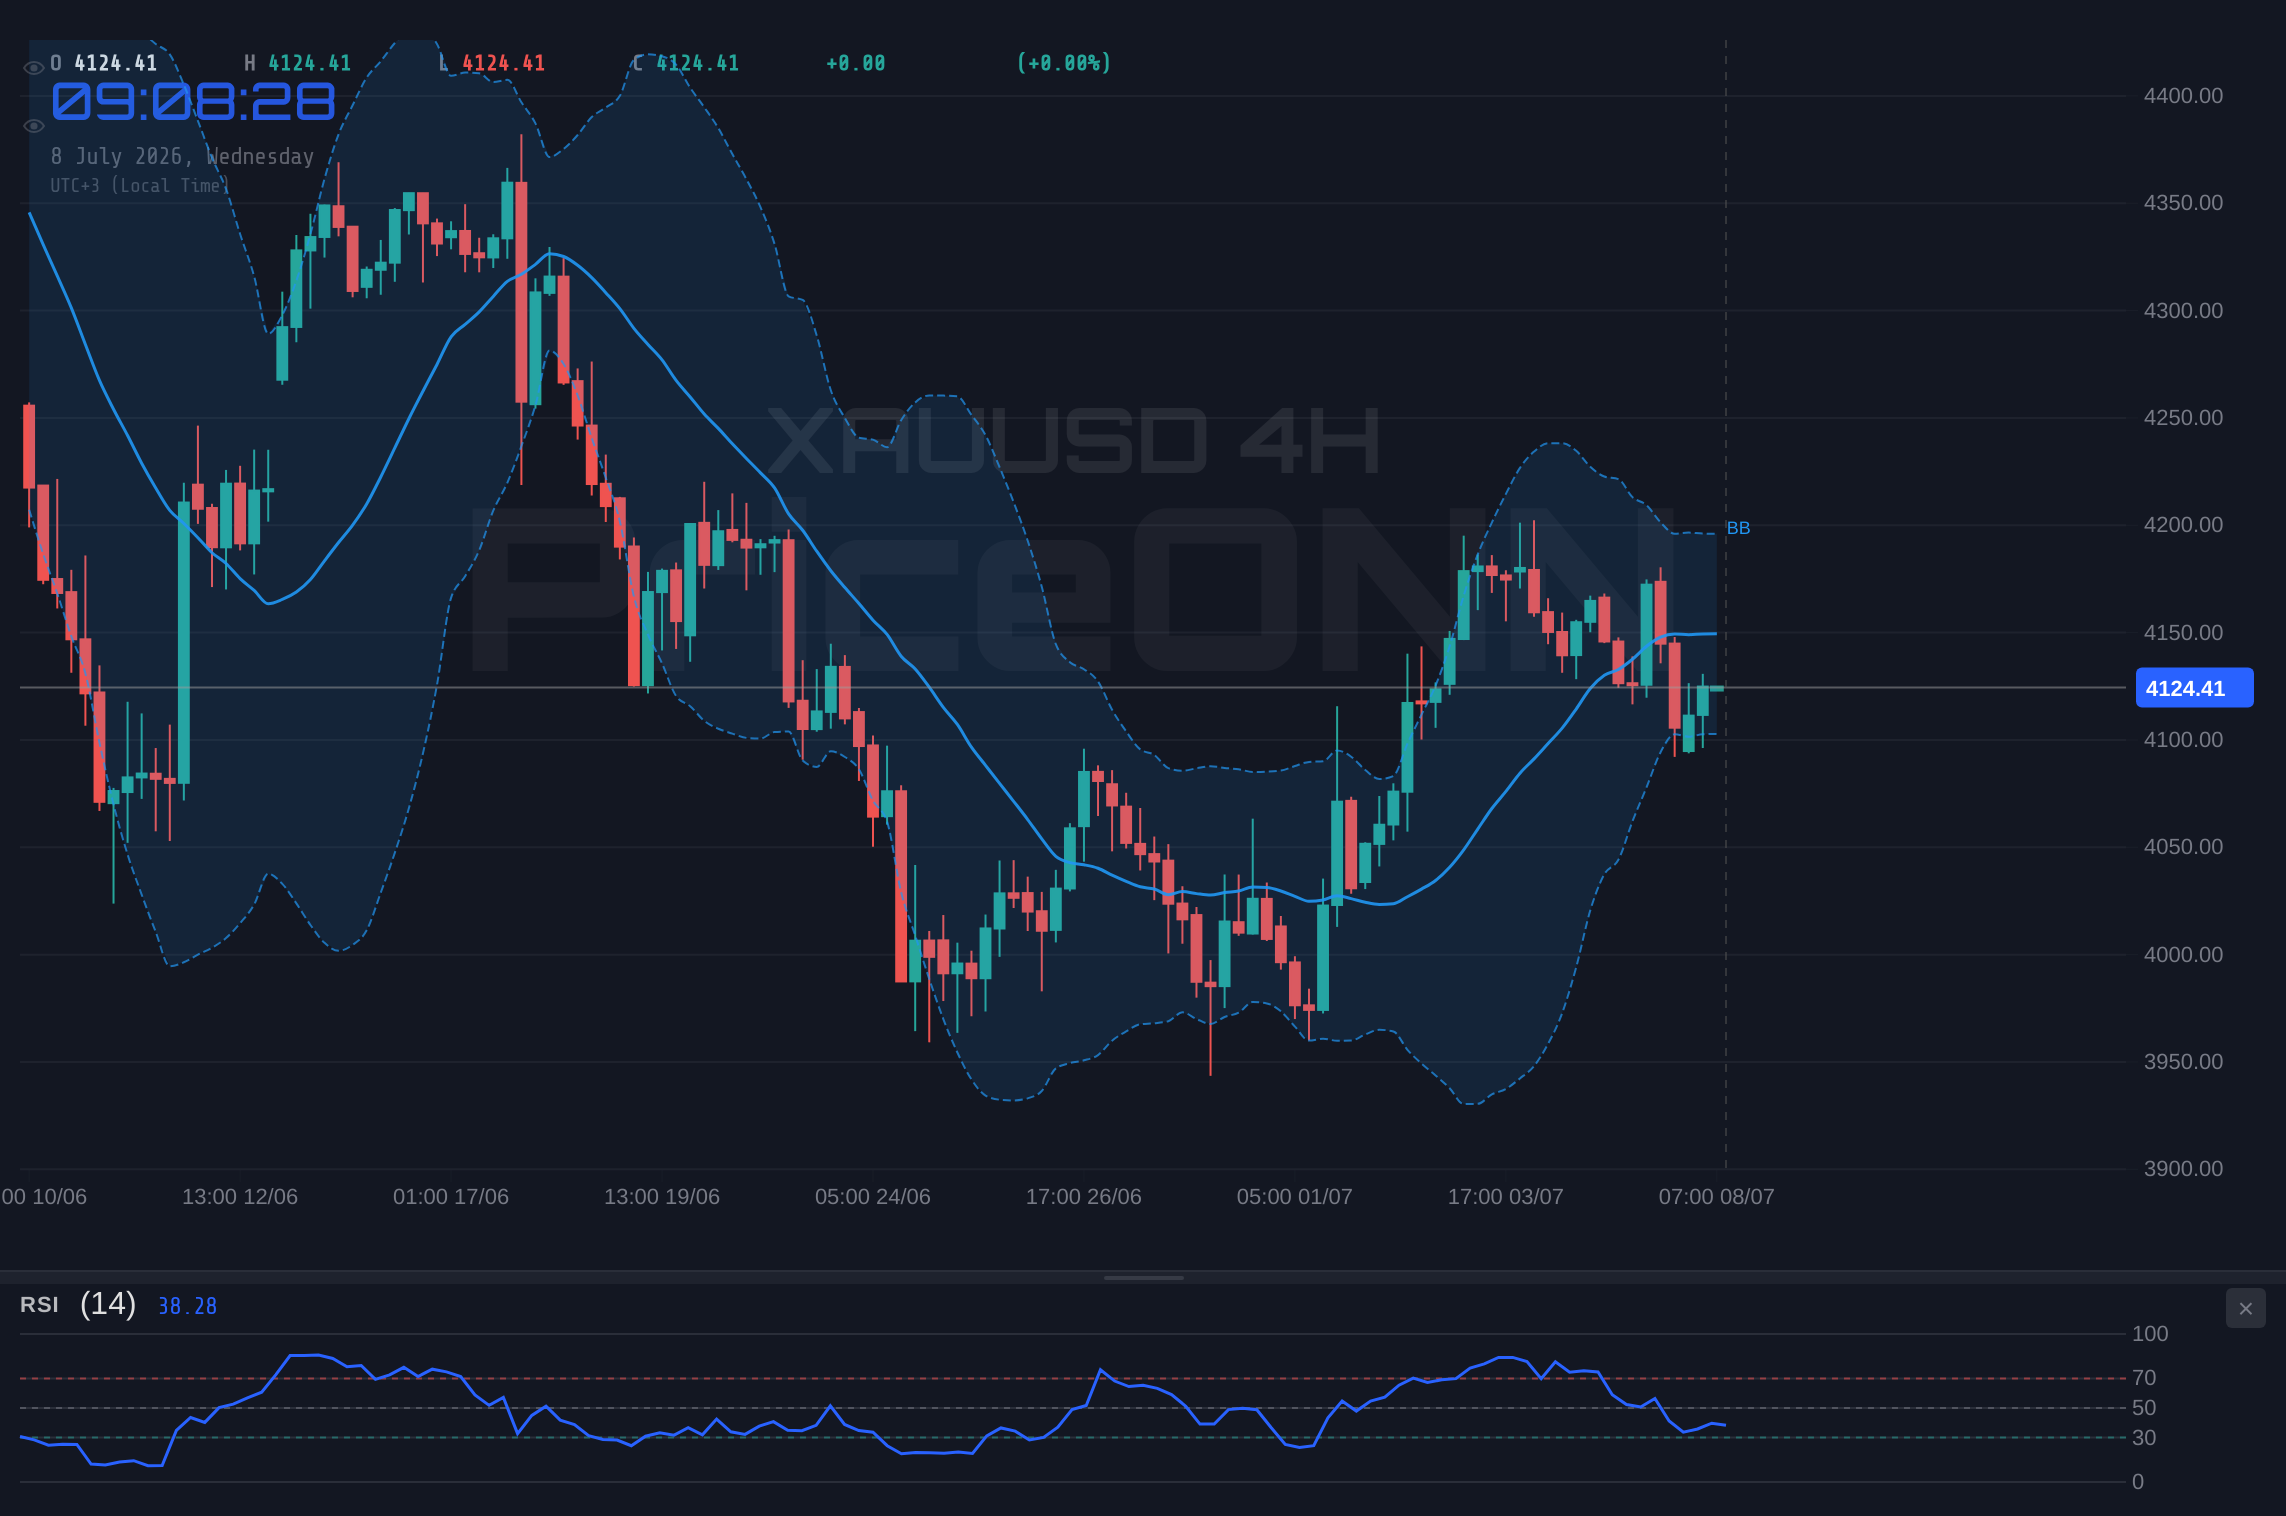
The daily chart offers a broader perspective, revealing a neutral trend with a 50% power rating, yet the overall signal is a strong 'SELL'. This is a critical observation. The RSI at 44.03 indicates a leaning towards selling pressure, and the Bollinger Bands are once again below the middle band, reinforcing the bearish sentiment on a daily basis. The ADX at 37.31 denotes a strong trend, and when coupled with the 'SELL' signal, it strongly suggests that the dominant force on the daily chart is bearish. Despite the current price of $4,123.99, the underlying daily trend indicators are flashing caution. This daily 'SELL' signal, despite the 4-hour 'UPTREND' classification, suggests that the longer-term momentum might be shifting, or at the very least, that the current price action is consolidating within a broader, potentially weakening, upward move. The support levels on the daily chart at $4,071.73, $4,037.77, and $4,000 are substantial, and a break below them would confirm a more significant bearish turn.
The interplay between gold and the US Dollar Index (DXY) is a fundamental driver that cannot be ignored. With the DXY currently trading at 101.06 and showing a strengthening trend on the 1-hour and 4-hour charts, this typically exerts downward pressure on gold prices. A stronger dollar makes gold more expensive for holders of other currencies, potentially dampening demand. The DXY’s current position near its resistance levels suggests that if it manages to break higher, gold could face even more significant selling pressure. Conversely, if the dollar falters, gold often finds a responsive bid as a safe-haven asset. The market is currently pricing in a strengthening dollar narrative, which adds another layer of resistance for gold prices trying to push higher from the $4,123.99 level.
Furthermore, the broader market sentiment, as indicated by the S&P 500 and Nasdaq indices, plays a crucial role. The S&P 500 is showing a strong uptrend on the 1-hour and 4-hour charts, but a bearish signal on the daily timeframe. The Nasdaq, on the other hand, exhibits a clear downtrend across all observed timeframes. This divergence suggests a cautious equity market environment. When risk appetite declines, as potentially indicated by the Nasdaq's weakness, investors often flock to safe-haven assets like gold. However, the mixed signals from the equity markets, coupled with the dollar's strength, create a challenging environment for gold to find consistent upward momentum. The recent news of the S&P 500 entering July with mixed labor market signals and gold finding support above $4,000 after a weak payrolls report highlights this delicate balance between risk-on and risk-off sentiment.
Upcoming economic events, particularly the Federal Reserve's policy meeting minutes, are set to be a major catalyst. Traders will be scrutinizing these minutes for any hints about future interest rate hikes or pauses. A more hawkish tone from the Fed would likely strengthen the dollar and put further pressure on gold, potentially pushing it down from the $4,123.99 mark towards the $4,094.58 support level. Conversely, any indication of a dovish shift or a pause in rate hikes could weaken the dollar and provide a much-needed boost to gold prices, possibly aiming for the $4,128.83 resistance. The market's reaction to these minutes could be significant, potentially breaking the current neutral deadlock.
The technical indicators on the daily chart present a compelling case for caution. While the MACD shows positive momentum, with the MACD line above the signal line, its position relative to the zero line and the histogram's strength are key. The Stochastic Oscillator on the daily chart is showing a bullish signal (K=72.62, D=58.91), suggesting that despite the prevailing 'SELL' signal from other indicators, there might be underlying strength building. However, this bullish signal from Stochastic is in direct conflict with the ADX reading of 37.31, which denotes a strong trend, and the overall 'SELL' signal. This conflict suggests that while there might be short-term buying interest, the broader trend on the daily chart is not yet confirming a sustained move higher. The critical resistance level to watch is $4,160.04, which aligns with the daily chart's resistance zone. A decisive break and hold above this level would be required to invalidate the bearish daily signals and suggest a continuation of any prior uptrend.
Considering the current price action around $4,123.99, the immediate outlook for gold appears to be one of consolidation with a bearish bias on lower timeframes, tempered by a strong uptrend on the 4-hour chart and a neutral-to-bearish signal on the daily chart. The confluence of a strong dollar, mixed equity market signals, and the anticipation of Fed minutes creates an environment ripe for volatility. Traders are likely to remain on the sidelines, waiting for a clearer signal. The $4,120.65 support level on the 1-hour chart will be the first line of defense, while the $4,128.83 resistance will be the immediate target for any short-term upside moves. A decisive move above $4,160.04, however, would be needed to signal a more substantial shift in sentiment.
The recent news highlighting gold finding support above $4,000 after a disappointing US payrolls report and subsequent dollar selling provides context. This suggests that while gold can find bids during periods of dollar weakness or negative economic surprises, its ability to sustain rallies is heavily dependent on broader macroeconomic trends and central bank policy. The current environment, characterized by a firm dollar and anticipation of hawkish central bank rhetoric, presents a significant hurdle for gold to overcome. The price action around $4,123.99 is a battleground where short-term technical signals clash with longer-term fundamental drivers and the overarching influence of the US dollar.
Looking at the broader economic calendar, upcoming events will be crucial. Beyond the Fed minutes, any significant data releases related to inflation (CPI, PCE) or employment (NFP, unemployment rate) in the US, or growth indicators (PMI) from major economies like the Eurozone, will significantly impact the DXY and, by extension, gold. A stronger-than-expected inflation print could reignite hawkish Fed expectations, pressuring gold downwards. Conversely, signs of cooling inflation or a weakening labor market might lead to a less aggressive Fed stance, potentially benefiting gold. The market is sensitive to these data points, and their release could trigger the much-needed volatility to break the current stalemate around $4,123.99.
The divergence in signals across different timeframes is a classic characteristic of markets in transition or consolidation. While the 1-hour chart shows indecision, and the daily chart leans bearish, the 4-hour chart points to an underlying uptrend. This suggests that while short-term traders might be looking for opportunities to sell into strength, longer-term players may be accumulating on dips, expecting the broader uptrend to persist. The key will be whether the resistance at $4,160.04 can be decisively broken. If it holds, expect a potential retest of the $4,094.58 support. If it breaks, the next significant level to watch would be $4,214.39, although this seems less probable given the current daily 'SELL' signals and the strong ADX readings indicating trend strength, albeit in a conflicting direction across timeframes.
The current price of $4,123.99 for XAUUSD represents a critical juncture. While short-term indicators are mixed and lean bearish, the longer-term daily chart, despite its 'SELL' signal, is still influenced by the strong ADX reading, suggesting trend adherence. The immediate future will likely be dictated by the interplay of the dollar's strength, equity market sentiment, and crucially, the signals emerging from the Federal Reserve. Patience and a disciplined approach to risk management are paramount as the market awaits clearer direction. The $4,160 level remains a significant barrier that needs to be overcome for a sustained bullish move, while the $4,071.73 support level on the daily chart represents a key area to monitor for potential downside.
Ultimately, gold is trading at a crossroads. The $4,123.99 price reflects a market grappling with conflicting signals. The strength of the US dollar, driven by potential Fed hawkishness, acts as a headwind. However, underlying geopolitical tensions and the potential for a shift in central bank policy provide a supportive backdrop. The technical indicators are painting a picture of indecision, with bearish leanings on shorter timeframes and a strong trend presence that needs further confirmation. As traders digest the latest market data and look towards key economic releases, the ability of gold to decisively break above $4,160.04 will be the ultimate test of its current strength and the direction of its next significant move.
Navigating this period requires a keen eye on the details. The ADX values across timeframes, particularly the strong 37.31 on the daily chart, indicate that when a trend does emerge, it is likely to be significant. The current price of $4,123.99 is a battleground where short-term fluctuations meet longer-term implications. The Stochastic Oscillator's bullish signal on the daily chart, contrasting with the overall 'SELL' signal, suggests that while bears are in control, a reversal cannot be entirely ruled out if key resistance levels are breached with conviction. The market is waiting for confirmation, and until then, a cautious, data-driven approach is the most prudent strategy.
The technical dashboard presents a mixed bag, but the prevailing signals on the daily chart lean towards caution. The strong ADX reading of 37.31 on the daily chart suggests that the market is trending, and given the 'SELL' signal, this trend is likely downward or consolidating downwards. The RSI at 44.03 supports this, indicating a lack of buying enthusiasm. While the 4-hour chart shows an uptrend, this could be a counter-trend move within a larger daily consolidation or downtrend. The immediate price action around $4,123.99, nestled between the 1-hour support of $4,120.65 and resistance of $4,128.83, suggests a period of consolidation before the next major move. The key takeaway is that breaking the $4,160.04 daily resistance is crucial for any sustained bullish sentiment to emerge.
The narrative surrounding gold is currently one of cautious optimism battling underlying bearish pressures. The current price of $4,123.99 hovers near resistance, and the DXY's strength is a significant factor. While short-term indicators show some bullish divergence, the daily chart's overall 'SELL' signal, supported by a strong ADX, cannot be ignored. The upcoming Fed minutes will be the primary catalyst to watch, potentially providing the clarity needed to break this stalemate. Until then, expect price action to remain sensitive to dollar movements and any shifts in interest rate expectations.
Frequently Asked Questions: XAUUSD Analysis
What happens if XAUUSD breaks below the $4,120.65 support level?
A break below $4,120.65 on the 1-hour chart would likely confirm bearish momentum, potentially targeting the next support at $4,116.44 and then $4,094.58 on the daily chart. This would invalidate any short-term bullish hopes.
Should I buy XAUUSD at current levels of $4,123.99 given the mixed signals?
Given the mixed signals and proximity to resistance, buying at $4,123.99 requires caution. A confirmed break above $4,160.04 would be a stronger buy signal. Otherwise, wait for price to approach nearer support levels like $4,120.65 with confirmation.
Is the RSI at 47.23 on the 1-hour chart a sell signal for XAUUSD?
An RSI of 47.23 is considered neutral but leans bearish, suggesting a slight lack of buying pressure. It's not a strong sell signal on its own, but combined with other bearish indicators on lower timeframes, it contributes to the indecisive picture around $4,123.99.
How will the upcoming Fed minutes affect XAUUSD this week?
The Fed minutes will be critical. A hawkish tone suggesting further rate hikes could strengthen the DXY (currently 101.06) and pressure gold towards $4,094.58. A dovish tone might weaken the dollar and support gold, potentially pushing it towards $4,160.04.
Track markets in real-time
AI-powered analysis, technical indicators and real-time price data.
Join Our Telegram Channel
Breaking market news, AI analysis and trading signals instantly.
Join Channel