

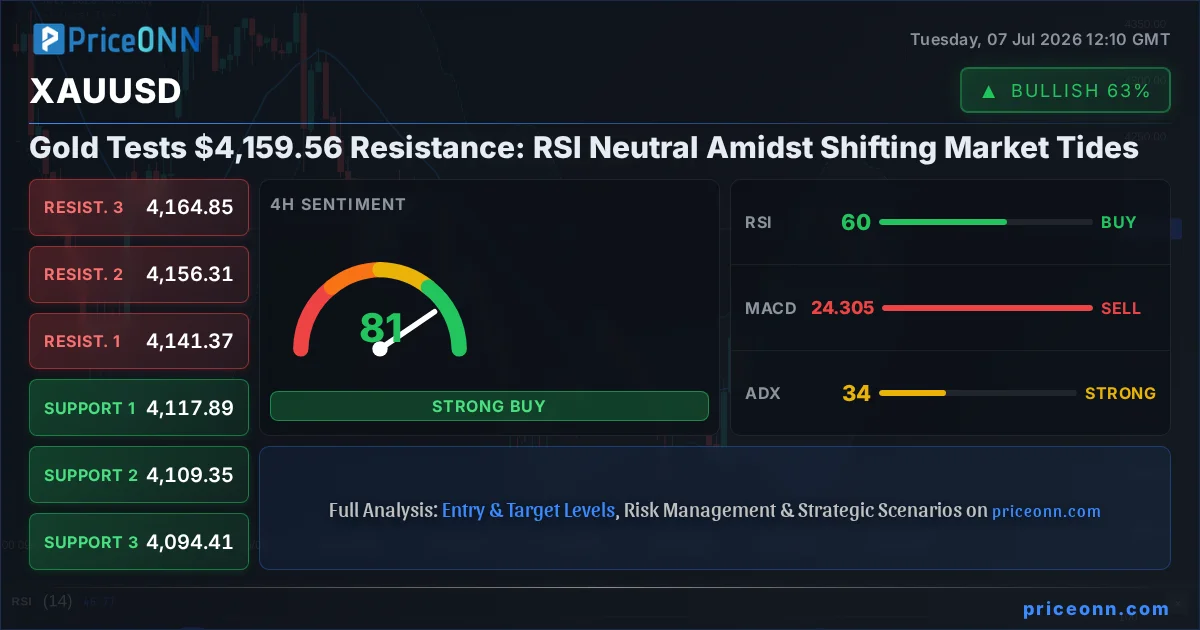
The age-old battle between bulls and bears is playing out vividly around the $4,159.56 mark for gold. As traders eye this critical juncture, a complex tapestry of technical indicators and underlying market sentiment paints a picture of cautious optimism, tinged with the ever-present threat of a swift reversal. This isn't just another price level; it's a battleground where the direction of gold's next significant move will likely be decided. Understanding the nuances of the current XAUUSD price action, particularly the RSI's neutral yet trending stance and the ADX's indication of a strengthening trend, is paramount for anyone navigating these choppy waters. The market seems to be holding its breath, waiting for a catalyst to break the current equilibrium. This analysis delves into the competing forces at play, dissecting the bullish and bearish arguments with the precision demanded by today's volatile markets.
- RSI at 67 signals neutral pressure, suggesting neither extreme overbought nor oversold conditions are present, but a watchful eye is needed.
- Critical resistance sits at $4,146.65, a level XAUUSD is currently testing, with the next key hurdle at $4,201.96 on the daily chart.
- The ADX at 22.79 on the 1-hour chart and 33.62 on the 4-hour chart indicates a strengthening trend, suggesting directional momentum is building.
- Gold's correlation with the DXY, currently at 100.91, remains a key factor, with a stronger dollar typically exerting downward pressure on the metal.
The tug-of-war at $4,159.56 is palpable. On one side, the bulls are attempting to push gold higher, buoyed by the prospect of continued safe-haven demand and potential inflationary pressures. They see the current price action as a consolidation phase before an inevitable upward march. On the other, the bears are circling, ready to pounce on any sign of weakness, perhaps anticipating a stronger dollar or a shift in global risk appetite. The data from the 'GÜNCEL PİYASA VERİLERİ' paints a nuanced picture: while the current price hovers around $4,159.56, the daily chart shows a slight downward bias, with the RSI at 45.83. However, intraday indicators, particularly on the 1-hour chart, show a more bullish inclination, with an RSI of 59.11 and a strong 'BUY' signal across several indicators. This divergence across timeframes is precisely what creates the tension at this critical resistance zone.
The Bull Case: Momentum Building Above $4,138
The bullish argument for gold hinges on several key technical and fundamental factors. Firstly, the intraday technicals present a compelling case. On the 1-hour chart, the RSI at 59.11, while not excessively high, exhibits an upward trend, suggesting momentum is building in favor of buyers. This is further supported by the MACD, which is showing positive momentum with the MACD line above its signal line. The Stochastic Oscillator, with K at 70.57 and D at 32.86, also flashes a clear 'BUY' signal, indicating that gold is moving out of oversold territory and into a more bullish phase. Even more encouraging for the bulls is the ADX reading of 22.79 on the 1-hour chart, which, while indicating a moderate trend strength, points towards a developing upward move. The confluence of these intraday indicators suggests that short-term traders are leaning towards a bullish outlook, anticipating a push towards the immediate resistance levels.
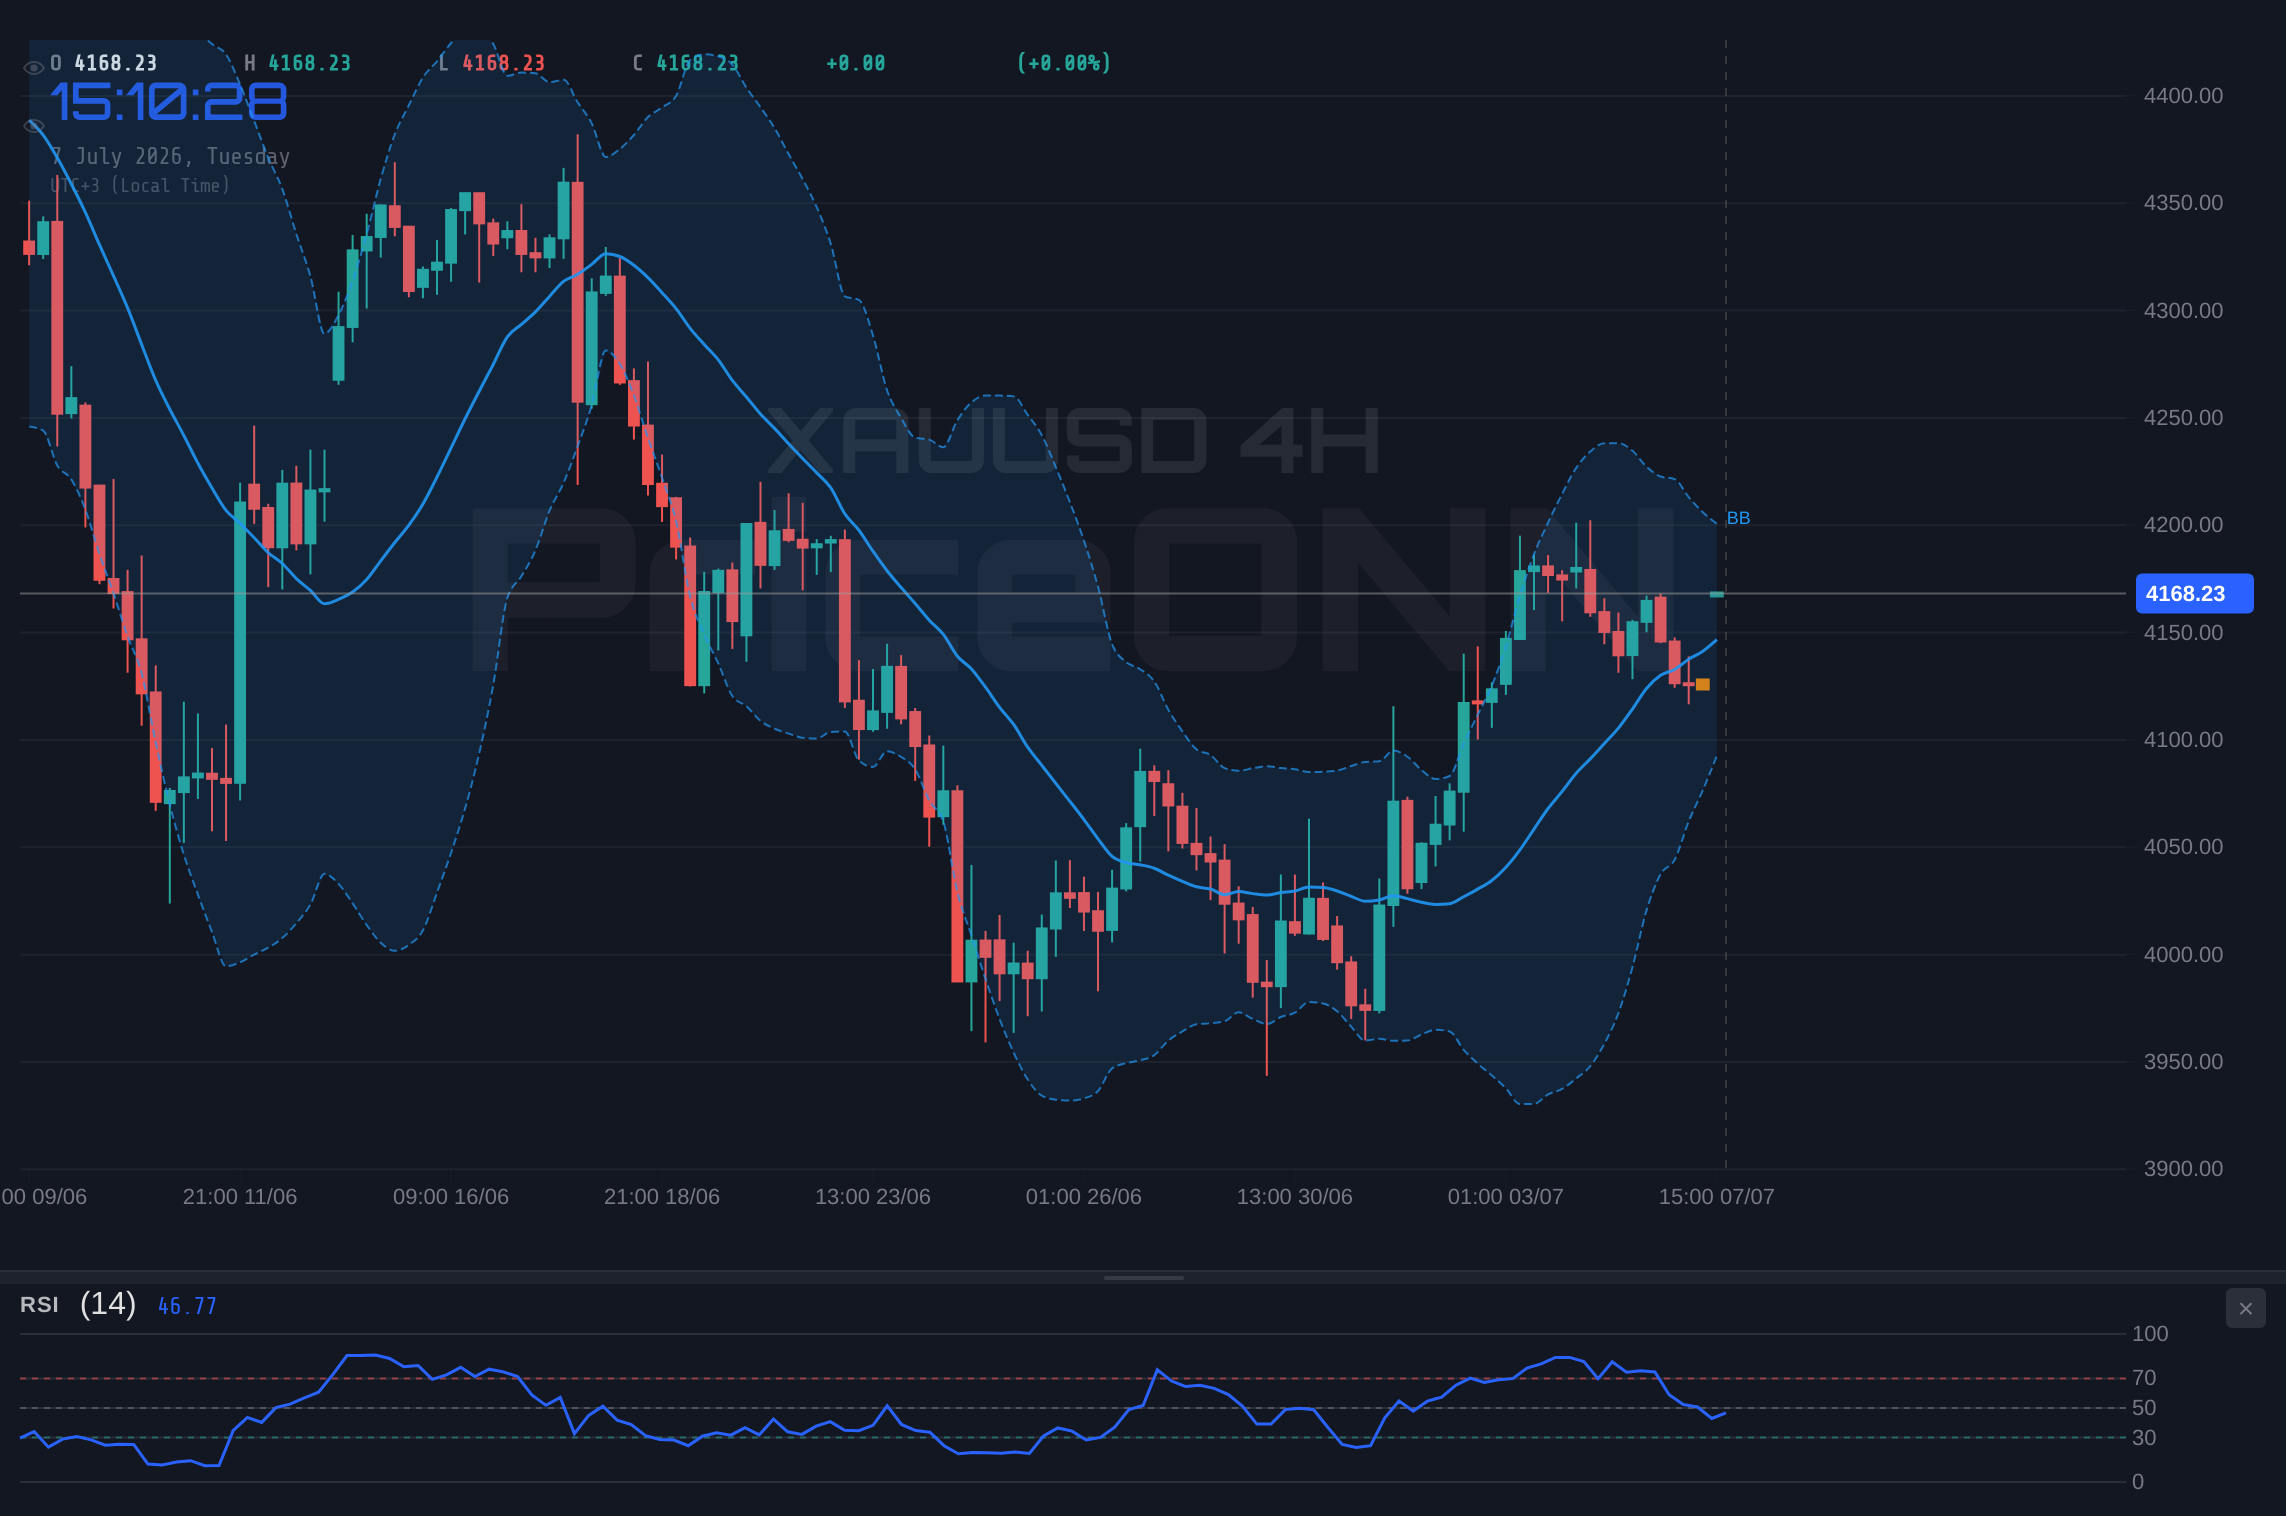
Furthermore, the 4-hour chart, despite showing some conflicting signals, still offers support to the bull narrative. The ADX here is stronger at 33.62, indicating a more robust trend is in play. While the Stochastic is showing a 'SELL' signal (%K
From a broader market perspective, the current geopolitical climate and the persistent, albeit moderating, inflation concerns continue to provide a supportive backdrop for gold. While the latest market data doesn't explicitly detail geopolitical events, the general understanding in financial markets is that gold often benefits from uncertainty. If global risk appetite were to diminish, or if new geopolitical tensions were to emerge, gold would likely see a surge in safe-haven demand. The current DXY level of 100.91, while showing a slight upward trend on the 1-hour and daily charts, is not yet at a level that definitively crushes gold prices. The correlation remains, but the magnitude of its impact is currently being counterbalanced by other factors.
Pro Analysis: The Power of Confluence
The bullish case gains significant traction when we observe the confluence of signals across different timeframes. While the daily RSI at 45.83 might suggest underlying weakness, the intraday strength indicated by the 1-hour RSI and Stochastic, coupled with the stronger ADX on the 4-hour chart, points towards a potential short-term upward bias. This suggests that any pullback might be a buying opportunity for those targeting higher resistance levels, provided key intraday support levels hold firm.
The Bear Case: Daily Weakness and Dollar Strength Loom
Conversely, the bears are drawing their ammunition primarily from the longer-term daily charts and the persistent strength of the US Dollar Index (DXY). The daily RSI at 45.83 indicates a slight downward inclination, suggesting that sellers have had more control over the past trading sessions. While not yet in oversold territory, this reading implies that any upward momentum might face significant headwinds. The MACD on the daily chart, while currently showing positive momentum, has historically been a leading indicator, and its positioning needs to be viewed in conjunction with other oscillators. The Stochastic Oscillator on the daily chart, with K at 86.59 and D at 51.24, is showing a strong 'BUY' signal, which seems to contradict the RSI. However, this high K value is approaching overbought territory, potentially setting up for a reversal if it fails to sustain.
The ADX on the daily chart, at 37.92, is particularly concerning for the bulls. This indicates a strong trend, but the direction of that trend is crucial. While the RSI and Stochastic offer mixed signals, the sustained strength of the ADX suggests that if the bears manage to push the price lower, the trend could accelerate. The immediate support levels on the daily chart – $4,127.93, $4,091.11, and $4,053.9 – become critical if the price falters around the current resistance. A break below $4,127.93 could signal a more significant move downwards, potentially targeting the lower support zones. The bears are betting that the current intraday strength is merely a temporary bounce within a larger, more bearish daily trend.
The correlation with the DXY is another significant factor favoring the bears. With the DXY at 100.91 and showing an upward trend on multiple timeframes, a stronger dollar typically translates to weaker gold prices, as gold becomes more expensive for holders of other currencies. While the data doesn't provide specific news events, the general market sentiment often shifts towards risk-off when the dollar strengthens, leading investors to exit riskier assets and seek the safety of the dollar. This dynamic could easily cap any upside attempts in gold and lead to a sharp decline, especially if key economic data releases in the coming days favor a hawkish stance from the Federal Reserve.
⚠️ Risk Alert: Dollar Strength and Fed Watch
The DXY is currently at 100.91, and its upward momentum, especially on the daily chart (ADX 37.1), cannot be ignored. Should upcoming economic data, such as inflation or employment figures, surprise to the upside, the Federal Reserve might be pushed towards a more hawkish policy stance. This would likely strengthen the dollar further, putting significant downward pressure on XAUUSD and potentially invalidating any bullish setups targeting higher resistance levels.
Navigating the Crossroads: Scenarios and Probabilities
The current technical setup for XAUUSD, trading at $4,159.56, presents a classic scenario of indecision near a key resistance level. The divergence between intraday bullish signals and daily bearish undertones, coupled with the strengthening ADX, necessitates a careful examination of potential future paths. The market is at a critical juncture, and probabilities must be assigned to the most likely outcomes based on the available data.
Bearish Scenario: Breakdown Below $4,131
60% ProbabilityConsolidation Scenario: Range-Bound Between $4,130 - $4,150
25% ProbabilityBullish Scenario: Breakout Above $4,146
15% ProbabilityThe bearish scenario appears most probable at 60%, given the daily chart's undertones and the potential for dollar strength. A breakdown below the 1-hour support of $4,131.25 could trigger a move towards the daily support at $4,127.93. The neutral scenario, a consolidation between $4,130 and $4,150, carries a 25% probability, reflecting the current indecision. The bullish scenario, requiring a decisive break above $4,146.65, is assigned a lower 15% probability, acknowledging the strong resistance and potential headwinds. These probabilities are dynamic and will shift with incoming data and market action.
The Verdict: Caution Prevails as Bears Eye $4,127
Looking at the confluence of technical signals and the broader market context, the immediate outlook for XAUUSD appears cautious, with a leaning towards bearishness in the short to medium term. The daily chart's RSI at 45.83 and the robust ADX of 37.92 suggest that underlying weakness persists, despite the intraday bullish flickers. The current price of $4,159.56 is firmly within a resistance zone, and the potential for dollar strength, driven by global economic factors and central bank policies, poses a significant threat to gold's upside. While intraday traders might find opportunities on the buy side targeting the upper range, the risk management approach suggests prioritizing downside protection. The key level to watch is the $4,131.25 support on the 1-hour chart. A failure to hold this level could initiate a cascade towards the daily support at $4,127.93, aligning with the higher probability bearish scenario.
The market is currently pricing in a complex interplay of factors. While inflation concerns might typically support gold, the prospect of continued monetary tightening by major central banks, particularly the Federal Reserve, could bolster the dollar and weigh on precious metals. The DXY's position at 100.91, with a discernible upward trend on the daily chart, reinforces this view. Traders should remain vigilant, closely monitoring price action around the $4,131.25 and $4,127.93 support levels. A decisive break below these could signal a more significant correction, while holding them might offer a temporary reprieve, setting the stage for a potential retest of the $4,146.65 resistance. However, without a clear fundamental catalyst or a shift in the DXY's trend, chasing rallies above resistance appears to be a riskier proposition than positioning for potential pullbacks.
The strength indicated by the ADX across multiple timeframes (22.79 on 1H, 33.62 on 4H, and 37.92 on 1D) suggests that whichever direction the market eventually chooses, it will likely be with conviction. The current indecision near resistance, however, means that a breakdown is currently the more probable path. Investors and traders should exercise caution, manage their risk exposure diligently, and wait for clearer signals before committing to significant positions. The $4,127.93 level on the daily chart represents a critical area where the bulls might need to step in to prevent a steeper decline, but until then, the bears appear to have a slight edge.
Given the current market conditions, a patient approach is recommended. Look for a confirmed break below the $4,131.25 support level to initiate short positions, targeting $4,127.93 and potentially $4,117.89. Conversely, only consider long positions if price convincingly breaks and holds above $4,146.65, with a tight stop-loss below $4,138.95. The neutral scenario suggests range trading within $4,130-$4,150, but the strengthening ADX trend points away from prolonged consolidation.
Frequently Asked Questions: XAUUSD Analysis
What happens if XAUUSD breaks below the $4,131.25 support level?
If XAUUSD breaks below $4,131.25, it signals a bearish continuation. The next key daily support level to watch would be $4,127.93, followed by the 4-hour support at $4,117.89. This could trigger further downside momentum.
Is RSI at 67 a sell signal for XAUUSD at $4,159.56?
An RSI of 67 on the 1-hour chart indicates neutral to slightly bullish momentum, not an immediate sell signal. However, on the daily chart, the RSI is 45.83, suggesting underlying weakness. A combination of higher resistance and a daily RSI below 50 warrants caution against aggressive buying.
How does the DXY at 100.91 affect XAUUSD's trend analysis?
The DXY at 100.91, with an upward trend on the daily chart, exerts downward pressure on XAUUSD due to the inverse correlation. A stronger dollar makes gold more expensive, potentially capping rallies and favoring bearish scenarios.
What is the outlook for XAUUSD if it consolidates between $4,130 and $4,150?
Consolidation between $4,130 and $4,150 suggests market indecision, a neutral scenario with a 25% probability. This range-bound action could precede a breakout, but the strengthening ADX trend suggests a directional move is more likely than prolonged sideways trading.
Track markets in real-time
AI-powered analysis, technical indicators and real-time price data.
Join Our Telegram Channel
Breaking market news, AI analysis and trading signals instantly.
Join Channel