

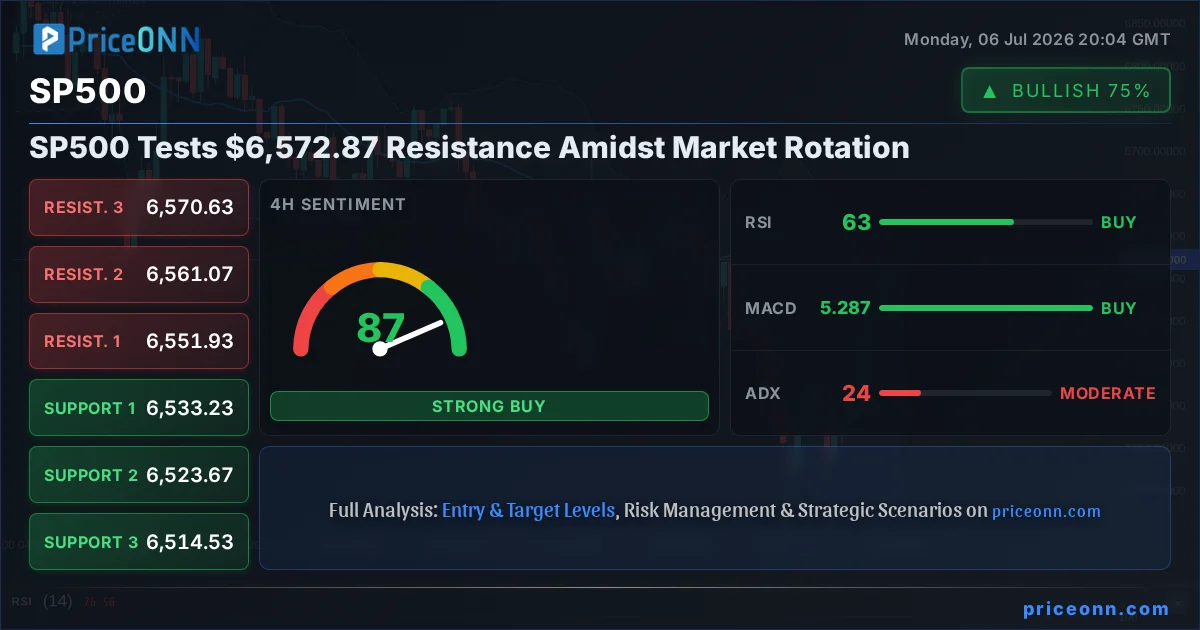
The S&P 500 is currently navigating a critical juncture, trading near the $6,572.87 mark as market participants grapple with a noticeable rotation across sectors. After a period of strong upward momentum, the index appears to be consolidating, caught between seasonal influences and the persistent strength of corporate earnings. This dynamic creates a complex trading environment, demanding a keen eye on intermarket correlations and underlying sentiment shifts. Understanding the interplay between the DXY, oil prices, and broader risk appetite is paramount for deciphering the S&P 500's next move.
- The S&P 500 is currently trading around $6,572.87, approaching a key resistance level.
- RSI at 62.83 on the 4H chart suggests neutral momentum with an upward bias, while the 1D RSI at 45.35 indicates a slight bearish leaning.
- Critical support for the SP500 is identified at $6,533.23, with resistance looming at $6,561.07.
- Market sentiment shows mixed signals, with DXY showing a bearish trend on the 1H but a bullish outlook on 1D, adding complexity.
The current price action for the S&P 500, hovering around $6,572.87, presents a fascinating case study in market dynamics. On the 1-hour chart, the trend is firmly bullish with a strength of 100%, suggesting immediate upward pressure. However, this is juxtaposed by the 4-hour chart, which shows a neutral trend with 50% strength, and the daily chart, which indicates a bearish trend with 100% strength. This divergence across timeframes highlights a market in transition, where short-term optimism clashes with longer-term caution. The recent news mentioning a 'rotation' taking hold suggests that while certain sectors might be experiencing headwinds, others are potentially finding new life, leading to a choppier, less directional overall market environment.
The strength of the US dollar, as measured by the DXY, often acts as a significant counterweight to risk assets like the S&P 500. Currently, the DXY shows a bearish trend on the 1H chart (ADX 25.48) but a bullish trend on the 1D chart (ADX 37.97). This mixed picture for the dollar adds another layer of complexity. A strengthening dollar typically correlates with pressure on equities, as it makes US assets more expensive for foreign investors and can signal tighter global liquidity. Conversely, a weakening dollar can sometimes coincide with risk-on sentiment, benefiting indices like the S&P 500. The current indecision in the DXY mirrors the consolidation seen in the S&P 500, suggesting that currency market sentiment is also in flux.
Navigating the Technical Landscape: Indicators in Focus
Diving deeper into the technical indicators for the S&P 500 reveals a nuanced picture. On the 1-hour timeframe, the Relative Strength Index (RSI) stands at a robust 70.95, signaling overbought conditions and a potential for profit-taking. This is supported by the Stochastic indicator, where the %K line (65.73) is above the %D line (73.5), indicating a bearish signal as it implies a potential downward cross or consolidation. The Average Directional Index (ADX) at 49.72 on this timeframe points to a very strong trend, but the conflicting RSI and Stochastic readings suggest this trend might be losing immediate steam or entering a consolidation phase. The MACD histogram, while showing positive momentum, has its signal line below, which can sometimes precede a slowdown or reversal.
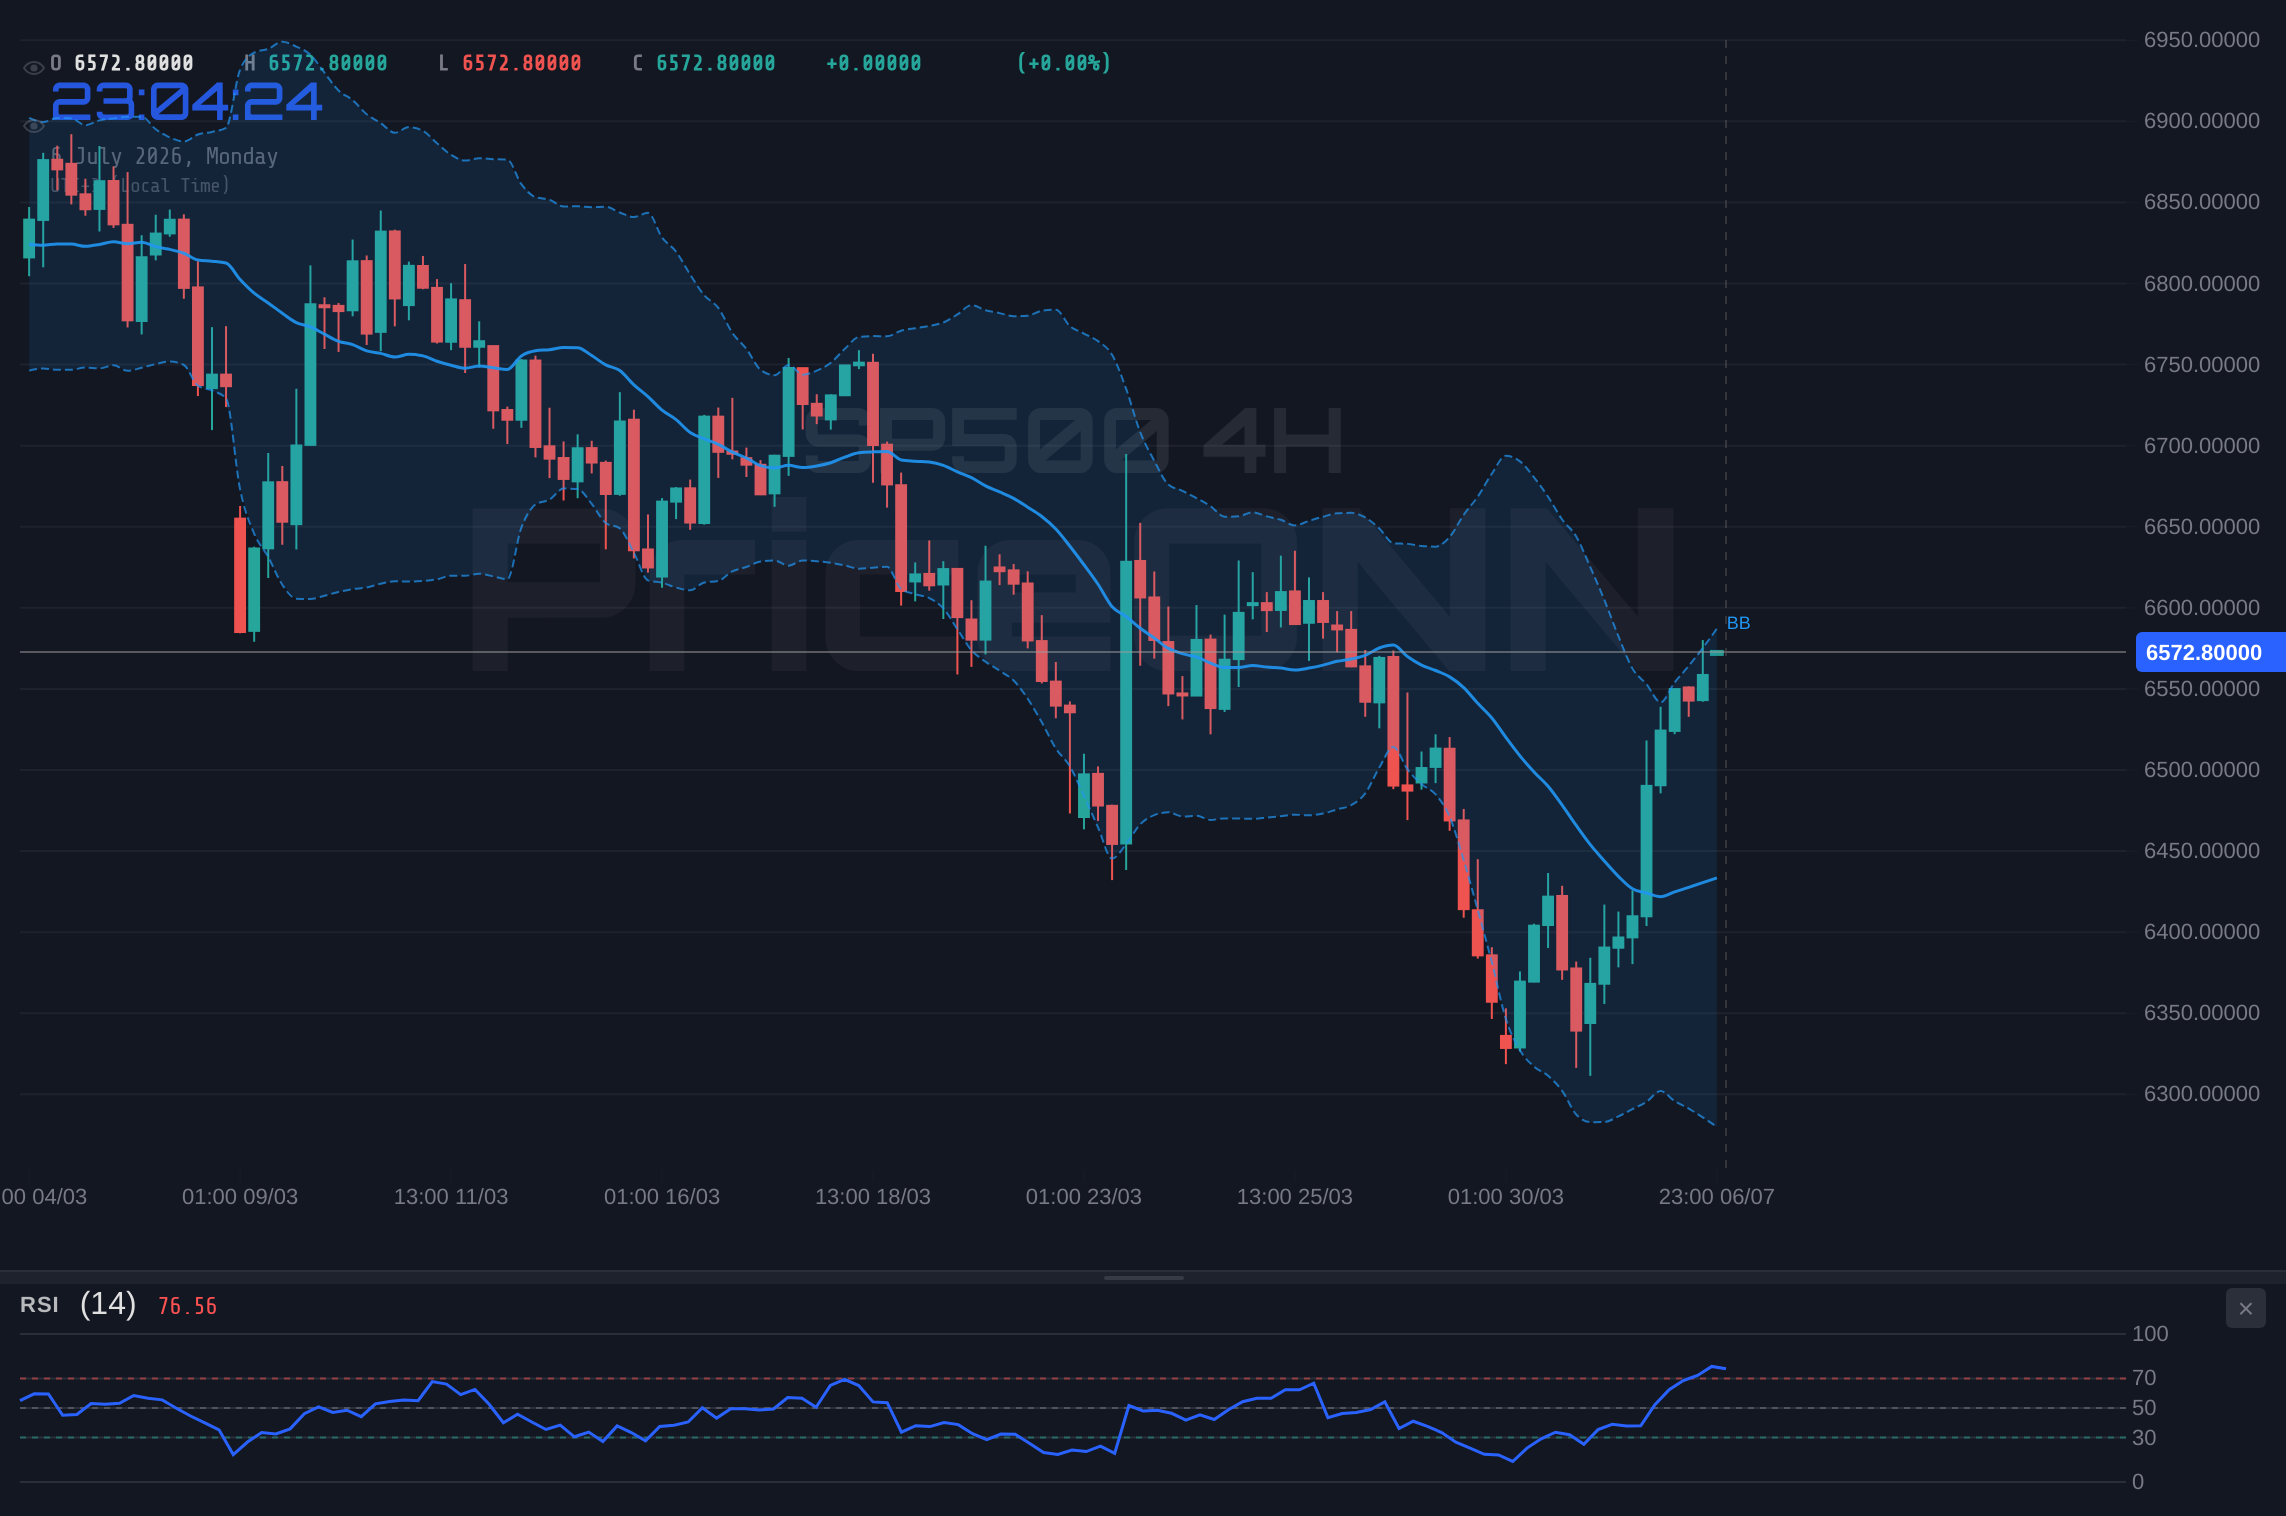
Shifting to the 4-hour chart, the RSI sits at 62.83, still in neutral territory but leaning towards the bullish side, suggesting room for further upside before becoming overbought. The Stochastic here shows a more extreme reading, with %K at 97.85 and %D at 86.96, firmly in overbought territory and flashing a bearish signal. This is a key divergence from the 1-hour chart and warrants caution. The ADX at 24.23 indicates a moderate upward trend, less aggressive than the 1-hour reading. The MACD on this timeframe shows positive momentum with the MACD line above its signal line, reinforcing a generally bullish short-to-medium term outlook, albeit one that needs to contend with the overbought Stochastic.
The daily chart presents a more cautionary outlook for the S&P 500. The RSI is at 45.35, comfortably in the neutral zone and showing a slight downward eğilimi, suggesting that the recent upward push may be losing traction on a longer-term basis. The MACD histogram is negative, and while the MACD line is above its signal line, the overall momentum appears to be waning. The Stochastic indicator, with %K at 42.97 and %D at 29.88, shows a bullish signal, which contradicts the RSI and MACD's lack of strong conviction. However, the ADX at 47.51 is a significant factor, indicating a strong downward trend on the daily chart. This daily bearish ADX, despite some conflicting shorter-term signals, suggests that any upside may be met with significant selling pressure from longer-term traders and institutions.
The S&P 500 is currently approaching a significant resistance area between $6,561.07 and $6,577.27. A decisive break above this zone, particularly on increased volume, would be needed to confirm a continuation of the bullish trend. Conversely, failure to break higher here could lead to a pullback towards the support levels.
Looking at the price levels, the immediate resistance for the S&P 500 is clearly defined. On the 1-hour chart, resistance is seen at $6,568.73, $6,577.27, and $6,589.83. The 4-hour chart aligns with this, showing resistance at $6,551.93, $6,561.07, and $6,570.63. The daily chart extends this resistance zone higher, with key levels at $6,605.07, $6,685.83, and $6,832.67. Given the current price of $6,572.87, the index is sitting squarely within the confluence of short-term resistance levels. A sustained move above $6,577.27 would be crucial for bulls to target higher grounds, while a rejection from this zone could initiate a move lower.
On the support side, the picture is equally important for traders to monitor. The 1-hour chart provides immediate support at $6,547.63, $6,535.07, and $6,526.53. The 4-hour chart reinforces this, with support at $6,533.23, $6,523.67, and $6,514.53. The daily chart indicates more significant support levels much lower, at $6,377.47, $6,230.63, and $6,149.87. The current price of $6,572.87 is well above the immediate hourly and 4-hourly support levels. This suggests that while the immediate upside might be capped by resistance, the downside risk is somewhat contained by these nearer-term support structures, at least from a short-term trading perspective. The proximity of the current price to the $6,577.27 resistance is the more pressing concern for intraday traders.
Intermarket Dynamics and Risk Sentiment
The performance of oil, particularly WTI and Brent crude, often serves as a barometer for global economic health and inflation expectations, both of which directly influence equity markets. Brent crude is trading around $72.16, showing a slight upward trend on the 1H chart but a strong bearish trend on the 1D chart (ADX 42.94), sitting in oversold territory (RSI 27.65). WTI is at $69.06, with a similar pattern: bullish on 1H but bearish on 1D (ADX 39.89) and oversold (RSI 28.38). This oversold condition in oil, combined with the bearish daily trend, could signal potential downside risks for inflation expectations, which in turn might reduce the urgency for aggressive central bank tightening. This could provide a tailwind for equities if it leads to a more dovish outlook from policymakers, although the current strong ADX on the daily charts suggests these trends are firmly in place for now.
The correlation between the major US indices themselves also provides valuable insight. The Nasdaq 100 is showing a strong bullish trend on the 1H (90% strength) and 4H (95% strength) charts, trading at $29,702.83. However, its daily chart trend is also classified as bullish, albeit with lower strength (78%). The Dow Jones Industrial Average, trading at $53,080, shows a predominantly bullish picture across all timeframes, with 1H and 4H trends rated at 93% and 98% strength respectively, and a 100% strong bullish trend on the daily. The fact that the Nasdaq and Dow are showing stronger bullish conviction across more timeframes than the S&P 500, which has a strong bearish daily trend, could indicate a rotation within the broader market itself. Tech-heavy indices like the Nasdaq might be showing resilience while other market segments are feeling the pressure, contributing to the S&P 500's mixed signals.
The recent news highlighting a 'rotation' in the US stock market aligns with these observations. It suggests that capital might be shifting away from certain high-flying sectors towards more defensive or value-oriented areas. This kind of rotation often occurs when the market anticipates a shift in economic or monetary policy, or when current valuations in certain sectors become stretched. The fact that the S&P 500 is approaching resistance around $6,572.87 while showing conflicting signals across timeframes further supports the idea that this rotation is creating uncertainty. Traders are likely waiting for clearer direction, perhaps from upcoming economic data or central bank commentary, to confirm the next major trend.
The divergence between the strong daily bearish ADX (47.51) for the S&P 500 and the strong bullish signals on shorter timeframes (1H, 4H) creates a 'tug-of-war' scenario. This suggests that while short-term traders might find opportunities on the long side, longer-term trend followers should remain cautious and look for confirmation of a sustained daily trend reversal before committing significant capital to the upside.
The geopolitical backdrop, though not explicitly detailed in the provided data, is always a silent driver of market sentiment. Any escalation of global tensions typically fuels demand for safe-haven assets like gold (currently at $4,163.62, showing a mixed RSI profile across timeframes) and can put pressure on riskier assets like equities. Conversely, periods of geopolitical calm tend to encourage risk-on sentiment, benefiting indices like the S&P 500. While no specific geopolitical events are highlighted in the recent news, the general market environment remains sensitive to such developments. The current consolidation around resistance levels could be exacerbated by any unexpected geopolitical news, leading to a sharp downside move.
Trade Scenarios and Outlook
Bearish Scenario: Resistance Holds Firm
65% ProbabilityNeutral Scenario: Consolidation Around Resistance
25% ProbabilityBullish Scenario: Breakout Confirmation
10% ProbabilityThe current technical setup for the S&P 500, trading at $6,572.87, suggests that the path of least resistance in the very short term might be sideways consolidation as the market digests the recent gains and assesses upcoming economic data. The strong daily bearish ADX (47.51) remains a significant overhang, implying that any rallies might be met with selling pressure from longer-term participants. However, the bullish signals on the 1-hour and 4-hour charts, coupled with the supportive price action around the $6,533.23 level, indicate that bulls are still in play on shorter timeframes. The key will be how the index behaves around the $6,577.27 resistance. A failure to break through this level could easily trigger the bearish scenario, leading to a test of the lower support levels.
For traders, the current environment calls for a disciplined approach. The mixed signals and the approaching resistance zone necessitate caution. Scalpers and short-term traders might look for opportunities around the immediate support and resistance levels, aiming to capture small moves within the range. Swing traders, however, would be wise to wait for a clearer signal – either a confirmed breakout above the $6,577.27 resistance on significant volume, or a decisive breakdown below the $6,533.23 support. The market sentiment, influenced by factors like the DXY's mixed signals and the oversold conditions in oil, suggests that a significant catalyst, perhaps from upcoming economic data or central bank communication, is needed to provide a definitive direction. Patience and risk management are key as the S&P 500 navigates these critical levels.
Frequently Asked Questions: SP500 Analysis
What happens if SP500 fails to break above $6,577.27 resistance?
If the SP500 fails to break decisively above $6,577.27 resistance, the bearish scenario becomes more probable. This could lead to a pullback towards the immediate support level at $6,533.23, with a potential extension towards $6,514.53 if selling pressure intensifies.
Should I consider buying SP500 at current levels around $6,572.87 given the mixed signals?
Buying at current levels around $6,572.87 carries risk due to the proximity of resistance and conflicting signals across timeframes. A more prudent approach would be to wait for confirmation: either a clear breakout above $6,577.27 (10% probability bullish scenario) or a confirmed breakdown below $6,561.07 (65% probability bearish scenario).
Is the RSI at 62.83 on the 4H chart a sell signal for SP500 right now?
An RSI of 62.83 on the 4-hour chart is generally considered neutral-to-bullish, indicating upward momentum without being fully overbought. However, the extreme overbought readings on the 1-hour RSI (70.95) and Stochastic suggest caution, and this RSI level alone is not a definitive sell signal.
How might the DXY's mixed trend signals affect SP500's direction this week?
The DXY's conflicting trends (bearish 1H, bullish 1D) add to market uncertainty. A stronger dollar, indicated by the bullish daily DXY trend, typically pressures the SP500. Conversely, dollar weakness could support equities. This indecision in the dollar likely contributes to the SP500's current consolidation around resistance.
| Indicator | Value | Signal | Interpretation |
|---|---|---|---|
| RSI (14) | 62.83 | Neutral | Slight upward bias on 4H, bearish on 1D (45.35) |
| MACD Histogram | Positive | Bullish Momentum | Momentum fading on daily, positive on shorter frames |
| Stochastic | K=97.85, D=86.96 | Bearish Cross Signal | Overbought on 4H, potential reversal sign |
| ADX | 47.51 | Strong Down Trend | Daily trend is strongly bearish, overriding shorter-term signals |
| Bollinger | Middle Band | Watch | Price hovering around middle band, indicating consolidation |
Track markets in real-time
AI-powered analysis, technical indicators and real-time price data.
Join Our Telegram Channel
Breaking market news, AI analysis and trading signals instantly.
Join Channel