

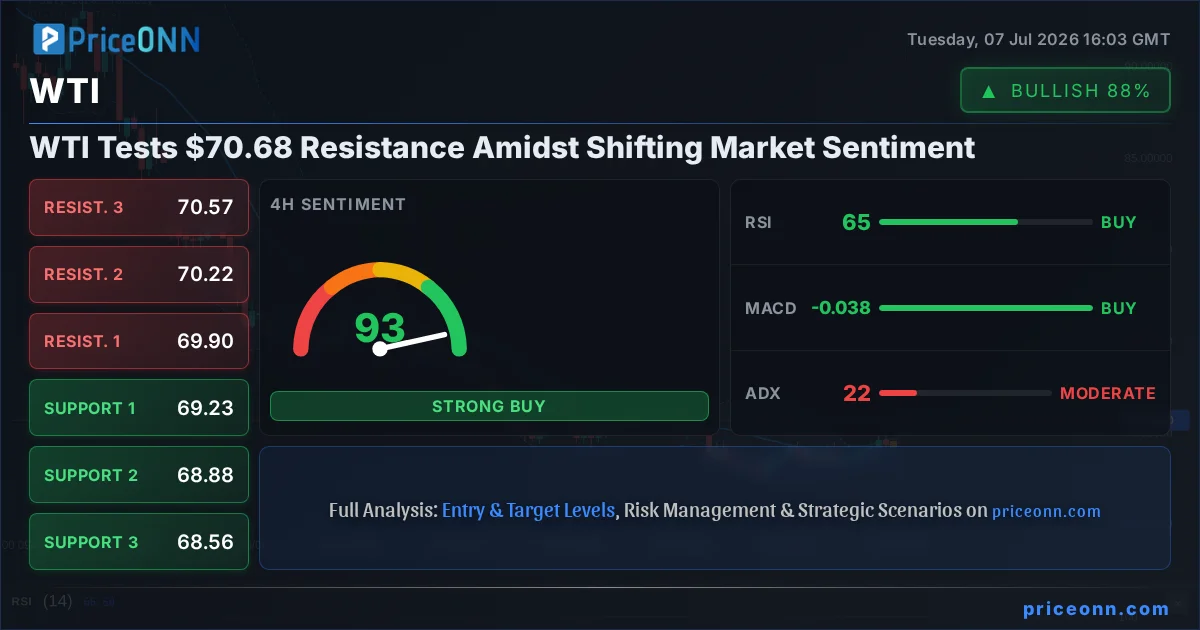
The energy market is at a critical juncture, and the latest price action in WTI crude oil around the $70.68 mark is demanding close attention. While a recent surge has pushed prices higher, the technical indicators are flashing a clear warning sign. This isn't just about a single commodity; it's about understanding the broader market forces - from the dollar's strength to shifting risk appetite - that are shaping the landscape for energy traders right now. The question isn't whether WTI will move, but rather, in which direction, and what are the crucial levels to watch as we navigate this complex environment.
- WTI crude oil is currently trading at $70.68, facing resistance as the 1-hour RSI sits at 72.41, indicating potential overbought conditions.
- Key support for WTI is observed at $70.08, with resistance levels to watch at $74.01 and $74.34.
- The ADX at 24.52 suggests a moderate uptrend, but conflicting signals from other indicators warrant caution.
- Correlations with the DXY (currently at 100.97) and SP500 (trading at 6572.87) are critical, with a stronger dollar and risk-off sentiment potentially capping oil gains.
Navigating the Shifting Sands: WTI's Current Standoff at $70.68
The Dollar's Shadow Over Oil
The intricate dance between the US Dollar Index (DXY) and crude oil prices is a perennial theme in energy markets, and today is no exception. With the DXY currently hovering around 100.97, its upward momentum is a significant factor weighing on dollar-denominated commodities like WTI. A stronger dollar generally makes oil more expensive for holders of other currencies, potentially dampening demand. However, the relationship isn't always linear. Geopolitical tensions, which often drive oil prices higher, can also spur demand for the dollar as a safe-haven asset, creating a complex feedback loop. Today, the DXY's climb suggests that dollar strength is a more dominant force, creating headwinds for WTI bulls aiming to push past the immediate resistance near $70.68. The 1-hour chart shows the DXY at 100.97, with a general signal leaning towards 'Buy', underscoring the pressure it can exert on oil.
Risk Appetite and the SP500 Correlation
Beyond currency dynamics, the broader market's risk sentiment plays a pivotal role. The SP500, a key barometer of investor confidence, is currently trading at 6572.87, showing a mixed picture across different timeframes but with a notable decline on the daily chart. A risk-off environment, often signaled by falling equity indices, typically leads investors away from riskier assets like commodities and towards safer havens. While oil can sometimes act as an inflation hedge, its correlation with equities during periods of market uncertainty is undeniable. If the SP500 continues to face selling pressure, it could signal a broader deleveraging trend, impacting WTI by reducing speculative demand and raising concerns about future global economic activity. The 1-hour SP500 trend is strong bullish at 6572.87, but the daily trend is bearish, highlighting this internal conflict and the uncertainty it breeds.
Technical Cross-Currents on the WTI Chart
The 1-Hour Picture: Overbought Signals Emerge
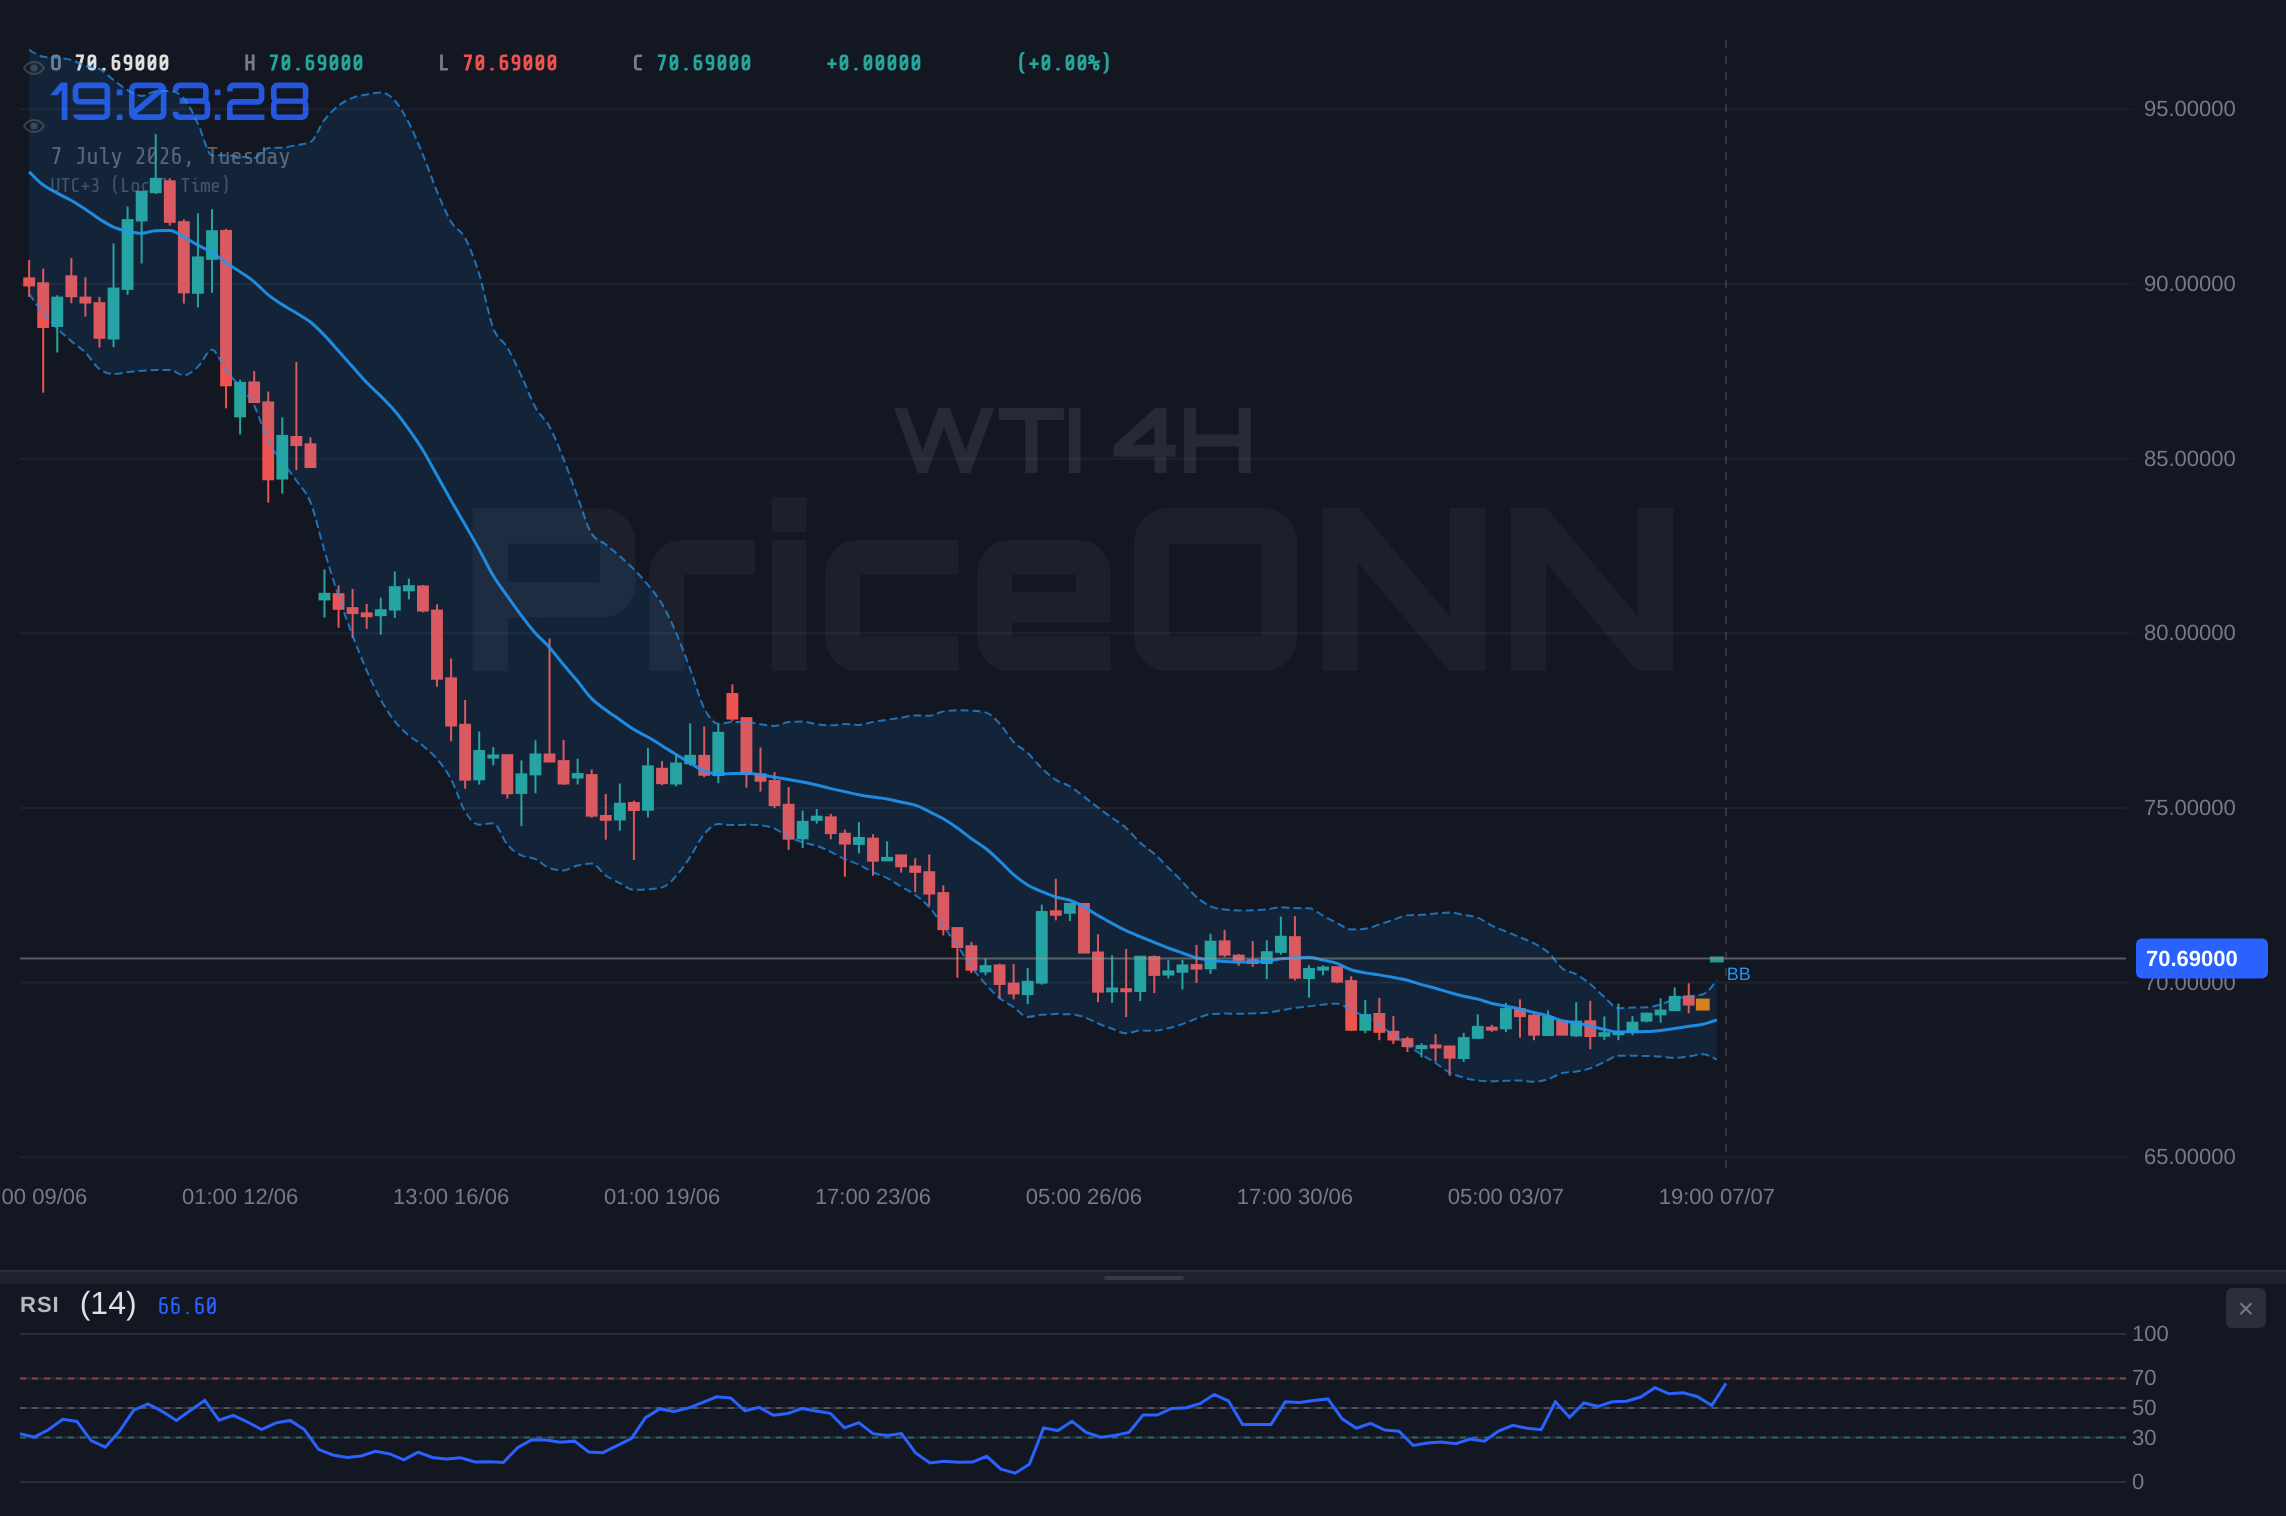
Diving into the shorter timeframes, the 1-hour chart for WTI presents a cautionary tale. The price is testing resistance levels around $70.68, and the Relative Strength Index (RSI) at 72.41 is firmly in overbought territory. This suggests that the recent upward move may have been overextended, increasing the probability of a pullback or consolidation. The Stochastic indicator, with %K at 90.47 and %D at 59.32, also points towards an overbought condition, reinforcing the idea that buyers might be losing steam. While the MACD shows positive momentum, it's the confluence of high RSI and Stochastic readings that demands attention. The ADX at 24.52 indicates a moderate uptrend, but this strength could be tested if the overbought conditions lead to profit-taking. The overall signal for the 1-hour timeframe is 'Buy' (7 Buys, 1 Sell), but the overbought indicators suggest this signal might be nearing a reversal point.
The 4-Hour Perspective: A Mixed Signal
Shifting to the 4-hour timeframe, the picture for WTI becomes more nuanced. The price is still showing a generally bullish inclination, with the MACD indicating positive momentum and the Stochastic (%K=86.92, %D=59.49) signaling a strong buy. The RSI at 64 is in neutral territory, suggesting room for further upside, but it's not as extreme as the 1-hour reading. Bollinger Bands are above the middle band, supporting the bullish trend. However, the ADX at 21.43 still points to a moderately strong uptrend, and the overall signal leans heavily 'Buy' (7 Buys, 1 Sell). The divergence between the shorter-term overbought signals and the slightly more optimistic 4-hour outlook highlights the indecision at current price levels. This is where traders need to be particularly vigilant, as short-term exhaustion could clash with the prevailing medium-term trend.
Daily Timeframe: Underlying Weakness?
Zooming out to the daily chart, the situation for WTI becomes even more complex, revealing potential underlying weakness despite the recent rally. The daily RSI stands at 33.51, firmly in oversold territory, and the Stochastic indicator (%K=35.12, %D=16.93) is showing a 'Buy' signal, suggesting a potential bounce is underway or overdue. The MACD is positive, and Bollinger Bands are below the middle band, indicating a bearish tendency that might be ripe for a reversal. However, the ADX at 40.23 signifies a strong downtrend, contradicting the oversold indicators and suggesting that any upward movement might be a counter-trend rally rather than a sustainable trend change. The overall signal for the daily timeframe is 'Sell' (2 Buys, 5 Sells), which starkly contrasts with the shorter timeframes and raises concerns about the longevity of the current price action. This daily bearishness, despite oversold indicators, is a critical point of caution.
Geopolitical Undercurrents and Energy Market Dynamics
The OPEC+ Factor: Production Quotas and Market Stability
The decisions made by OPEC+ continue to be a primary driver of global oil prices, influencing both supply dynamics and market sentiment. While the specific details of their latest production quotas aren't provided in the live data, the market's reaction to these announcements is always significant. Historically, OPEC+ actions aimed at stabilizing the market by limiting supply have supported prices. However, compliance issues, differing national interests, and the rise of non-OPEC production can complicate these efforts. Any perceived disunity or deviation from agreed-upon quotas can quickly lead to price volatility. The current upward movement in WTI, despite bearish signals on the daily chart, might be partially fueled by expectations of continued supply discipline from the cartel, or perhaps anticipation of future production cuts. Investors are constantly assessing whether the supply side can adequately balance global demand, especially in the face of economic uncertainties.
Inflationary Pressures and the Energy Nexus
Crude oil prices are intrinsically linked to inflation expectations. As a fundamental input for transportation, manufacturing, and numerous other industries, rising oil prices can directly contribute to broader inflationary pressures. Central banks, particularly the Federal Reserve and the European Central Bank, are acutely aware of this relationship. Their monetary policy decisions - interest rate hikes or pauses - are often influenced by inflation data, which in turn is impacted by energy costs. The current data doesn't provide specific inflation figures, but the general market context of central bank actions implies that inflation remains a key concern. If oil prices continue to climb significantly, it could force central banks to maintain tighter monetary policies for longer, potentially dampening economic growth and, paradoxically, eventually reducing oil demand. This delicate balance is a constant source of market tension.
Trade Scenarios and Strategic Considerations
Given the conflicting signals across different timeframes and the interplay of technical and fundamental factors, a multi-scenario approach is essential for navigating WTI at $70.68. The market is currently at a crossroads, and the path forward will likely depend on key catalysts. The resistance level at $70.68 is proving to be a significant hurdle, and a decisive break above it would require strong conviction, while a failure to hold support around $70.08 could signal a deeper correction. Traders must remain adaptable, prepared for both bullish continuation and bearish reversals.
Bearish Scenario: Profit-Taking Pressure Mounts
65% ProbabilityNeutral Scenario: Range-Bound Consolidation
25% ProbabilityBullish Scenario: Resistance Breakout
10% ProbabilityThe Road Ahead: What to Watch
Traders should exercise caution due to the conflicting signals across timeframes and the potential for increased volatility surrounding key economic data releases and geopolitical events. Always manage risk appropriately and consider stop-loss orders.
The coming days will be crucial for WTI. The immediate focus will be on whether the $70.68 resistance holds or breaks. A decisive move below $70.08 could trigger significant downside, especially if the DXY continues to strengthen and risk sentiment sours. Conversely, a strong break above $71.17, supported by positive news flow or a shift in central bank expectations, could pave the way for further gains. The daily chart's bearish undertones, coupled with shorter-term overbought conditions, suggest that patience is a virtue. Waiting for clearer confirmation - either a confirmed break of resistance or a decisive move through support - will be key to capturing the next significant trend. The interplay between supply-side discipline, global demand outlook, and macroeconomic policy will ultimately dictate the price direction.
Frequently Asked Questions: WTI Analysis
What happens if WTI breaks below the $70.08 support level?
A break below $70.08 would invalidate the short-term bullish momentum and could lead to a further decline. The next significant support levels to watch would be $69.69, followed by $69.34, as indicated by the 1-hour and daily charts.
Is the RSI at 72.41 a sell signal for WTI right now?
An RSI reading of 72.41 on the 1-hour chart indicates an overbought condition, suggesting that the recent upward move might be exhausted. While not an immediate sell signal on its own, it warrants caution and suggests that a pullback or consolidation is likely, especially if it fails to break higher resistance levels.
How will a stronger DXY at 100.97 affect WTI prices?
A stronger DXY generally puts downward pressure on dollar-denominated commodities like WTI, as it makes oil more expensive for holders of other currencies. This can dampen demand and cap potential price rallies, making it harder for WTI to break above resistance levels like $70.68.
What is the key resistance level to watch for WTI if it continues to rise?
If WTI manages to overcome the immediate resistance around $70.68, traders should watch the $71.17 level closely. A sustained break above this point would be a significant bullish signal, potentially opening the way towards higher targets around $71.56 and $72.04.
Track markets in real-time
AI-powered analysis, technical indicators and real-time price data.
Join Our Telegram Channel
Breaking market news, AI analysis and trading signals instantly.
Join Channel