

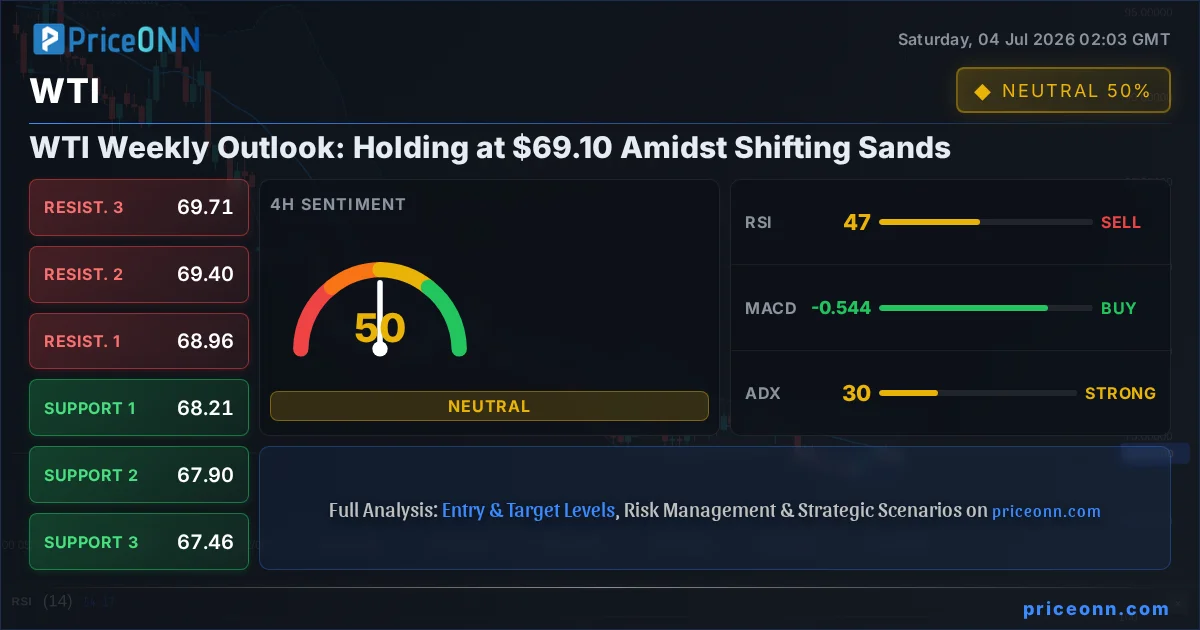
The past week in the WTI crude oil market has been a masterclass in caution, with prices consolidating around the critical $69.10 mark. As we close out the week, the overarching narrative is one of a persistent bearish trend, despite brief rallies that ultimately succumbed to selling pressure. This isn't just about numbers on a chart; it's about the fundamental undercurrents - from shifting economic data to geopolitical whispers - that are dictating the path of least resistance for this vital energy commodity. For traders and analysts alike, understanding the interplay of these forces is paramount to navigating the choppy waters ahead. The question isn't whether volatility will persist, but rather which direction the sustained pressure will ultimately favor.
- WTI crude oil is consolidating around $69.10, with the 1H chart showing a neutral trend (Strength: 50%) and the 4H showing a neutral trend (Strength: 50%) while the 1D trend is bearish (Strength: 100%).
- Key support for WTI lies at $68.74, $68.47, and $68.31, while resistance is seen at $69.17, $69.33, and $69.60, according to the 1H timeframe data.
- The RSI(14) on the 1H chart is at 55.8, indicating a neutral but upward-sloping momentum, while the 4H RSI is at 46.56, suggesting a downward drift. The daily RSI at 28.49 points to oversold conditions.
- The ADX indicator shows a weak trend (17.1) on the 1H, strong downtrend (30.36) on the 4H, and a strong downtrend (38.84) on the daily, indicating prevailing downward momentum.
- The overall signal on the 1H and 4H is mixed (Neutral: 4, Buy: 4, Sell: 4), but the daily timeframe leans heavily towards selling (Sell: 5, Buy: 2, Neutral: 0), reinforcing the bearish trend outlook.
Navigating the Bearish Tide: A Weekly Recap
Last week was characterized by a distinct tug-of-war in the WTI crude oil market, with prices ultimately succumbing to bearish pressures, closing near the $69.10 level. While brief rallies attempted to reclaim higher ground, particularly on Thursday and Friday, they lacked sustained conviction. The softer US jobs data released on Friday, which initially provided some support by tempering expectations of aggressive Federal Reserve rate hikes, proved insufficient to fundamentally alter the supply-demand narrative that has been weighing on prices. This data point, while significant for broader market sentiment, did not override the ongoing concerns about global demand and the easing of supply-side tensions, especially concerning the Strait of Hormuz. The market's reaction to this data exemplifies a broader theme: positive news, while momentarily boosting sentiment, struggles to gain traction against a backdrop of bearish fundamentals.
PriceONN's own market analysis echoed this sentiment throughout the week. Early in the week, reports indicated WTI under pressure with US Non-Farm Payrolls (NFP) data in sharp focus, suggesting a potential for further downside. This was followed by news of WTI slipping below $68.00 as supply concerns eased, a clear signal that the market was pricing in a less restrictive supply environment. By mid-week, WTI extended losses as recovering Hormuz flows and the OPEC+ supply outlook continued to weigh on sentiment. Reports of resuming US-Iran talks also contributed to this narrative, suggesting a potential easing of geopolitical risk premiums that had previously supported prices. The market's consistent reaction to these developments underscores a bearish bias, where any news easing supply constraints or signaling weaker demand is met with selling pressure.
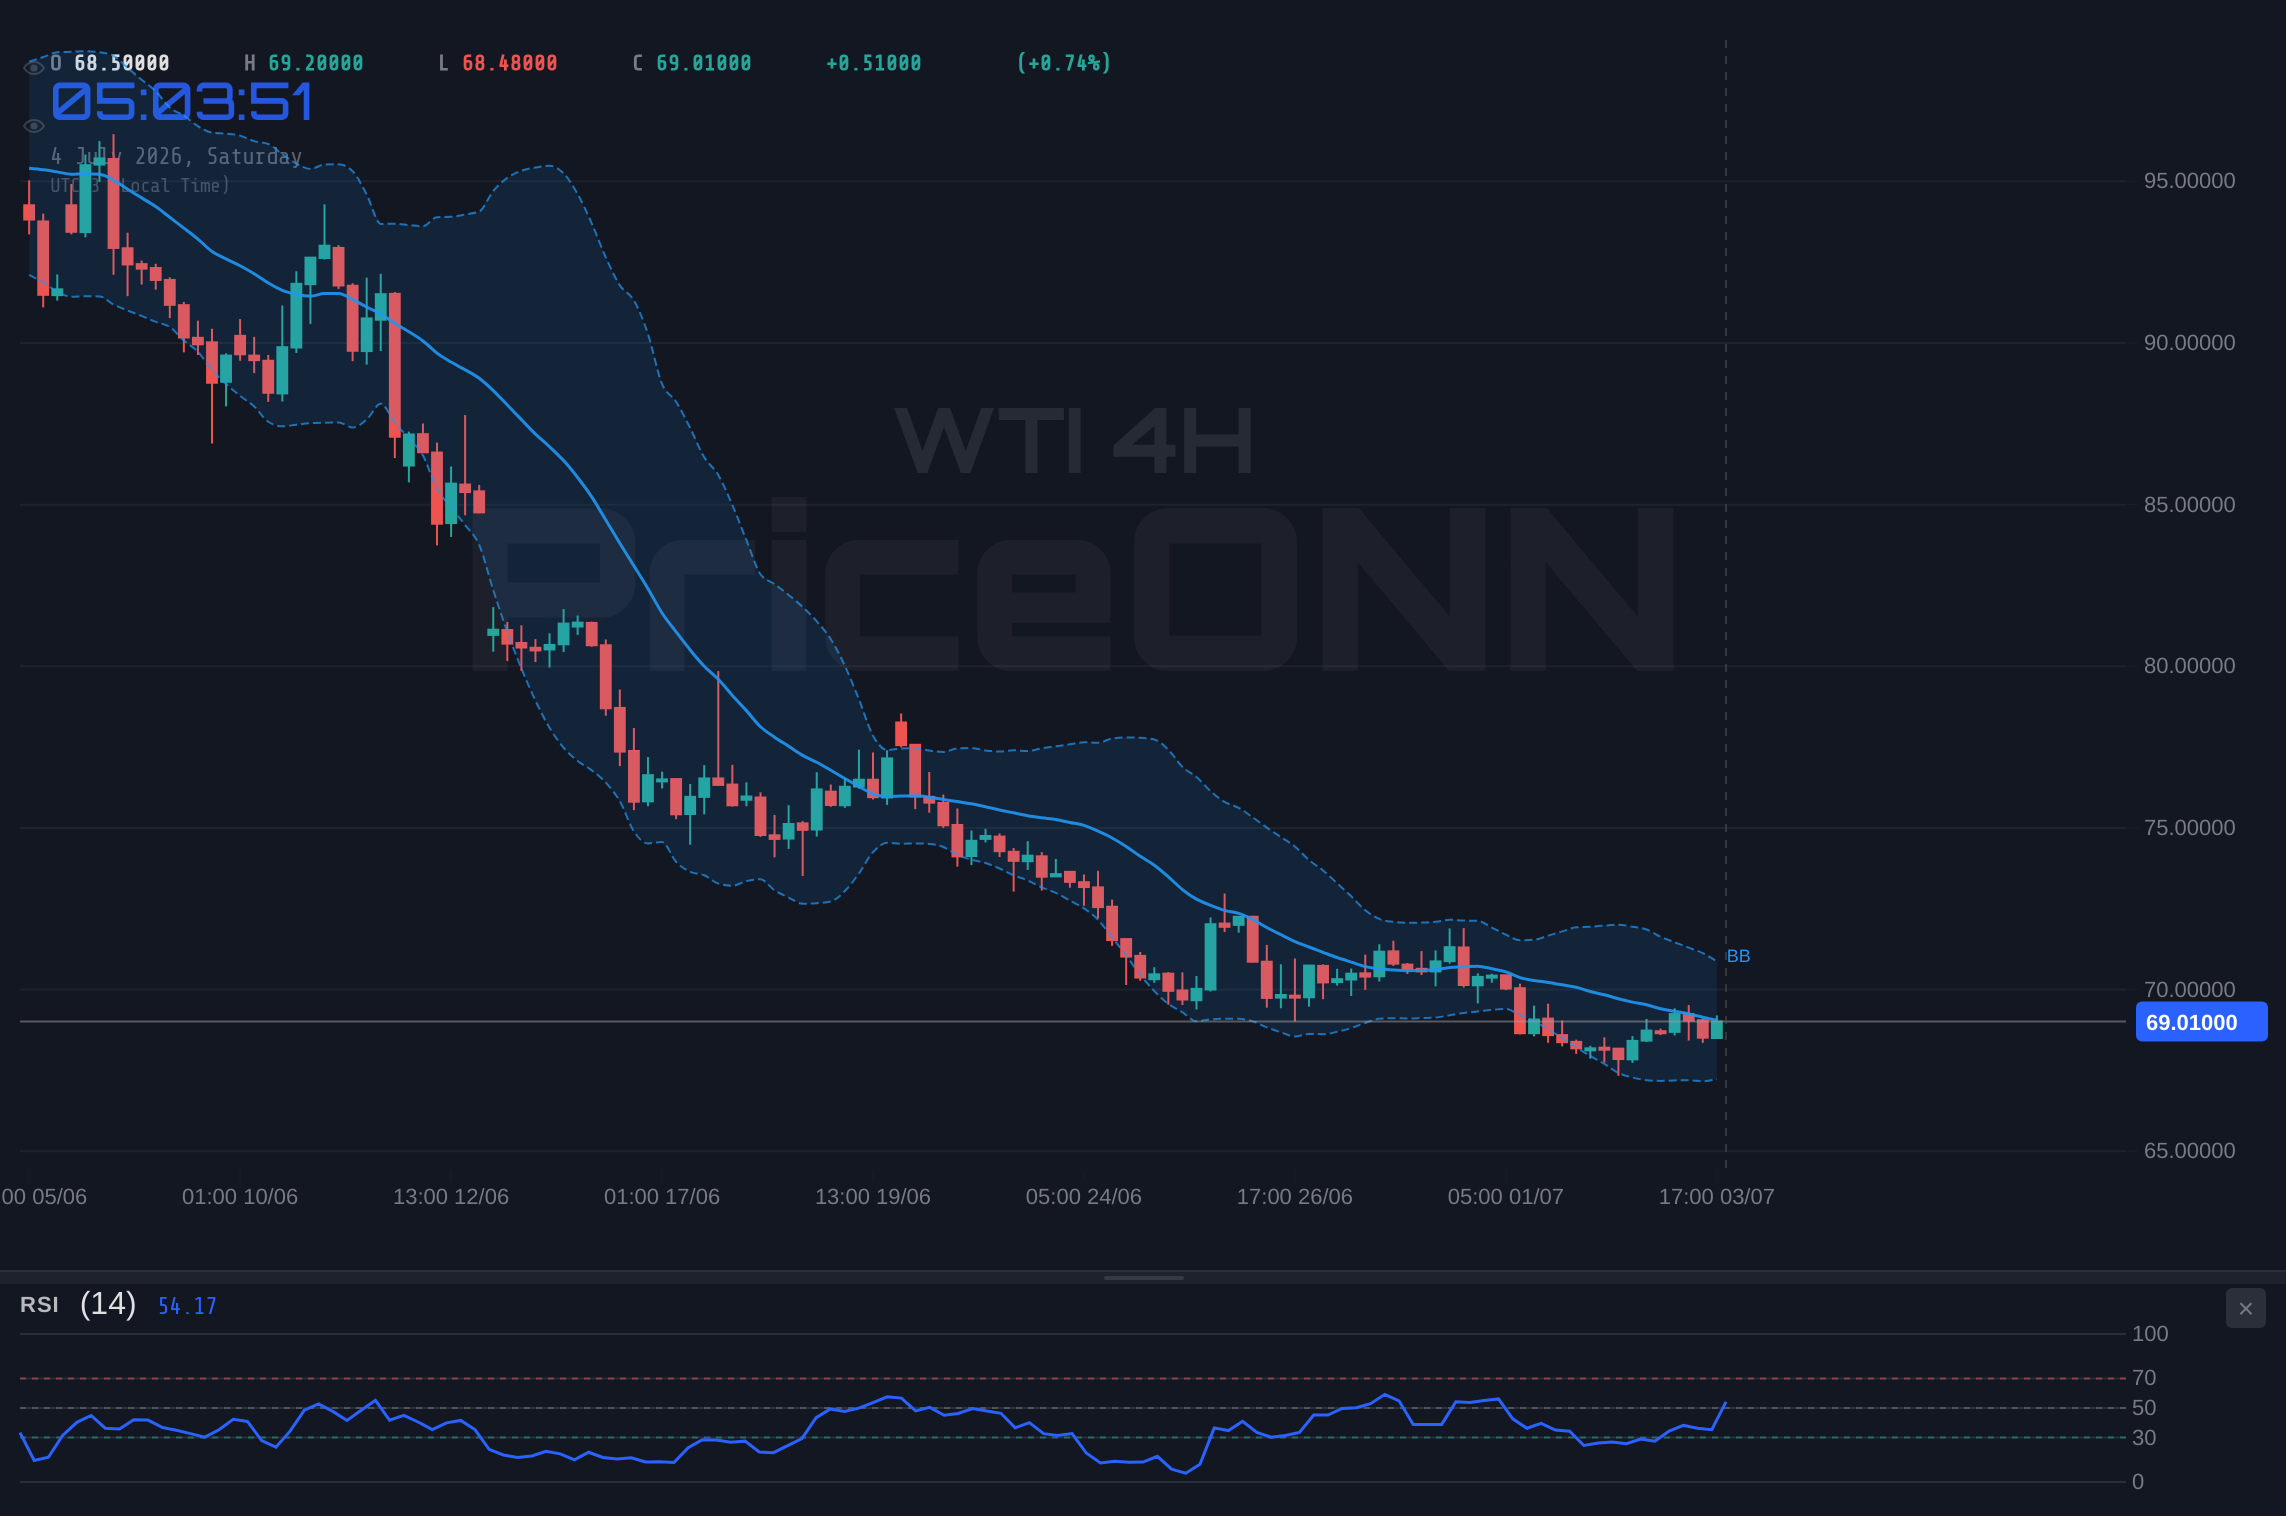
The technical indicators, particularly on the daily timeframe, reinforce this bearish outlook. The ADX at 38.84 signifies a strong, established downtrend, a far cry from the weak trend readings seen on shorter timeframes. This divergence between timeframes is crucial: while intraday traders might see fleeting opportunities, the longer-term trend remains firmly in control. The daily RSI at 28.49 signals oversold conditions, which might suggest a potential for a short-term bounce, but it does not negate the strength of the prevailing downtrend. Historically, an oversold RSI in a strong downtrend can persist for extended periods, offering little respite to bulls. This technical picture, combined with the fundamental backdrop, paints a cautious scenario for WTI heading into the new week.
Fundamental Underpinnings: Demand, Supply, and Geopolitics
The price action in WTI crude oil this past week cannot be understood without delving into the fundamental drivers that are shaping the market. On the demand side, the economic data has been decidedly mixed, but with a noticeable cooling trend emerging. The softer US jobs data, while potentially easing Fed rate hike fears, also signals a potential slowdown in economic activity and, consequently, oil consumption. This aligns with PMI data from major economies showing mixed signals, with some regions indicating contractionary territory. The narrative of resilient global demand, often cited by bullish analysts, is facing increasing scrutiny as inflation persists and central banks maintain a hawkish stance, albeit with nuanced adjustments. The market is keenly watching for any definitive signs of a global economic slowdown, which would inevitably translate into reduced oil demand.
On the supply side, the narrative has shifted significantly over the past few weeks. The easing of tensions surrounding the Strait of Hormuz, coupled with reports of increased shipping traffic, has directly alleviated some of the geopolitical risk premium that had been artificially inflating prices. While the situation remains fluid, the market's perception has shifted from imminent supply disruption to a more stable, albeit still tense, outlook. Furthermore, the OPEC+ group's production decisions continue to be a focal point. While they have maintained production cuts, the market is increasingly factoring in compliance levels and potential future adjustments based on demand forecasts. Reports from PriceONN highlighted WTI extending losses as recovering Hormuz flows and the OPEC+ supply outlook weighed. This suggests that the market is currently more sensitive to signs of increasing supply, whether from geopolitical de-escalation or potential shifts in cartel policy, than to the existing production cuts.
Geopolitical factors, while often a source of volatility, have recently leaned towards de-escalation, at least concerning major oil-producing regions. The reports of renewed US-Iran talks, while not guaranteeing an immediate resolution, have dampened immediate fears of supply disruptions. This reduction in perceived geopolitical risk has removed a significant prop from under oil prices. It's crucial to remember that geopolitical events can change rapidly, and any resurgence in tensions would undoubtedly reintroduce volatility. However, for the current week, the absence of immediate escalation has allowed fundamental supply-demand dynamics to take center stage, which, as evidenced by the price action, are currently tilted bearishly. This reduction in the geopolitical risk premium is a key reason why WTI has struggled to find sustained upside momentum, even on news that might have previously triggered a strong rally.
Technical Analysis: Reading the Charts at $69.10
The technical landscape for WTI crude oil, particularly when viewed through the lens of multiple timeframes, presents a complex picture but ultimately reinforces the bearish undertone observed in the fundamentals. On the 1-hour chart, the trend is currently neutral with a strength of 50%, reflecting intraday fluctuations. Here, the RSI(14) at 55.8 shows a slight upward bias, and the Stochastic indicator (%K: 67.41, %D: 46.78) provides a bullish signal, suggesting potential for short-term gains. However, this is counteracted by negative MACD momentum and an ADX reading of 17.1, indicating a weak trend. This intraday noise often leads to whipsaws and can be misleading for longer-term directional bets.
Stepping back to the 4-hour chart, the picture remains largely neutral in terms of trend strength (50%). The RSI(14) at 46.56 indicates a downward drift, and the MACD shows negative momentum. The ADX at 30.36 signifies a strong downtrend, aligning with the bearish sentiment. The Stochastic indicator, however, shows a bullish signal (%K: 70.93, %D: 65.5), suggesting potential for a bounce from current levels. This conflict between the RSI/MACD and the Stochastic warrants caution. It implies that while downward momentum is present, there might be an oversold condition forming that could lead to a temporary reversal. The Bollinger Bands on this timeframe are above the middle band, indicating a bullish bias in price positioning, but this needs to be viewed in conjunction with the overall trend strength.
The daily timeframe offers the clearest perspective on the prevailing trend. Here, WTI is firmly in a bearish trend with 100% strength. The ADX at 38.84 confirms a strong downtrend, a level that typically indicates significant market conviction behind the move. The RSI(14) at 28.49 is deep in oversold territory. While this is often seen as a precursor to a potential reversal, in a strong downtrend, it can persist for some time. The MACD is showing negative momentum, and the Bollinger Bands are below the middle band, reinforcing the bearish bias. The Stochastic indicator shows a bullish signal (%K: 12.31, %D: 12.7), indicating extreme oversold conditions. This confluence of strong bearish trend indicators on the daily chart, coupled with oversold readings on oscillators, suggests that while a bounce is possible, the underlying trend remains down. The key support levels to watch on the daily chart are $67.68, $66.62, and $65.92. Resistance levels stand at $69.44, $70.14, and $71.20.
The overall signal across all timeframes is mixed, but the dominance of the daily bearish trend is undeniable. The 1H and 4H charts show some conflicting signals, particularly from the Stochastic oscillator, hinting at potential short-term bounces. However, these shorter-term signals are often absorbed by the stronger, longer-term bearish momentum indicated by the daily ADX and RSI. For a sustained bullish reversal, we would need to see a clear break above daily resistance levels, confirmed by stronger daily RSI and MACD readings, and a sustained decrease in the ADX value. Until then, the path of least resistance appears to be downwards, making any upside move suspect.
Correlation Analysis: DXY, Equities, and the Path of Oil
The interplay between WTI crude oil and broader market indicators like the US Dollar Index (DXY) and major equity indices (S&P 500, Nasdaq) is a critical component of understanding its price movements. This past week, the DXY showed a generally weak trend, with its 4-hour chart indicating a bearish trend (ADX 28.23) and a neutral signal overall. On the daily chart, it showed a strong uptrend (ADX 39.37) and an overall 'AL' signal, creating a mixed picture for the dollar. Typically, a strengthening dollar exerts downward pressure on dollar-denominated commodities like WTI, as it makes them more expensive for holders of other currencies. However, the mixed signals from the DXY this week meant its influence was less pronounced, allowing other fundamental factors to take greater precedence. The fact that WTI showed some resilience despite a potentially strengthening dollar on the daily chart suggests underlying support, or perhaps a decoupling due to specific energy market factors.
Equity markets, as represented by the S&P 500 and Nasdaq, also presented a complex correlation picture. The S&P 500 showed a strong bullish trend on the 1H and 4H charts, but a bearish trend on the daily timeframe. The Nasdaq 100, conversely, showed a neutral trend on the 1H and 1D, but a bearish trend on the 4H. This divergence between indices and even within different timeframes of the same index indicates a lack of clear risk appetite. Historically, WTI tends to move inversely to risk assets when geopolitical tensions are high, acting as a safe haven. However, with geopolitical risk premiums easing, WTI's correlation with equities has become more nuanced. A significant risk-off move in equities, signaled by a sharp decline in the S&P 500 or Nasdaq, could still trigger selling in WTI as investors liquidate across all asset classes. Conversely, a strong risk-on sentiment in equities could provide some indirect support to WTI by signaling robust economic activity.
The current price action suggests that while these correlations exist, they are not the primary drivers. The bearish trend in WTI is largely self-contained, driven by specific supply and demand factors within the energy market itself. The easing of supply concerns, particularly regarding the Strait of Hormuz, and the persistent worries about global demand growth are overriding the influence of a potentially strengthening dollar or mixed equity market signals. For instance, the bearish signal on the daily WTI chart (Sell: 5, Buy: 2, Neutral: 0) stands in contrast to the generally bullish signals seen in the S&P 500 and Nasdaq on shorter timeframes. This divergence highlights the importance of analyzing the primary commodity itself, rather than relying solely on its correlation with broader markets, especially when specific fundamental catalysts are at play.
Economic Calendar Impact and Forward Guidance
The economic calendar for the upcoming week holds several key releases that could significantly influence WTI crude oil prices. While last week saw the impact of softer US jobs data, the focus now shifts to inflation figures and central bank commentary. The upcoming Consumer Price Index (CPI) data, alongside Producer Price Index (PPI) reports, will be crucial in shaping expectations for future monetary policy. If inflation proves stickier than anticipated, it could lead to renewed fears of further interest rate hikes, which would dampen demand expectations for oil and put further pressure on WTI. Conversely, a significant cooling in inflation could bolster the case for central banks to pause or even begin cutting rates, potentially boosting economic growth prospects and, by extension, oil demand.
The Federal Reserve's stance remains a pivotal factor. While recent jobs data might suggest a pause, the Fed's forward guidance will be closely scrutinized. Any indication of a hawkish bias, even amidst slowing growth, could strengthen the US Dollar (DXY) and exert downward pressure on WTI. Conversely, signals of a more dovish approach, perhaps driven by inflation concerns easing, could weaken the dollar and offer some respite to oil prices. This delicate balancing act by central banks is a constant theme, and upcoming speeches or minutes from policy meetings will be dissected for clues. The correlation between the DXY and WTI is significant, and a clear directional move in the dollar, driven by Fed policy expectations, will likely be mirrored in oil prices, albeit with a lag or partial correlation.
Beyond US economic data, European inflation figures and PMI data will also be important. The Eurozone's economic health is a significant component of global oil demand, and any signs of weakness there could exacerbate the bearish outlook for WTI. The recent strength observed in GBP/USD, driven by cooling US labor market data weighing on the US Dollar, indicates that currency markets are sensitive to economic divergences. While WTI is not directly tied to GBP/USD, the underlying economic forces influencing this pair - such as differing inflation rates and central bank policies - are the same forces that will impact oil. Traders will be looking for any indication of a sustained economic slowdown globally, as this would be the most potent catalyst for a significant decline in WTI prices, potentially pushing it below the $68.00 support level.
Price Action and Key Levels to Watch
As we look ahead, the $69.10 current price level for WTI serves as a critical pivot. The immediate resistance sits at $69.17, $69.33, and $69.60. A decisive break and hold above $69.60 would be the first sign of potential bullish reversal, suggesting that the daily oversold RSI might finally be finding traction and that shorter-term bullish signals are being confirmed. Such a move would likely target the next significant resistance level around $70.14, a psychological barrier that has held firm. Further upside would then aim for $71.20, but this would require a substantial shift in market sentiment and fundamentals.
On the downside, the support levels are clearly defined and have been tested. The immediate support is at $68.74, followed by $68.47 and then the more significant psychological level at $68.31. A close below $68.31 on the daily chart would likely trigger further selling, potentially accelerating the move towards the $67.68 support level. The ADX on the daily timeframe at 38.84 indicates that if this support breaks, the trend is strong enough to continue lower. The oversold RSI at 28.49 does offer some hope for a bounce, but it's crucial to remember that oversold conditions can persist. Therefore, any bullish trades should be approached with extreme caution, perhaps looking for confirmation on shorter timeframes after a clear daily close above $69.60, and with tight stop-losses below the immediate support levels.
The mixed signals across different timeframes are the defining characteristic of the current WTI chart. The 1-hour and 4-hour charts show potential for short-term bounces, driven by Stochastic signals and the proximity to support levels. However, the overwhelming bearish trend on the daily chart, supported by strong ADX and negative MACD momentum, suggests that these bounces are likely to be short-lived opportunities for sellers to re-enter the market at better prices. The key takeaway is that while short-term traders might find intraday opportunities, the overall trend remains bearish, and any significant move higher would require overcoming substantial technical and fundamental headwinds. Patience and risk management will be paramount for anyone looking to trade WTI in the coming week.
Scenario Analysis: Charting Potential Paths for WTI
Bearish Scenario: Trend Continuation
70% ProbabilityNeutral Scenario: Range-Bound Consolidation
20% ProbabilityBullish Scenario: Short-Term Reversal
10% ProbabilityFrequently Asked Questions: WTI Analysis
What happens if WTI breaks below the $68.31 support level?
A daily close below $68.31 would invalidate any short-term bullish hopes and likely accelerate selling pressure. The next significant support level to watch would be $67.68, with the strong daily downtrend indicated by the ADX at 38.84 suggesting further downside is probable.
Should I consider buying WTI at current levels around $69.10 given the oversold RSI at 28.49?
While the daily RSI at 28.49 indicates oversold conditions, it's risky to buy solely based on this in a strong downtrend. The prevailing bearish trend (ADX 38.84) suggests that oversold conditions can persist. A more prudent approach would be to wait for confirmation, such as a daily close above $69.60, before considering long positions, with tight stops below immediate support.
Is the bearish ADX reading of 38.84 on the daily chart a strong sell signal for WTI?
An ADX value of 38.84 signifies a very strong trend, and in this context, it's a strong downtrend signal. This indicates that market participants are largely in agreement on the direction, making it difficult for counter-trend moves to gain significant traction. It reinforces the bearish outlook and suggests that any rallies are likely to be met with selling pressure.
How might upcoming inflation data (CPI/PPI) affect WTI prices this week?
Higher-than-expected inflation data could lead to fears of further Fed rate hikes, strengthening the dollar and dampening oil demand expectations, thus pressuring WTI lower. Conversely, cooler inflation could ease rate hike fears, potentially weakening the dollar and supporting oil demand, which might offer some relief to WTI prices, possibly testing resistance levels around $69.60.
| Indicator | Value | Signal | Interpretation |
|---|---|---|---|
| RSI (14) | 28.49 | Oversold | Daily RSI deep in oversold territory, potential bounce but trend is strong. |
| MACD Histogram | -0.45 | Negative Momentum | Daily MACD histogram shows negative momentum, supporting downtrend. |
| Stochastic (%K) | 12.31 | Extreme Oversold | Daily Stochastic %K deep in oversold territory, potential for bounce. |
| ADX | 38.84 | Strong Downtrend | Daily ADX indicates a strong established downtrend. |
| Bollinger Bands | Middle Band | Below Middle Band | Price trading below the middle band on daily chart confirms bearish bias. |
Track markets in real-time
AI-powered analysis, technical indicators and real-time price data.
Join Our Telegram Channel
Breaking market news, AI analysis and trading signals instantly.
Join Channel