

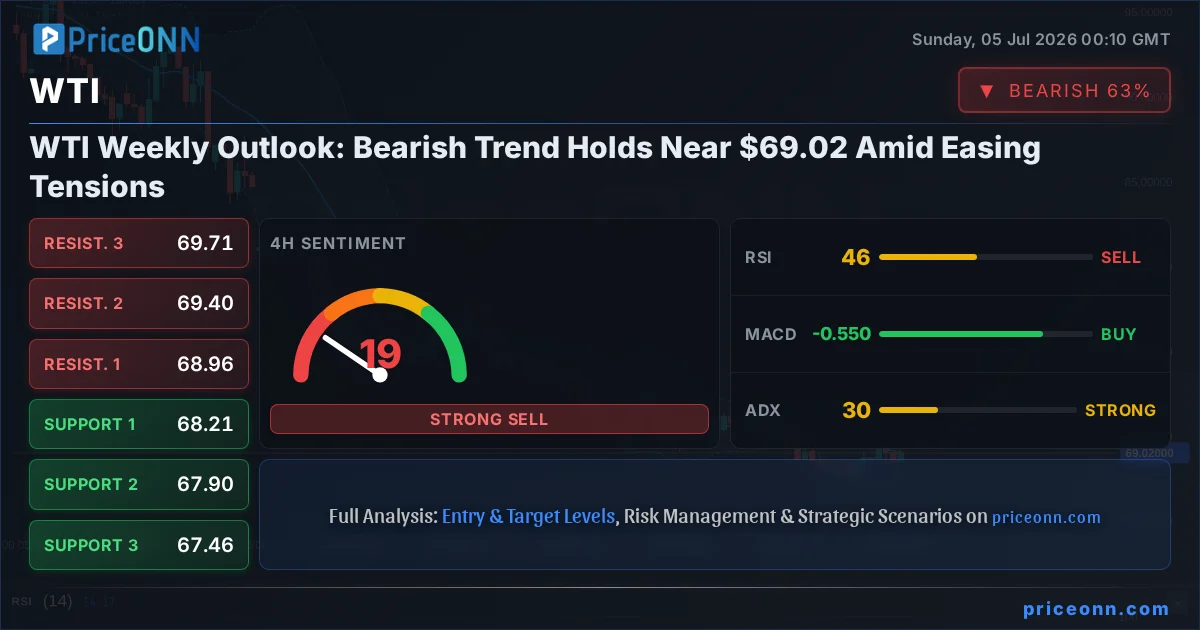
As the market closes for the weekend, West Texas Intermediate (WTI) crude oil finds itself trading around the $69.02 mark, a level that encapsulates a week defined by cautious sentiment and a persistent bearish undertone. This price point, while seemingly stable on the surface, belies a complex interplay of easing geopolitical tensions, shifting macroeconomic expectations, and the ever-present influence of supply-demand dynamics. Having navigated through a volatile trading week, WTI’s recent price action suggests that the prevailing bearish trend, though tested, continues to hold sway. The narrative this past week has been dominated by the cooling of immediate fears surrounding the Strait of Hormuz, coupled with softening economic data from the United States that has tempered expectations for aggressive monetary tightening. These factors have collectively weighed on oil prices, preventing any significant bullish resurgence despite underlying supply concerns that remain a constant backdrop. Understanding the nuances of these competing forces is paramount for traders looking to position themselves for the week ahead.
- WTI crude oil is trading near $69.02, reflecting a week of bearish pressure.
- Critical support for WTI is located at $67.68, with resistance at $72.25.
- Easing Middle East tensions and softer US jobs data have contributed to the bearish sentiment.
- The 1-day ADX at 38.84 indicates a strong downtrend, while RSI at 28.27 signals oversold conditions.
Navigating the Crosscurrents: Geopolitical Shifts and Economic Data
The past trading week presented a fascinating tug-of-war in the WTI crude oil market, with geopolitical developments initially providing a floor before succumbing to broader macroeconomic headwinds. Early in the week, renewed tensions in the Middle East, particularly concerning traffic in the Strait of Hormuz, injected a familiar risk premium into oil prices. Reports of potential disruptions and heightened naval activity fueled concerns about supply chain integrity, pushing WTI prices briefly above $70. This geopolitical risk premium, however, proved to be short-lived. As the week progressed, diplomatic channels appeared to be actively managed, and the immediate threat of significant supply disruption subsided. This easing of tensions allowed fundamental economic considerations to reassert their dominance over market sentiment. The market’s focus shifted from the immediate specter of supply shocks to the more persistent, albeit slower-moving, global demand outlook, heavily influenced by central bank policies and economic growth indicators.
The narrative surrounding supply also evolved. Reports indicated that while risks remain, some flows through critical chokepoints like the Strait of Hormuz were normalizing. This perception of stabilizing, or at least manageable, supply flows acted as a counterweight to any lingering geopolitical anxieties. Furthermore, the OPEC+ group’s supply decisions, while always a significant factor, have been somewhat overshadowed by broader macro concerns recently. While the cartel’s production cuts aim to support prices, their effectiveness is increasingly tested by global economic uncertainties and the potential for non-OPEC supply to fill any gaps. The delicate balance between managed supply and global demand expectations continues to be a defining characteristic of the oil market, and this week saw demand-side signals taking center stage.
The Influence of US Economic Signals on WTI
Perhaps the most significant driver influencing WTI’s trajectory this past week was the stream of US economic data, particularly employment figures. The latest Non-Farm Payrolls (NFP) report, a key indicator of labor market health and, by extension, economic activity, came in softer than anticipated. This data point is crucial because it directly impacts the Federal Reserve’s monetary policy calculus. A weaker jobs market suggests that the economy might be cooling, potentially reducing inflationary pressures and, critically, lowering the probability of further aggressive interest rate hikes. The market’s interpretation of this softer data was swift: a repricing of future Fed actions. Futures markets began to price in a reduced likelihood of additional rate increases, a development that typically supports commodities like oil by easing the pressure on industrial demand and potentially weakening the US Dollar.
The implications of this shift in Fed expectations are multifaceted for WTI. A less hawkish Fed can lead to a weaker US Dollar (DXY), as higher interest rates become less certain. A weaker dollar, in turn, often makes dollar-denominated commodities, like oil, cheaper for holders of other currencies, thereby potentially stimulating demand. The DXY itself showed some weakness towards the end of the week, trading around 100.82, reflecting this recalibration of interest rate expectations. For WTI, this correlation means that any further signs of economic cooling or a dovish pivot from the Fed could provide a tailwind. Conversely, if inflation proves more persistent than the jobs data suggests, or if the Fed signals a continued commitment to higher rates, the pressure on WTI could intensify. This week’s data underscores the sensitivity of oil prices to US monetary policy signals, a relationship that remains a primary focus for market participants.
Beyond the NFP report, other economic indicators also contributed to the narrative. Slower growth readings, reflected in some PMI data, further supported the notion of a moderating global economy. While some regions might show resilience, the overarching trend indicated by key economic releases points towards a deceleration. This slower growth trajectory directly impacts the demand side for energy. Industrial activity, transportation, and manufacturing are all sensitive to economic expansion. Therefore, a global economic slowdown, even a mild one, translates into reduced oil consumption. This fundamental demand-side weakness is a significant bearish factor for WTI, counteracting any temporary support from supply-side anxieties or geopolitical flare-ups. The market is essentially grappling with the prospect of slower demand growth at a time when supply remains relatively stable or even increasing from non-OPEC sources.
Technical Landscape: Indicators Pointing to Bearish Momentum
Turning to the technical indicators, the 1-day chart for WTI paints a picture of a market under bearish pressure, albeit with oversold conditions emerging. The current price of $69.02 sits below key moving averages, and several indicators suggest that downside momentum is dominant, though the extent of the trend's strength is nuanced across different timeframes. On the daily chart, the ADX stands at 38.84, indicating a strong downtrend. This is a significant reading, suggesting that the current downward movement has conviction behind it. Coupled with an RSI(14) at 28.27, which is firmly in oversold territory, we see a classic divergence: a strong trend moving towards exhaustion. This doesn't immediately signal a buy, but it does suggest that the aggressive selling pressure might be nearing a point where a consolidation or a bounce could occur, provided the trend doesn't accelerate further.
The MACD on the daily timeframe is also showing negative momentum, with the MACD line below its signal line. This reinforces the bearish sentiment. However, the Bollinger Bands on the daily chart show the price trading below the middle band, indicating a bearish bias in the short to medium term. The Stochastic Oscillator on the daily chart, with K at 11.96 and D at 12.65, is deeply oversold and showing a potential upward cross, hinting at a possible reversal or at least a temporary pause in the selling. This conflict between the strong ADX and oversold RSI/Stochastic is typical of mature trends, where the trend remains strong but the immediate selling exhaustion is visible.
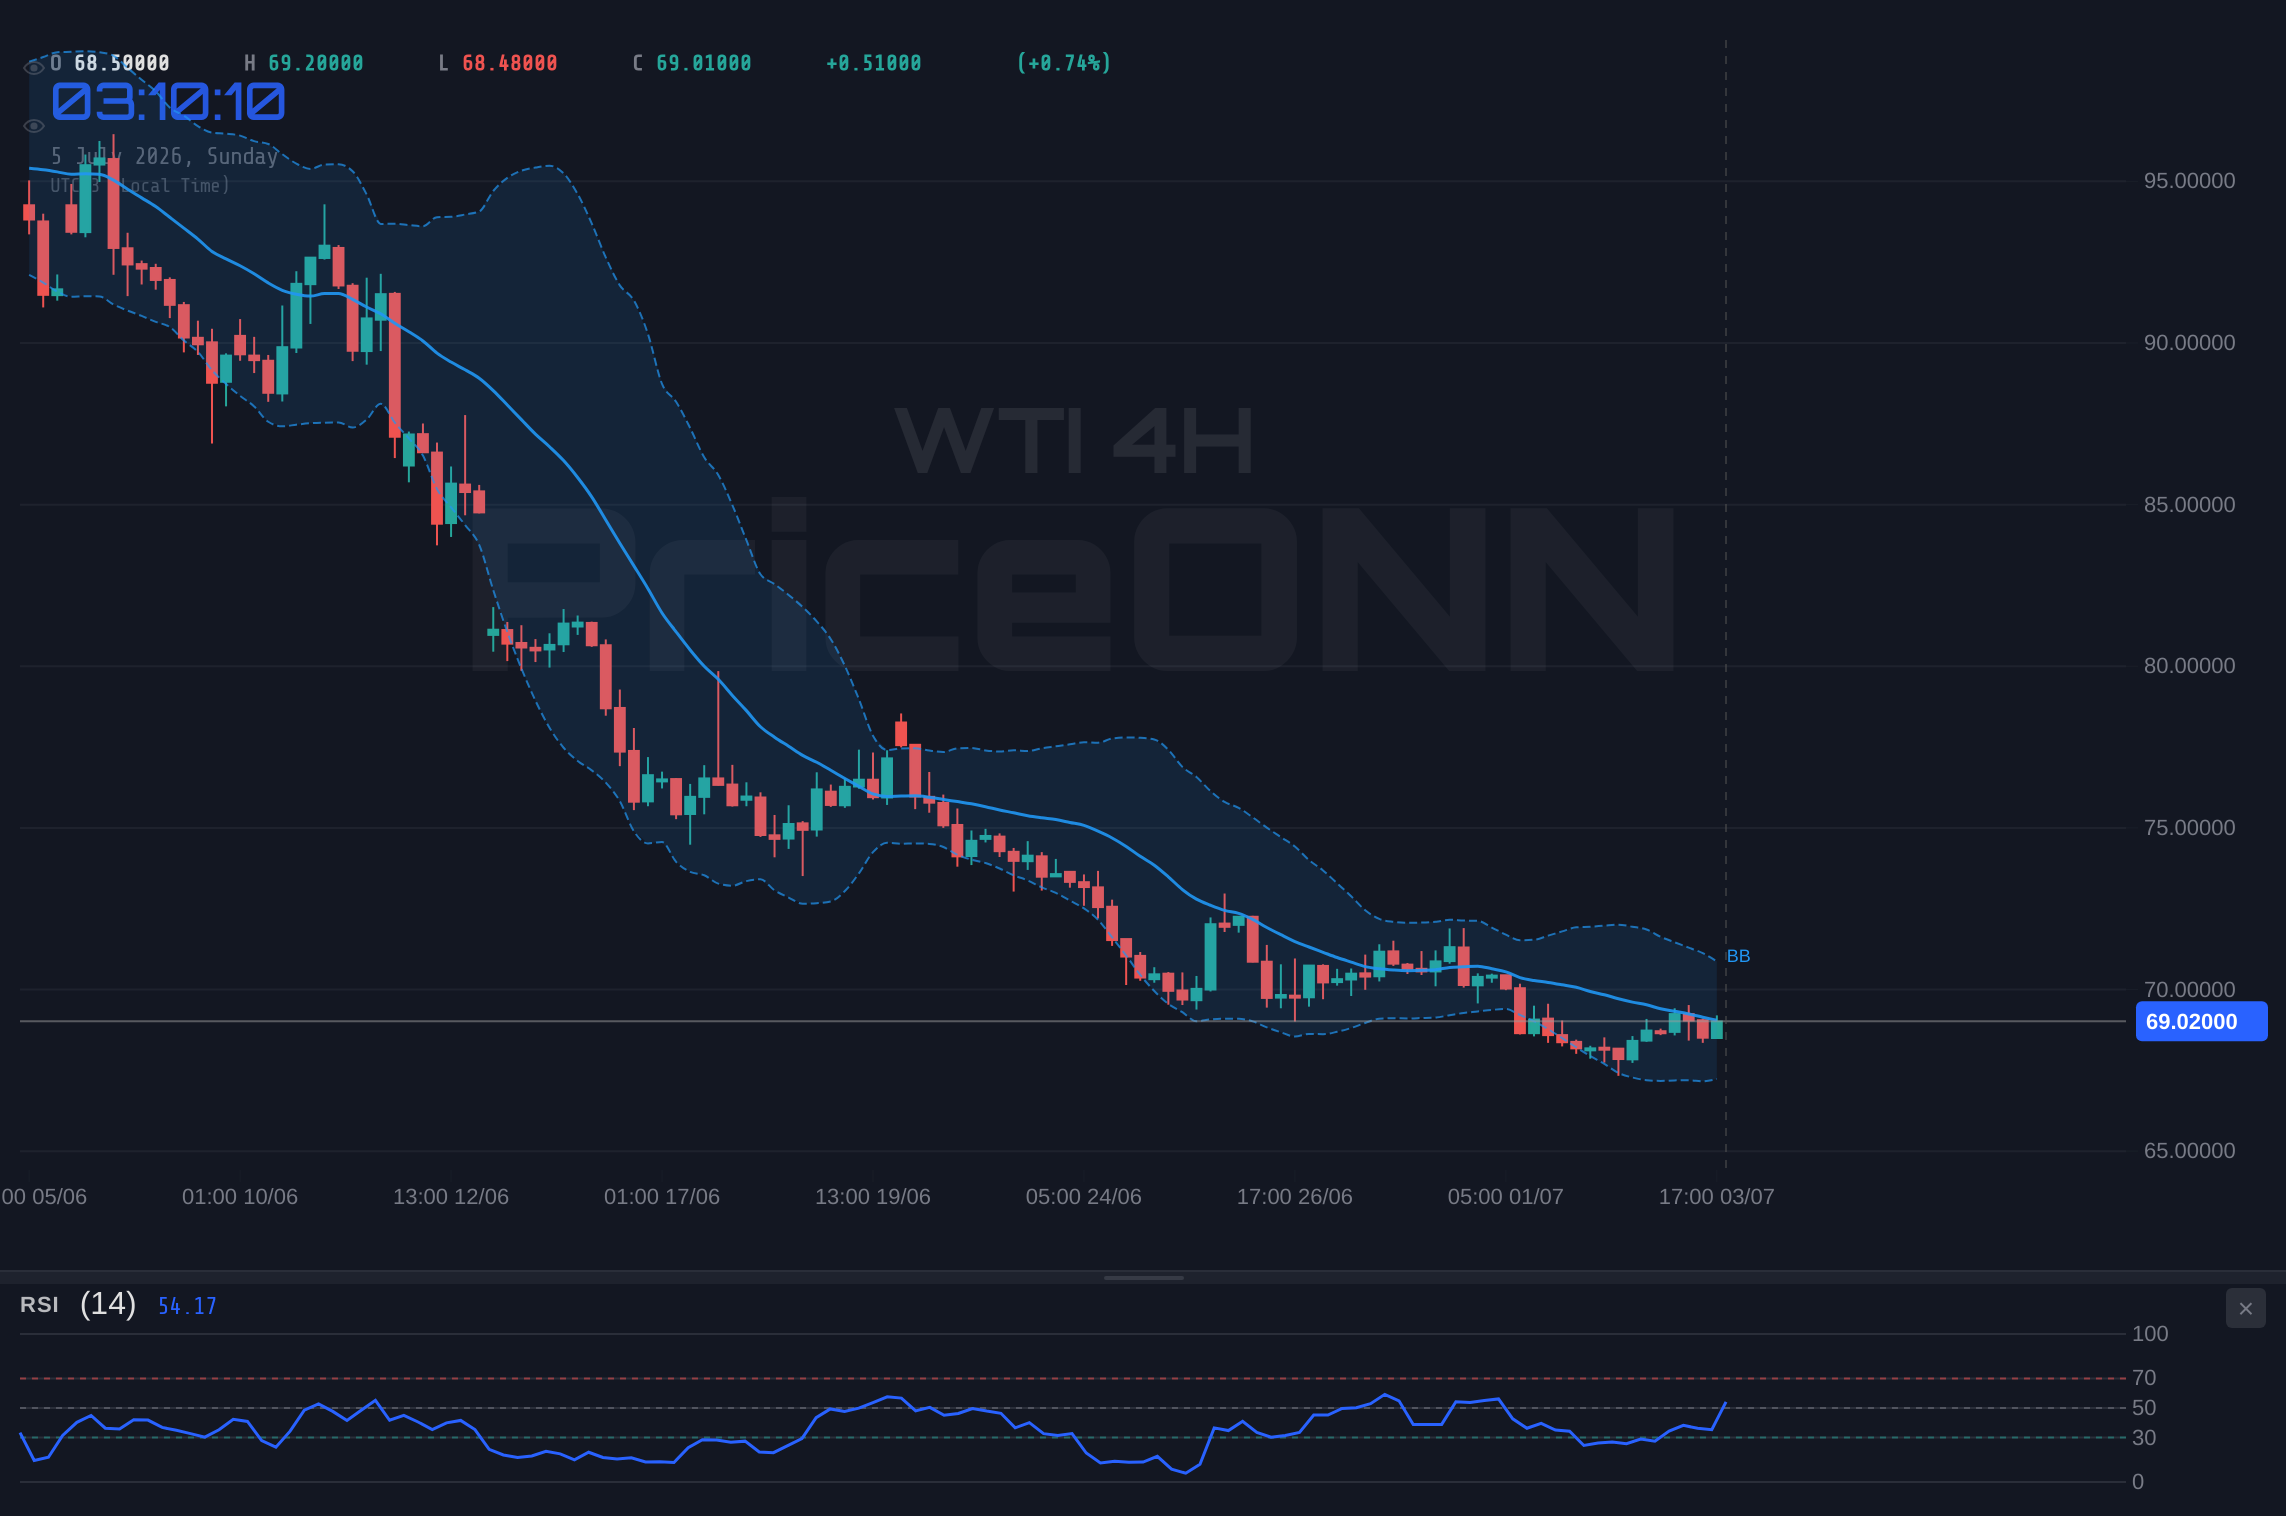
Examining the shorter timeframes, the 1-hour chart presents a slightly different picture, though the overall bias remains cautious. The ADX here is lower at 17.2, indicating a weaker trend, and the RSI is at 54.35, suggesting neutral momentum with a slight upward bias. The MACD shows negative momentum, but the Stochastic is in overbought territory (K=65.94, D=42.26), suggesting potential short-term selling pressure. This mixed signal on the 1-hour chart implies that while the broader trend is down, intraday trading might see some fluctuations or attempts at a bounce. The 4-hour chart, however, leans bearish, with an ADX of 30.36 pointing to a strong downtrend, an RSI of 45.79 in neutral-to-downward territory, and MACD showing positive momentum but price below the middle Bollinger Band. This suggests that any short-term upward moves might be met with resistance.
The overall technical picture, particularly on the daily timeframe, leans towards the continuation of the bearish trend, but with clear signs of oversold conditions that warrant caution. The strong ADX suggests the trend has power, but the RSI and Stochastic are screaming for a breather. This is the kind of environment where aggressive short-sellers might pause, waiting for confirmation of further downside, while opportunistic buyers might look for a deeper pullback or a clear reversal signal. The current price of $69.02 is a critical juncture; a break below key support levels could accelerate the downtrend, while a sustained hold and bounce might signal the beginning of a corrective phase.
Key Levels and Price Action to Watch
The technical structure for WTI highlights several critical price levels that will dictate the market’s direction in the coming days. On the daily chart, the immediate support level to monitor is $67.68. This is the first line of defense against further downside. A decisive break below this level, especially on increased volume, would likely trigger stop-loss orders and accelerate the move towards the next significant support at $66.62. Below that, $65.92 represents a more substantial floor, a level that, if breached, would signal a significant bearish continuation and potentially open the door to much lower prices, possibly revisiting levels seen earlier in the year.
On the resistance side, the current price of $69.02 is itself a point of contention. The immediate resistance is found at $69.44, followed by $70.14. These levels represent areas where selling pressure has emerged in the past, and overcoming them will require significant buying conviction. A break above $70.14 would be the first indication that the bearish trend might be faltering. However, the more robust resistance cluster lies between $71.93 and $72.25. This zone has acted as a ceiling multiple times and represents a significant hurdle for any potential bullish recovery. A sustained move above the $72.25 mark would be necessary to invalidate the current bearish thesis and suggest a potential trend reversal. Traders will be watching closely to see if WTI can muster the strength to challenge these upper bounds or if it succumbs to the prevailing downward pressure.
The Week Ahead: Macro Catalysts and Potential Volatility
Looking ahead to the upcoming trading week, several key macroeconomic events and ongoing geopolitical undercurrents will likely shape the direction of WTI. The Federal Reserve’s meeting minutes from the June FOMC meeting are scheduled for release early in the week. This document will be scrutinized for any further clues about the central bank’s stance on interest rates, inflation, and the economic outlook. Any hints of a more dovish tone could support oil prices by weakening the dollar, while a hawkish tilt would likely add to bearish pressure. Investors will be particularly sensitive to language regarding inflation persistence and the future path of monetary policy. This release has the potential to be a significant catalyst, either confirming the current bearish sentiment or providing a basis for a short-term bounce.
Beyond Fed commentary, upcoming inflation data, such as CPI figures, will also be critical. Persistent inflation could force the Fed’s hand, leading to higher-for-longer interest rates, which would be a bearish signal for oil demand. Conversely, signs of inflation moderating would reinforce the narrative of a cooling economy and potentially support oil prices through a weaker dollar and reduced rate hike expectations. Geopolitically, while immediate tensions in the Strait of Hormuz may have eased, the situation remains fluid. Any resurgence of conflict or new supply disruptions in the Middle East would quickly inject volatility back into the market and could provide a significant lift to WTI prices. The market will also be monitoring OPEC+ production decisions and compliance closely, although their immediate impact might be muted by broader macroeconomic concerns.
From a technical perspective, the oversold conditions on the daily chart suggest that WTI is vulnerable to a short-term bounce. However, the strong bearish trend indicated by the daily ADX (38.84) and the bearish signals on shorter timeframes suggest that any rallies might be capped. The key will be whether WTI can decisively break above the $70.14 resistance level. A failure to do so, especially in the face of negative economic data or renewed geopolitical concerns, could see prices drift back towards the $67.68 support. The interplay between these macro factors, geopolitical developments, and the technical picture will create a dynamic trading environment. Traders will need to remain vigilant, managing risk carefully as the market navigates these competing influences. The overall sentiment remains cautious, with the bearish trend appearing to hold, but the oversold technicals suggest that a period of consolidation or a technical bounce cannot be ruled out.
Bearish Scenario: Trend Continuation
65% ProbabilityNeutral Scenario: Consolidation Phase
25% ProbabilityBullish Scenario: Oversold Bounce
10% ProbabilityFrequently Asked Questions: WTI Analysis
What happens if WTI breaks below the $67.68 support level?
A decisive break below $67.68 on increased volume would likely trigger further selling, potentially accelerating the downtrend towards the $66.62 support level. This would invalidate the current consolidation pattern and signal a continuation of the bearish momentum.
Should I consider buying WTI at current levels near $69.02 given the oversold RSI at 28.27?
While the oversold RSI at 28.27 suggests potential for a bounce, the strong daily ADX of 38.84 indicates a powerful downtrend. Buying at current levels carries significant risk; a confirmation of a bullish reversal, such as a break above $70.14, would be needed to justify such a position.
Is the daily ADX reading of 38.84 a strong sell signal for WTI?
An ADX of 38.84 signifies a strong trend, in this case, a downtrend. While it confirms the conviction behind the current price movement, it doesn't necessarily act as a direct sell signal itself. It indicates that the market is trending strongly, and traders should look for confirmation from other indicators or price action before initiating short positions.
How will the upcoming Fed meeting minutes and inflation data affect WTI this week?
The Fed minutes and inflation data are crucial catalysts that could influence WTI. If they signal persistent inflation and a hawkish stance, expect bearish pressure on WTI due to potential rate hikes and a stronger dollar. Conversely, signs of cooling inflation could lead to a weaker dollar and support oil prices, potentially triggering a bounce from oversold levels.
The WTI crude oil market enters the new week with a bearish bias, largely influenced by softening economic data from the US and easing geopolitical tensions. While the daily chart shows strong downtrend momentum confirmed by an ADX of 38.84, the emergence of oversold conditions in indicators like RSI and Stochastic at 28.27 and 11.96 respectively, suggests that the selling pressure may be nearing exhaustion. This presents a complex picture for traders: the trend is down, but the potential for a technical bounce is significant. Key levels to watch will be the immediate support at $67.68 and resistance at $70.14. A break below support could extend the decline, while a sustained move above resistance might signal a shift in sentiment. For now, patience and disciplined risk management are paramount, as the market awaits clearer signals from upcoming economic data and potential geopolitical developments.
Track markets in real-time
AI-powered analysis, technical indicators and real-time price data.
Join Our Telegram Channel
Breaking market news, AI analysis and trading signals instantly.
Join Channel