

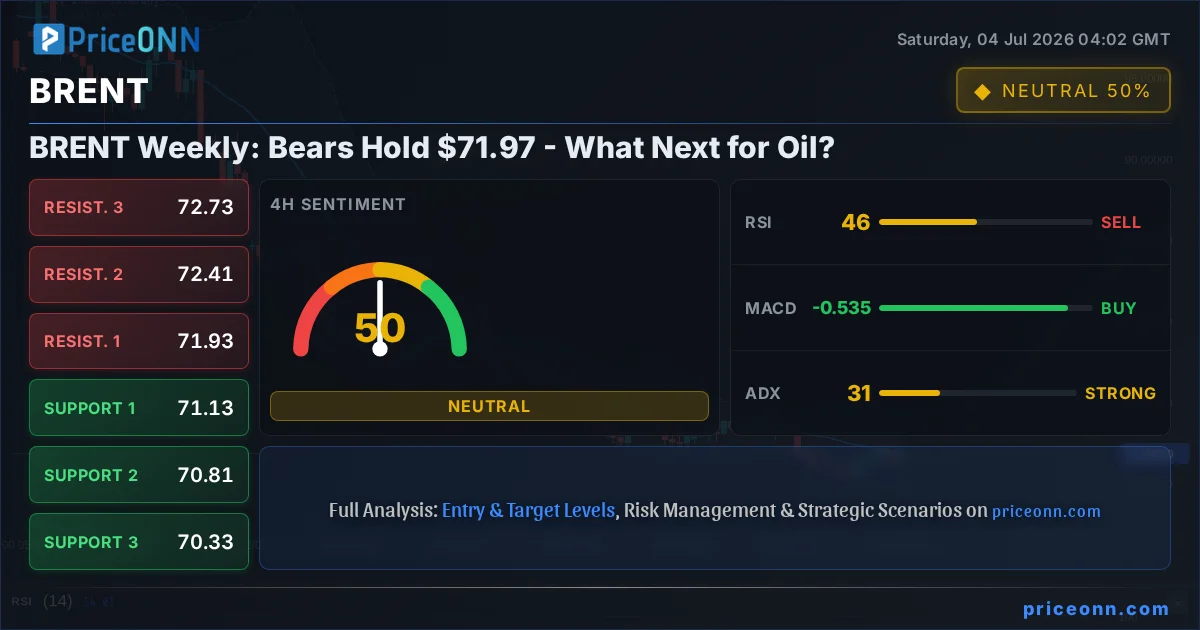
As the weekend draws to a close, the oil market finds itself at a critical juncture. Last Friday's close for BRENT settled at $71.97, a level that has proven to be a stubborn barrier for bullish momentum throughout the past week. This price point isn't just a number; it represents a confluence of technical resistance and a cautious market sentiment, leaving traders and analysts alike pondering the next significant move. The question on everyone's mind is whether the bears will maintain their grip at $71.97, or if underlying fundamental drivers will eventually force a breakout, reshaping the outlook for crude oil in the coming weeks.
- BRENT closed last week at $71.97, facing stiff resistance at this key level.
- The 4-hour chart shows a strong uptrend (ADX 30.71), but daily RSI at 27.06 suggests oversold conditions potentially offering a buying opportunity.
- DXY at 100.85 is showing mixed signals, with 1H indicating strength while 4H points to weakness, impacting BRENT's correlation.
- Geopolitical tensions in the Middle East and OPEC+ production decisions remain central to the oil market's fundamental outlook.
The past week for BRENT crude oil was a tale of two timeframes, showcasing the inherent complexities of market analysis. On the shorter 1-hour and 4-hour charts, the trend indicators painted a picture of strength. The 4-hour timeframe, in particular, exhibited a robust uptrend with an ADX reading of 30.71, suggesting that momentum was decidedly in favor of buyers. This was further supported by a general 'BUY' signal across these shorter timeframes, with multiple indicators aligning to suggest upward movement. However, this bullish technical picture was met with a significant counterpoint on the daily chart. The daily RSI reading of 27.06 screamed 'oversold,' indicating that BRENT had experienced a sharp decline and was potentially due for a bounce. This divergence between short-term bullish signals and long-term oversold conditions created a tug-of-war, ultimately leading to BRENT consolidating around the $71.97 mark – the closing price from last Friday.
This price level, $71.97, has become more than just a technical barrier; it's a psychological magnet and a critical battleground for market participants. For the bulls, breaking and holding above $71.97 would signal a potential reversal of the recent downtrend and open the door for further upside, targeting higher resistance levels like $72.18, $72.33, and ultimately $72.62. Conversely, for the bears, holding this level would confirm the prevailing weakness and allow them to push BRENT lower, aiming for support levels such as $71.74, $71.45, and potentially $71.30. The inability of either side to decisively claim control over the $71.97 level during the past week highlights the indecision and the balance of power currently at play in the oil markets. Understanding this dynamic is crucial for any trader looking to navigate the choppy waters of energy commodities.
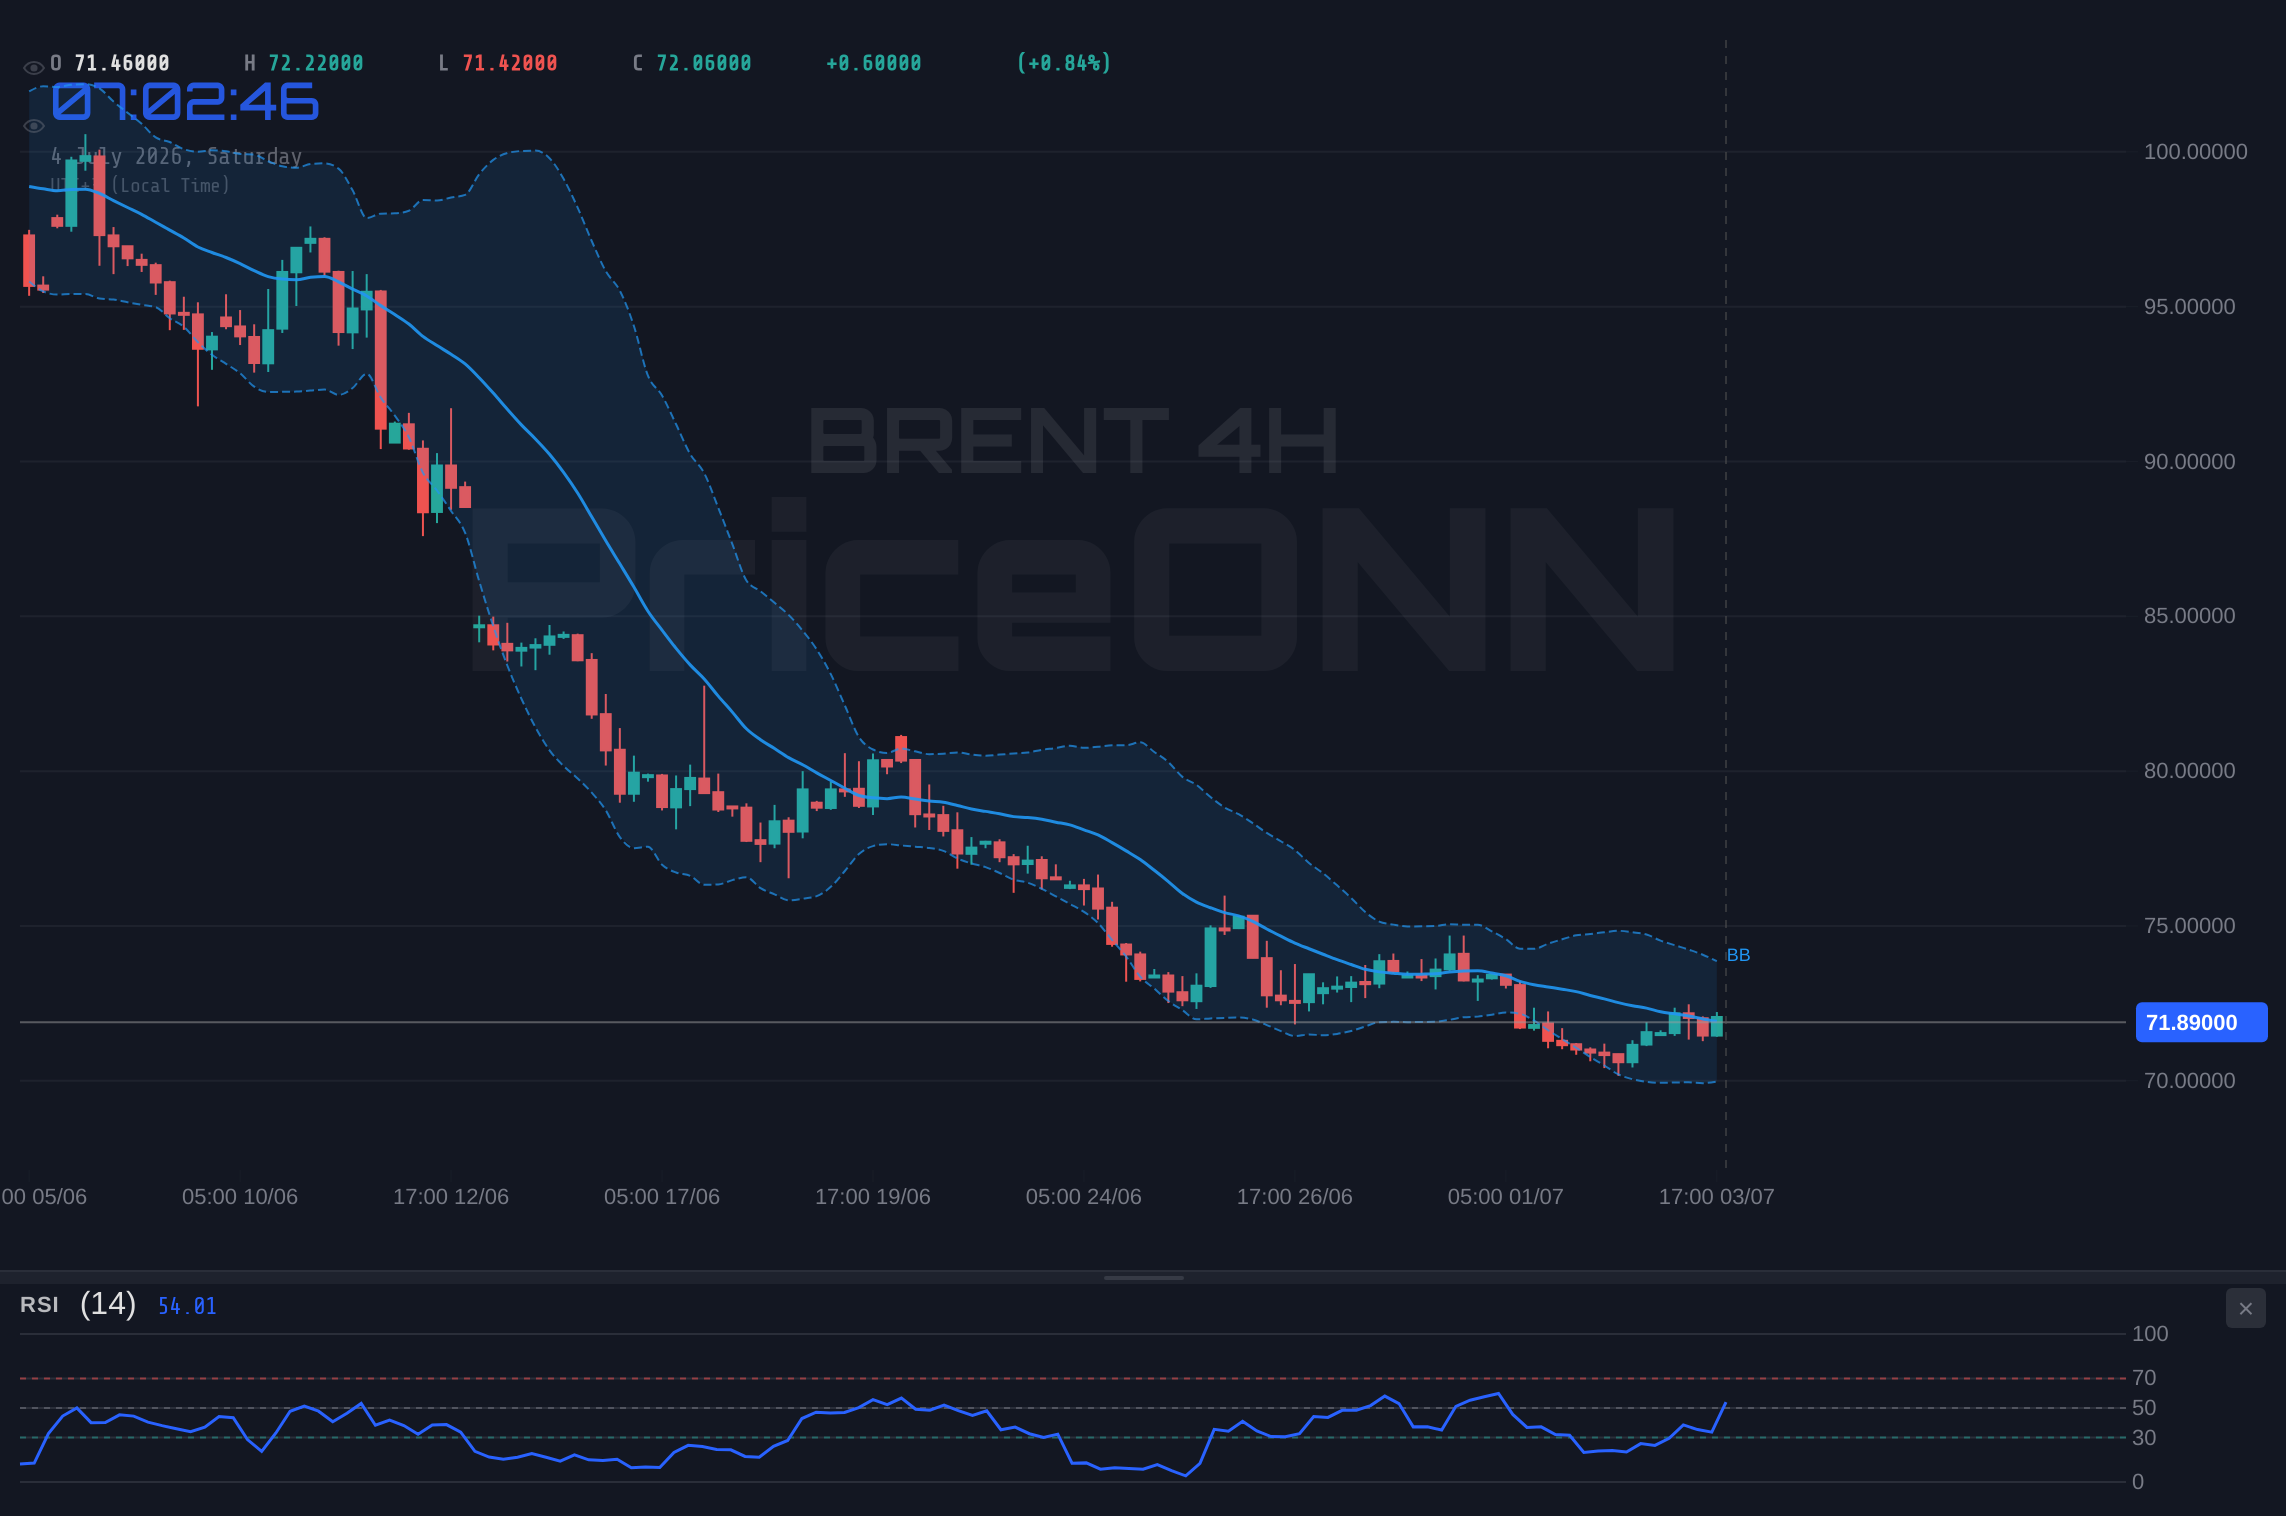
The broader macroeconomic backdrop also plays a pivotal role in shaping BRENT's trajectory. The US Dollar Index (DXY) presents a complex picture. While the 1-hour timeframe shows the DXY strengthening at 100.85, its 4-hour counterpart indicates weakness, trading below 100.71. This mixed signal from the dollar index, a key correlative asset for commodities priced in USD, adds another layer of uncertainty. Typically, a strengthening dollar exerts downward pressure on oil prices, as it becomes more expensive for holders of other currencies. However, the current divergence in DXY signals means this relationship is not providing a clear directional bias for BRENT at this moment. Investors are closely watching the DXY's next move, as a clear trend there could provide the catalyst needed to break the stalemate around $71.97 for BRENT.
Beyond the dollar's influence, geopolitical risks continue to be a significant underpinning for oil prices. Lingering tensions in the Middle East, a region critical for global oil supply, always carry the potential to disrupt production and send prices soaring. While there haven't been major escalations reported in the last 48 hours, the underlying instability remains a constant factor that traders price into the market. This inherent geopolitical risk premium is one reason why oil prices often find support even when other indicators might suggest weakness. The market remains acutely aware that any unexpected supply disruption could rapidly shift the narrative from consolidation to a sharp upward move, irrespective of the current technical readings. This 'black swan' potential always adds a floor to oil prices.
Furthermore, the decisions and pronouncements from OPEC+ continue to be a focal point for the energy markets. While no major policy shifts have occurred in the immediate past, the group's commitment to managing supply to support prices is a well-established fact. Any hint of increased production from OPEC+ members would undoubtedly put pressure on BRENT, while signals of continued or enhanced production cuts would bolster prices. Traders are constantly sifting through official statements and unofficial reports for clues about the cartel's future strategy. The market's sensitivity to OPEC+ actions means that this factor alone can override short-term technical signals, making it a crucial element in the fundamental analysis of BRENT. The recent PriceONN blog post titled 'Brent: Surplus Spooks the Bulls' and Morgan Stanley's cut of their BRENT forecast to $75 a barrel also underscore the underlying bearish sentiment that analysts are grappling with, despite the current price level.
Looking at the technical indicators in more detail, the ADX (Average Directional Index) provides a fascinating insight. On the 1-hour chart, the ADX is at 19.39, indicating a weak trend. This suggests that the market is not strongly committed to a particular direction, which aligns with the price action seen around $71.97. However, the 4-hour ADX jumps to 30.71, and the daily ADX is at 42.01, both indicating strong trends – the 4-hour showing a bullish trend and the daily a bearish one. This conflicting ADX behavior across different timeframes perfectly encapsulates the market's indecision. A strong ADX reading typically suggests a clear trend, but when these readings conflict, it implies that short-term momentum might be battling against longer-term structural forces. For traders, this means that relying solely on ADX for a directional bias is unreliable; confirmation from other indicators and price action is paramount.
The Relative Strength Index (RSI) also tells a story of divergence. On the 1-hour chart, the RSI is at 54.41, suggesting a neutral stance with a slight upward tendency. The 4-hour RSI is at 46.43, indicating a neutral-to-downward bias. However, the daily RSI at 27.06 is deeply oversold. This daily reading is particularly significant. Historically, RSI values below 30 often precede a price reversal or a significant bounce. While it doesn't guarantee a buy signal, it does suggest that the selling pressure might be exhausting itself. Traders often look for confirmation, such as bullish divergence on the price chart (higher lows on price with lower lows on RSI) or a break of a short-term downtrend, before acting on an oversold RSI. The current situation highlights a potential opportunity for buyers if the price can hold key support levels and show signs of stabilization.
Stochastic Oscillator readings add another layer to this complex picture. On the 1-hour chart, the Stochastic (%K=67.41, %D=46.78) shows a bullish signal with %K crossing above %D, suggesting upward momentum. The 4-hour chart shows a similar bullish signal (%K=71.79, %D=65.5). However, the daily Stochastic readings (%K=12.57, %D=12.55) are deeply oversold and hovering near the same level, indicating extreme selling pressure that could be nearing its exhaustion point. This confluence of oversold conditions on the daily timeframe for both RSI and Stochastic, coupled with bullish signals on shorter timeframes, is a classic setup that traders watch closely for potential trend changes. The key will be whether the shorter-term bullish signals can overcome the longer-term bearish sentiment and resistance at $71.97.
Bollinger Bands offer further insight. On the 1-hour and 4-hour charts, BRENT is trading above the middle band, indicating a bullish bias in the short to medium term. However, the daily Bollinger Bands show price trading below the middle band, reinforcing the notion of a prevailing downtrend on the longer timeframe. The middle band of the daily Bollinger Bands currently sits around $71.13, which could act as a near-term resistance if the price attempts to move higher. Conversely, if the price breaks below the lower band on the daily chart, currently near $68.79, it would signal significant selling pressure. The fact that price is currently hovering above the middle band on shorter timeframes but below it on the daily chart reinforces the consolidation theme around $71.97.
Considering the interplay of these factors, the market sentiment appears cautious, leaning slightly bearish on the longer term due to the daily chart's technicals, yet showing pockets of bullishness on shorter timeframes, likely driven by the oversold conditions and lingering geopolitical risks. The recent PriceONN market news, such as 'Brent Crude Oil Analysis: Stabilisation or Simply a Pause?', directly addresses this uncertainty. Traders are weighing the possibility of a short-term bounce against the risk of a broader downtrend resuming. This is why the $71.97 level remains so critical. A decisive move above it could trigger a cascade of buy orders, while a failure to do so might lead to a retest of lower support levels. The market is essentially waiting for a clearer signal, either from a fundamental catalyst or a decisive technical breakout.
The economic calendar for the upcoming week holds several key events that could influence BRENT prices. While specific data releases were not provided in the context, general knowledge of market-moving events is crucial. Key among these would be any significant inflation data (CPI, PCE), employment figures (NFP, unemployment rate), or central bank policy statements (Fed, ECB). For instance, softer US jobs data, as hinted at in recent news affecting WTI Crude Oil, can sometimes weigh on the dollar and support oil prices by reducing the likelihood of further aggressive interest rate hikes. Conversely, stronger-than-expected inflation could trigger fears of tighter monetary policy, strengthening the dollar and pressuring BRENT. Investors will be keenly watching these macroeconomic indicators for any signs that could shift the global economic outlook and, consequently, the demand for oil.
From a trading perspective, the current setup around $71.97 presents a classic risk/reward scenario. The strong uptrend signals on the 4-hour chart, combined with the deeply oversold daily indicators, suggest that a bullish trade setup might be forming. However, the stubborn resistance at $71.97 and the prevailing bearish sentiment on the daily chart cannot be ignored. This calls for a disciplined approach. Traders might look for confirmation of a bullish move, such as a decisive close above $71.97 on the daily chart, or a clear bounce off the 4-hour support levels. Alternatively, a breakdown below key support could signal a more significant move lower. The decision to enter a trade will heavily depend on risk management strategies and the trader's specific time horizon and risk tolerance.
The interplay between risk sentiment and oil prices is also noteworthy. With the S&P 500 showing a strong daily uptrend (ADX 49.72) but a bearish signal on the 1D chart, and Nasdaq 100 also exhibiting mixed signals, risk appetite in the broader markets is somewhat uncertain. Generally, a 'risk-off' environment, characterized by falling equity markets and increased demand for safe-haven assets like the US Dollar, tends to put downward pressure on commodities like oil. Conversely, a 'risk-on' sentiment often correlates with higher oil prices. The current mixed signals from major indices suggest that this correlation might not be providing a clear directional cue for BRENT at this moment, further contributing to the consolidation around $71.97.
Bearish Scenario: Bears Defend $71.97
60% ProbabilityNeutral Scenario: Consolidation Continues
25% ProbabilityBullish Scenario: Reversal from Oversold Levels
15% ProbabilityFrequently Asked Questions: BRENT Analysis
What happens if BRENT breaks below the $71.45 support level?
If BRENT closes below the $71.45 support, it would invalidate the short-term bullish signals and likely trigger a move towards the next support at $71.30. This would confirm the bearish scenario, especially if the daily RSI remains oversold, suggesting further downside potential.
Should I consider buying BRENT at current levels around $71.97 given the daily oversold RSI of 27.06?
Buying solely based on an oversold RSI at $71.97 carries risk due to the strong daily downtrend (ADX 42.01) and persistent resistance. A more prudent approach would be to wait for confirmation, such as a daily close above $71.97 or a clear bounce from 4H support levels, aligning with the bullish scenario with a 15% probability.
Is the RSI at 27.06 a definitive buy signal for BRENT?
An RSI reading of 27.06 on the daily chart is a strong indicator of oversold conditions, often preceding a price reversal. However, it is not a standalone buy signal. The prevailing bearish trend on the daily (ADX 42.01) and the critical resistance at $71.97 mean that confirmation from price action or other indicators is essential before considering a long position.
How will upcoming economic data and geopolitical events affect BRENT's price around $71.97?
Upcoming data, particularly inflation and employment figures, alongside geopolitical developments in the Middle East, could be catalysts for a breakout or breakdown. Stronger-than-expected economic data might weaken the dollar and support BRENT, while geopolitical escalations could provide a direct boost. Conversely, signs of economic cooling or de-escalation could pressure prices, reinforcing the bearish outlook.
The week closed with BRENT hovering precariously around $71.97, a level that encapsulates the ongoing battle between short-term oversold conditions and longer-term bearish trends. The conflicting signals from various timeframes and indicators underscore the indecision in the market. While the daily oversold RSI and Stochastic suggest a potential for a bounce, the stubborn resistance at $71.97 and the strong daily downtrend (ADX 42.01) present significant hurdles for the bulls. The coming week will be critical, with traders closely watching for a decisive move above $71.97 or a breakdown below key support levels. Geopolitical developments and macroeconomic data releases will likely be the deciding factors, potentially providing the catalyst needed to break this stalemate and set a clear direction for BRENT.
Track markets in real-time
AI-powered analysis, technical indicators and real-time price data.
Join Our Telegram Channel
Breaking market news, AI analysis and trading signals instantly.
Join Channel