

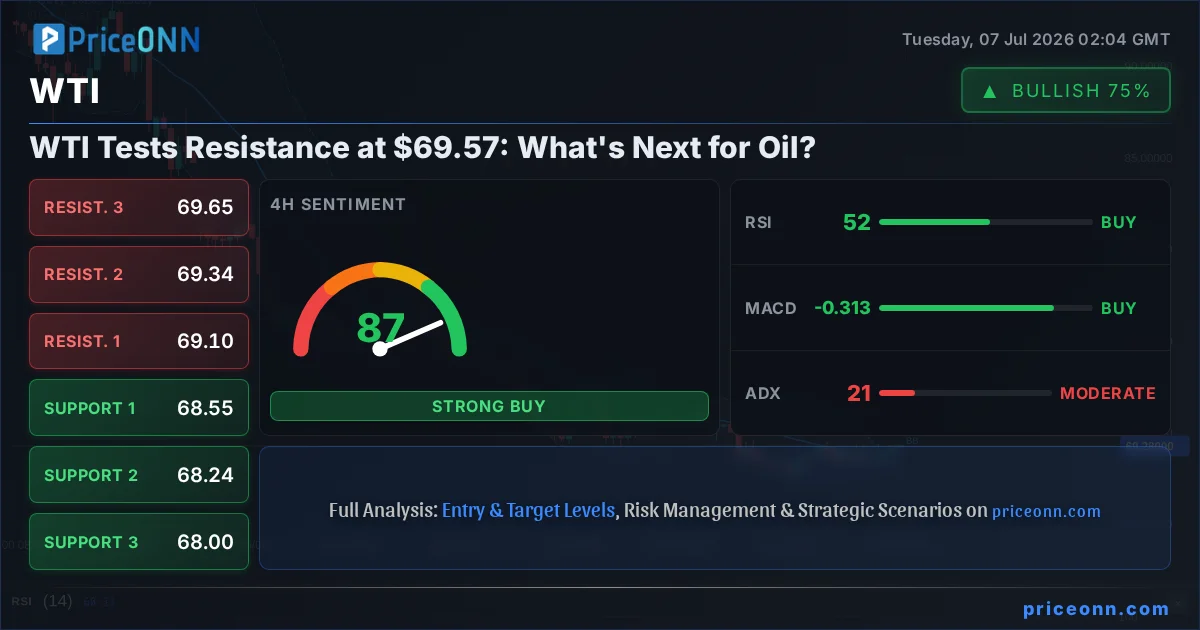
WTI crude oil is currently trading at $69.32, hovering near a critical resistance level at $69.57. This juncture presents a fascinating tug-of-war between bullish momentum and lingering oversupply concerns, making it a pivotal moment for traders and analysts alike. The market sentiment is finely balanced, with the daily signals offering a mixed picture that demands a closer look at the underlying drivers and potential scenarios. Understanding the interplay between macroeconomic factors, geopolitical risks, and the technical setup is crucial for navigating the path ahead.
- WTI crude oil is currently testing resistance at $69.57, with the price at $69.32 indicating a tight range.
- The RSI(14) is at 58.96 on the 1H chart, suggesting upward momentum, while the 1D RSI at 29.16 points to oversold conditions potentially offering a buying opportunity.
- ADX readings are mixed across timeframes (9.18 on 1H, 20.57 on 4H, 39.94 on 1D), signaling weak to strong trend strength depending on the chart, highlighting market indecision.
- Key levels to watch are support at $68.99 and resistance at $69.19 on the 1H chart, with broader levels at $68.40 support and $69.57 resistance on the daily.
- The correlation with the DXY (currently 100.82) is a key factor, with dollar strength typically pressuring oil prices.
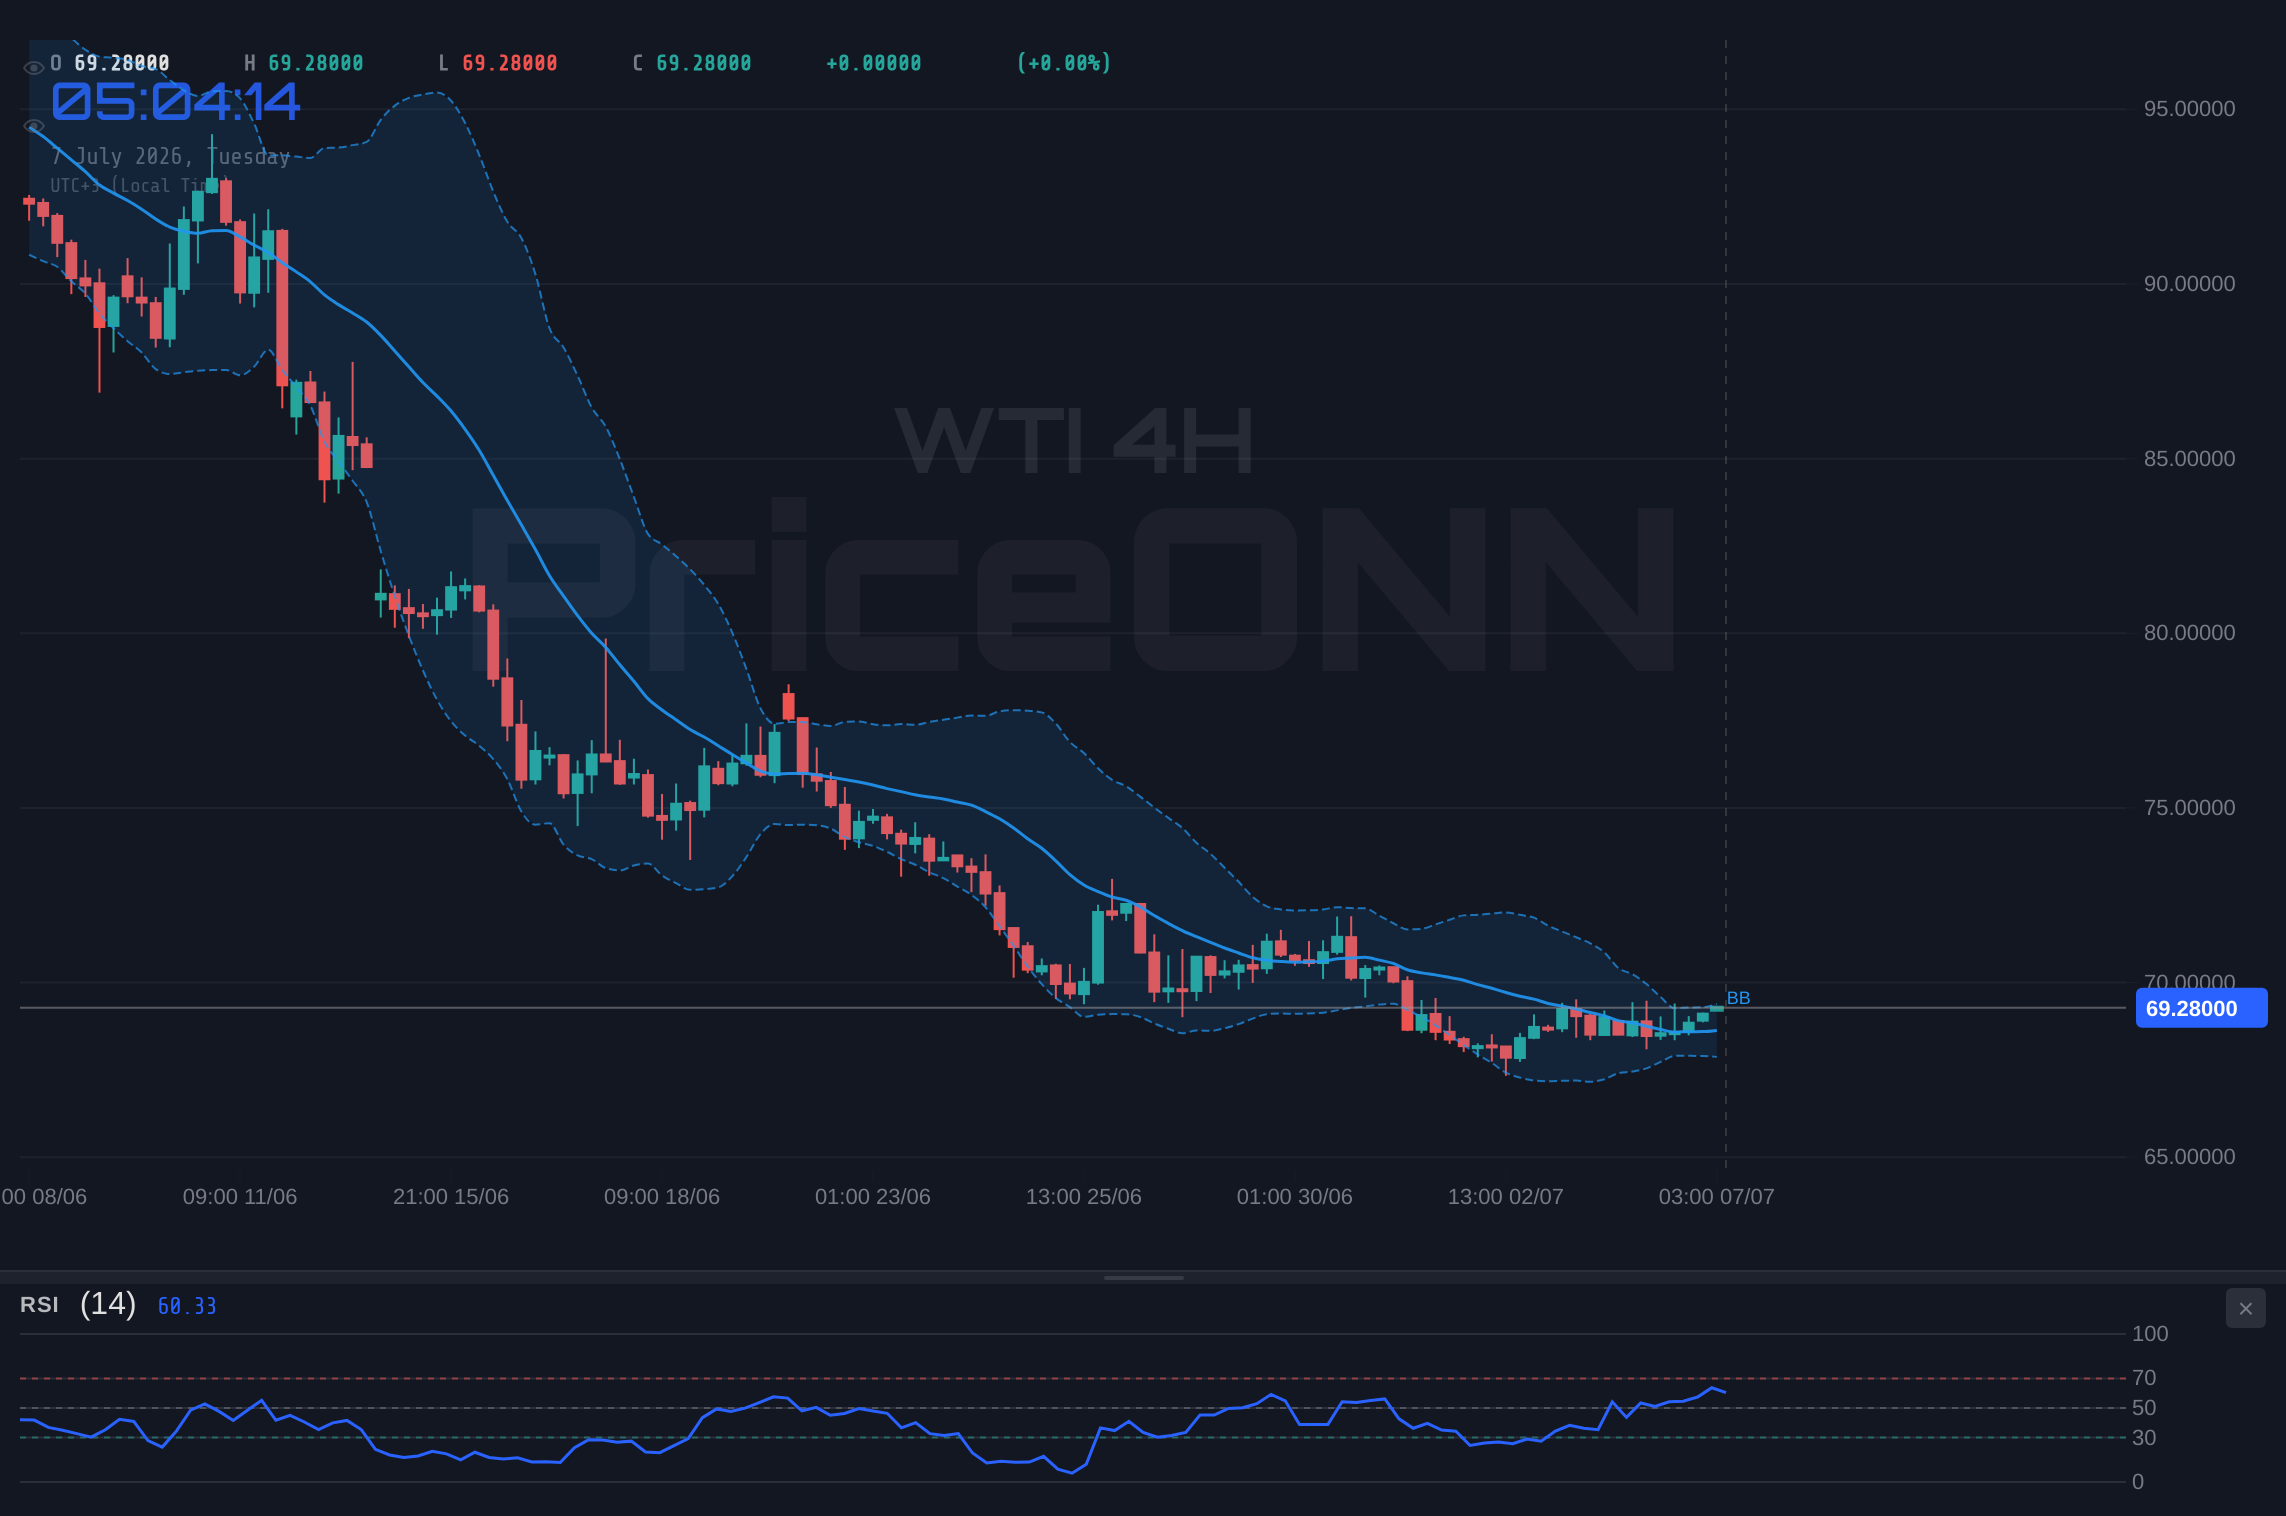
The recent price action for West Texas Intermediate (WTI) crude oil, currently sitting at $69.32, illustrates a market caught between competing forces. On the 1-hour chart, the trend is cautiously neutral with a power of 50%, but the ADX at a mere 9.18 suggests a lack of strong directional conviction. However, a glance at the 1-day chart paints a different picture: the trend is technically bearish with 100% power, yet the RSI(14) at 29.16 screams oversold, hinting at a potential bounce. This divergence across timeframes is precisely where detailed analysis becomes paramount. We need to dissect the fundamental drivers and macroeconomic correlations to understand if this is a pause before a larger move or simply noise within a broader trend.
The daily chart's RSI of 29.16 is particularly noteworthy. Readings below 30 typically signal an asset is oversold, suggesting that selling pressure might be exhausted and a reversal could be imminent. This technical signal, while not a buy signal in isolation, indicates that the recent downward move might be losing steam. However, the ADX on the daily chart stands at 39.94, a strong reading that denotes a powerful downtrend. This creates a clear conflict: oversold conditions battling a strong downward trend. For WTI, this conflict means that while a short-term bounce is possible, a sustained rally would require a significant shift in fundamentals or a clear break of key resistance levels. The 1-hour chart's weak ADX of 9.18 further complicates the picture, suggesting that any immediate upward momentum might lack the strength for a decisive breakout.
The correlation between WTI and the US Dollar Index (DXY) remains a critical factor to monitor. With the DXY currently at 100.82, any significant movement in the dollar can have a pronounced effect on oil prices. Generally, a stronger dollar makes oil more expensive for holders of other currencies, thus dampening demand and pressuring prices lower. Conversely, a weaker dollar can stimulate demand and push oil prices higher. The DXY's own technical picture is also mixed, with 1-hour and 4-hour charts showing a bearish trend, while the daily chart indicates a potential bullish trend. This dollar indecision mirrors the oil market's own ambiguity, reinforcing the idea that a clear catalyst is needed to break the current stalemate.
Looking at the broader economic landscape, the recent US employment data has been a key focus. A cooling labor market, as suggested by recent reports, could influence central bank policy, potentially leading to interest rate cuts sooner rather than later. Such a scenario might typically boost risk appetite and commodity prices, including oil. However, inflation concerns remain a persistent shadow. If inflation proves to be stickier than anticipated, central banks might be forced to maintain higher interest rates for longer, which would likely dampen economic growth and weigh on oil demand. The upcoming economic calendar, particularly any data related to inflation or manufacturing activity, will be crucial in shaping market expectations.
Geopolitical tensions, particularly in regions critical for oil supply, also play a significant role. While the provided market data doesn't include specific geopolitical news, it's a constant background factor for energy markets. Any escalation of conflicts or disruptions in major oil-producing regions can quickly send prices soaring due to supply disruption fears. Conversely, signs of de-escalation or increased diplomatic efforts can ease such anxieties and contribute to price moderation. Traders are constantly weighing the risk premium associated with these geopolitical uncertainties, which can override purely technical or fundamental signals in the short term.
The technical indicators on the 4-hour chart offer another layer of complexity. Here, the trend is neutral with 50% power, but the ADX at 20.57 suggests a moderately strong trend is trying to establish itself. The RSI(14) is at 51.62, hovering around the midpoint, indicating a lack of clear directional bias. The Stochastic oscillator shows %K (58.63) above %D (47.28), which is a bullish signal, while the MACD is positive, suggesting upward momentum. This 4-hour picture is slightly more constructive for bulls than the daily chart, but it's still far from a decisive confirmation of an upward move, especially given the weak ADX on the 1-hour chart.
The 1-hour chart presents immediate resistance at $69.19 and support at $68.99. A decisive break above $69.19, especially on increasing volume, could signal an attempt to challenge the $69.57 resistance level. Conversely, a close below $68.99 could see prices drift lower towards the $68.79 support. The ADX at 9.18 on this timeframe is a major red flag for any short-term bullish thesis; it indicates that any move higher might lack follow-through. This suggests that while a short-term bounce is possible, sustaining upward momentum will be challenging without stronger underlying demand or a significant shift in market sentiment.
Considering the conflicting signals across different timeframes and the mixed macroeconomic outlook, a multi-scenario approach is the most prudent way to analyze WTI. The market is currently at a crossroads, and the next few trading sessions will be crucial in determining the direction. The interplay between the oversold conditions on the daily chart, the immediate resistance levels, and the overarching trend strength indicated by the ADX will dictate the short-to-medium term price action. A clear break of key levels, coupled with confirmation from macroeconomic data or geopolitical developments, will be necessary to establish a more defined trend.
The strength of the downtrend on the daily chart (ADX 39.94) cannot be ignored. This indicates that despite the oversold RSI reading, the path of least resistance has been downward. For any bullish scenario to gain traction, price needs to not only break immediate resistance but also sustain itself above these levels, ideally clearing the more significant daily resistance at $69.57 and then potentially the $70.13 level. Without such a decisive move, the risk of the downtrend reasserting itself remains elevated, potentially leading to further downside.
The market is awaiting clearer signals. The Federal Reserve's monetary policy stance, inflation data releases, and any significant geopolitical developments will likely act as catalysts. The current price of $69.32 for WTI represents a critical test. Whether it holds as a point of resistance, leading to further consolidation or decline, or breaks through to signal a more sustained recovery, will depend on these upcoming factors. Traders should maintain a disciplined approach, focusing on price action at key levels and managing risk accordingly.
Frequently Asked Questions: WTI Analysis
What happens if WTI breaks above the $69.57 resistance level?
A decisive break above $69.57 on the daily chart, especially with strong volume and positive macroeconomic cues, could signal a shift towards a bullish trend. This would likely target higher resistance levels such as $70.13, and potentially extend towards $70.74. Confirmation would require sustained trading above $69.57 and a weakening DXY.
Should I consider buying WTI at current levels near $69.32 given the oversold RSI on the daily chart?
While the daily RSI at 29.16 suggests oversold conditions, the strong daily ADX of 39.94 indicates a persistent downtrend. A buy decision at current levels near $69.32 would be speculative and carry significant risk. It would be prudent to wait for confirmation, such as a clear break above $69.19 resistance or a sustained move above $69.57, before considering long positions.
Is the ADX reading of 39.94 on the daily chart a sell signal for WTI?
An ADX value of 39.94 signifies a strong trend, and given it's on the daily chart for WTI, it indicates a robust downward trend is in place. While not a direct sell signal, it confirms that the market has strong directional momentum. This makes it riskier to bet against the trend, suggesting that any rallies might be short-lived unless significant fundamental shifts occur.
How might upcoming inflation data impact WTI prices this week?
Higher-than-expected inflation data could pressure central banks to maintain hawkish monetary policies, potentially dampening economic growth and oil demand, which would be bearish for WTI. Conversely, softer inflation could lead to expectations of rate cuts, boosting risk appetite and potentially supporting oil prices near current levels. Traders will be closely watching these releases for direction.
Bullish Scenario: The Recovery Play
25% ProbabilityNeutral Scenario: Consolidation Range
60% ProbabilityBearish Scenario: Downtrend Resumes
15% Probability| Indicator | Value | Signal | Interpretation |
|---|---|---|---|
| RSI (14) | 58.96 | Neutral | Suggests upward momentum on 1H, but daily is oversold (29.16) |
| MACD | Positive | Bullish | Momentum appears positive on most timeframes, but watch for divergence |
| Stochastic | K=76.18, D=57.91 | Bullish | Bullish crossover on 1H, but daily Stochastic is rising from oversold |
| ADX | 9.18 (1H) | Weak Trend | 1H shows very weak trend strength, suggesting lack of conviction for immediate breakout |
| ADX | 20.57 (4H) | Moderate Trend | 4H indicates a developing trend, but not yet strong |
| ADX | 39.94 (1D) | Strong Trend | Daily chart shows a strong downtrend is in place |
What I'm Watching This Week:
The immediate focus for WTI remains on the $69.57 resistance level. A clear break above this point, supported by positive macroeconomic news or a weakening dollar, would be a significant bullish signal. Conversely, failure to break this resistance and a subsequent drop below the $68.79 support level would likely confirm the continuation of the daily downtrend. The market sentiment, influenced by inflation data and central bank commentary, will be key. Traders should also keep an eye on the DXY's reaction to any major economic releases, as its movement will likely correlate with WTI's direction.
Track markets in real-time
AI-powered analysis, technical indicators and real-time price data.
Join Our Telegram Channel
Breaking market news, AI analysis and trading signals instantly.
Join Channel