

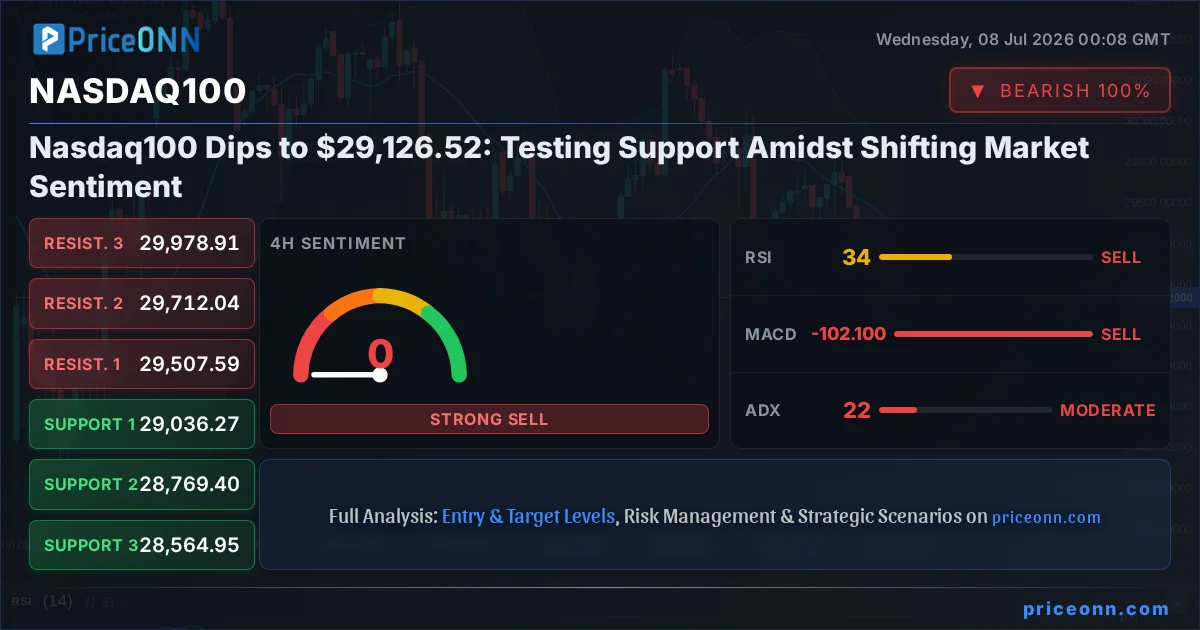
The Nasdaq100 index has experienced a notable dip, currently trading at $29,126.52. This move brings critical support levels into focus, particularly around the $29,073.83 mark. As traders digest recent market shifts and anticipate upcoming economic data, understanding the potential trajectories for the tech-heavy index becomes paramount. This analysis delves into the fundamental drivers, technical indicators, and macroeconomic correlations shaping the Nasdaq100's immediate future, exploring various scenarios from a potential bounce to further downside pressure.
- The Nasdaq100 is currently trading at $29,126.52, showing a significant daily decline.
- Key support is being tested near $29,073.83, with R1 resistance noted at $29,887.73.
- RSI at 46.06 suggests a neutral-to-bearish lean, while ADX at 16.03 indicates a weak trend.
- Correlation with DXY, currently at 101.17, suggests dollar strength could continue to pressure the index.
The Shifting Sands: What's Driving the Nasdaq100 Lower?
Fundamental Underpinnings and Macroeconomic Crosscurrents
The recent downturn in the Nasdaq100, currently priced at $29,126.52, is not occurring in a vacuum. It reflects a complex interplay of macroeconomic factors and evolving market sentiment. While technology stocks have often been resilient, recent shifts in central bank policy expectations and persistent inflation concerns are creating headwinds. The Federal Reserve's stance on interest rates remains a key determinant of risk appetite. Any indication of a prolonged higher-for-longer rate environment can dampen enthusiasm for growth stocks, which form the backbone of the Nasdaq100. Furthermore, global economic data, such as PMI and GDP figures, provide a broader context. A slowdown in these indicators can signal reduced corporate earnings potential, directly impacting valuations. The correlation between the Nasdaq100 and the US Dollar Index (DXY), which is currently at 101.17 and showing strength, is also a critical factor. A rising DXY often implies tighter financial conditions or increased global risk aversion, both of which can pressure growth-oriented equities.
The market is also grappling with the implications of a cooling labor market, as suggested by recent data. While a softer labor market might theoretically lead to a more dovish central bank stance, the current narrative often centers on the fight against sticky inflation. This creates a delicate balancing act for policymakers and uncertainty for investors. The S&P 500, currently trading around 6572.87, also shows signs of rotation and consolidation, with its own technical picture suggesting a potential shift. Its movement often acts as a barometer for overall market risk appetite, and its current trajectory can influence sentiment towards the Nasdaq100.
Technical Signals: A Mixed Bag on the Charts
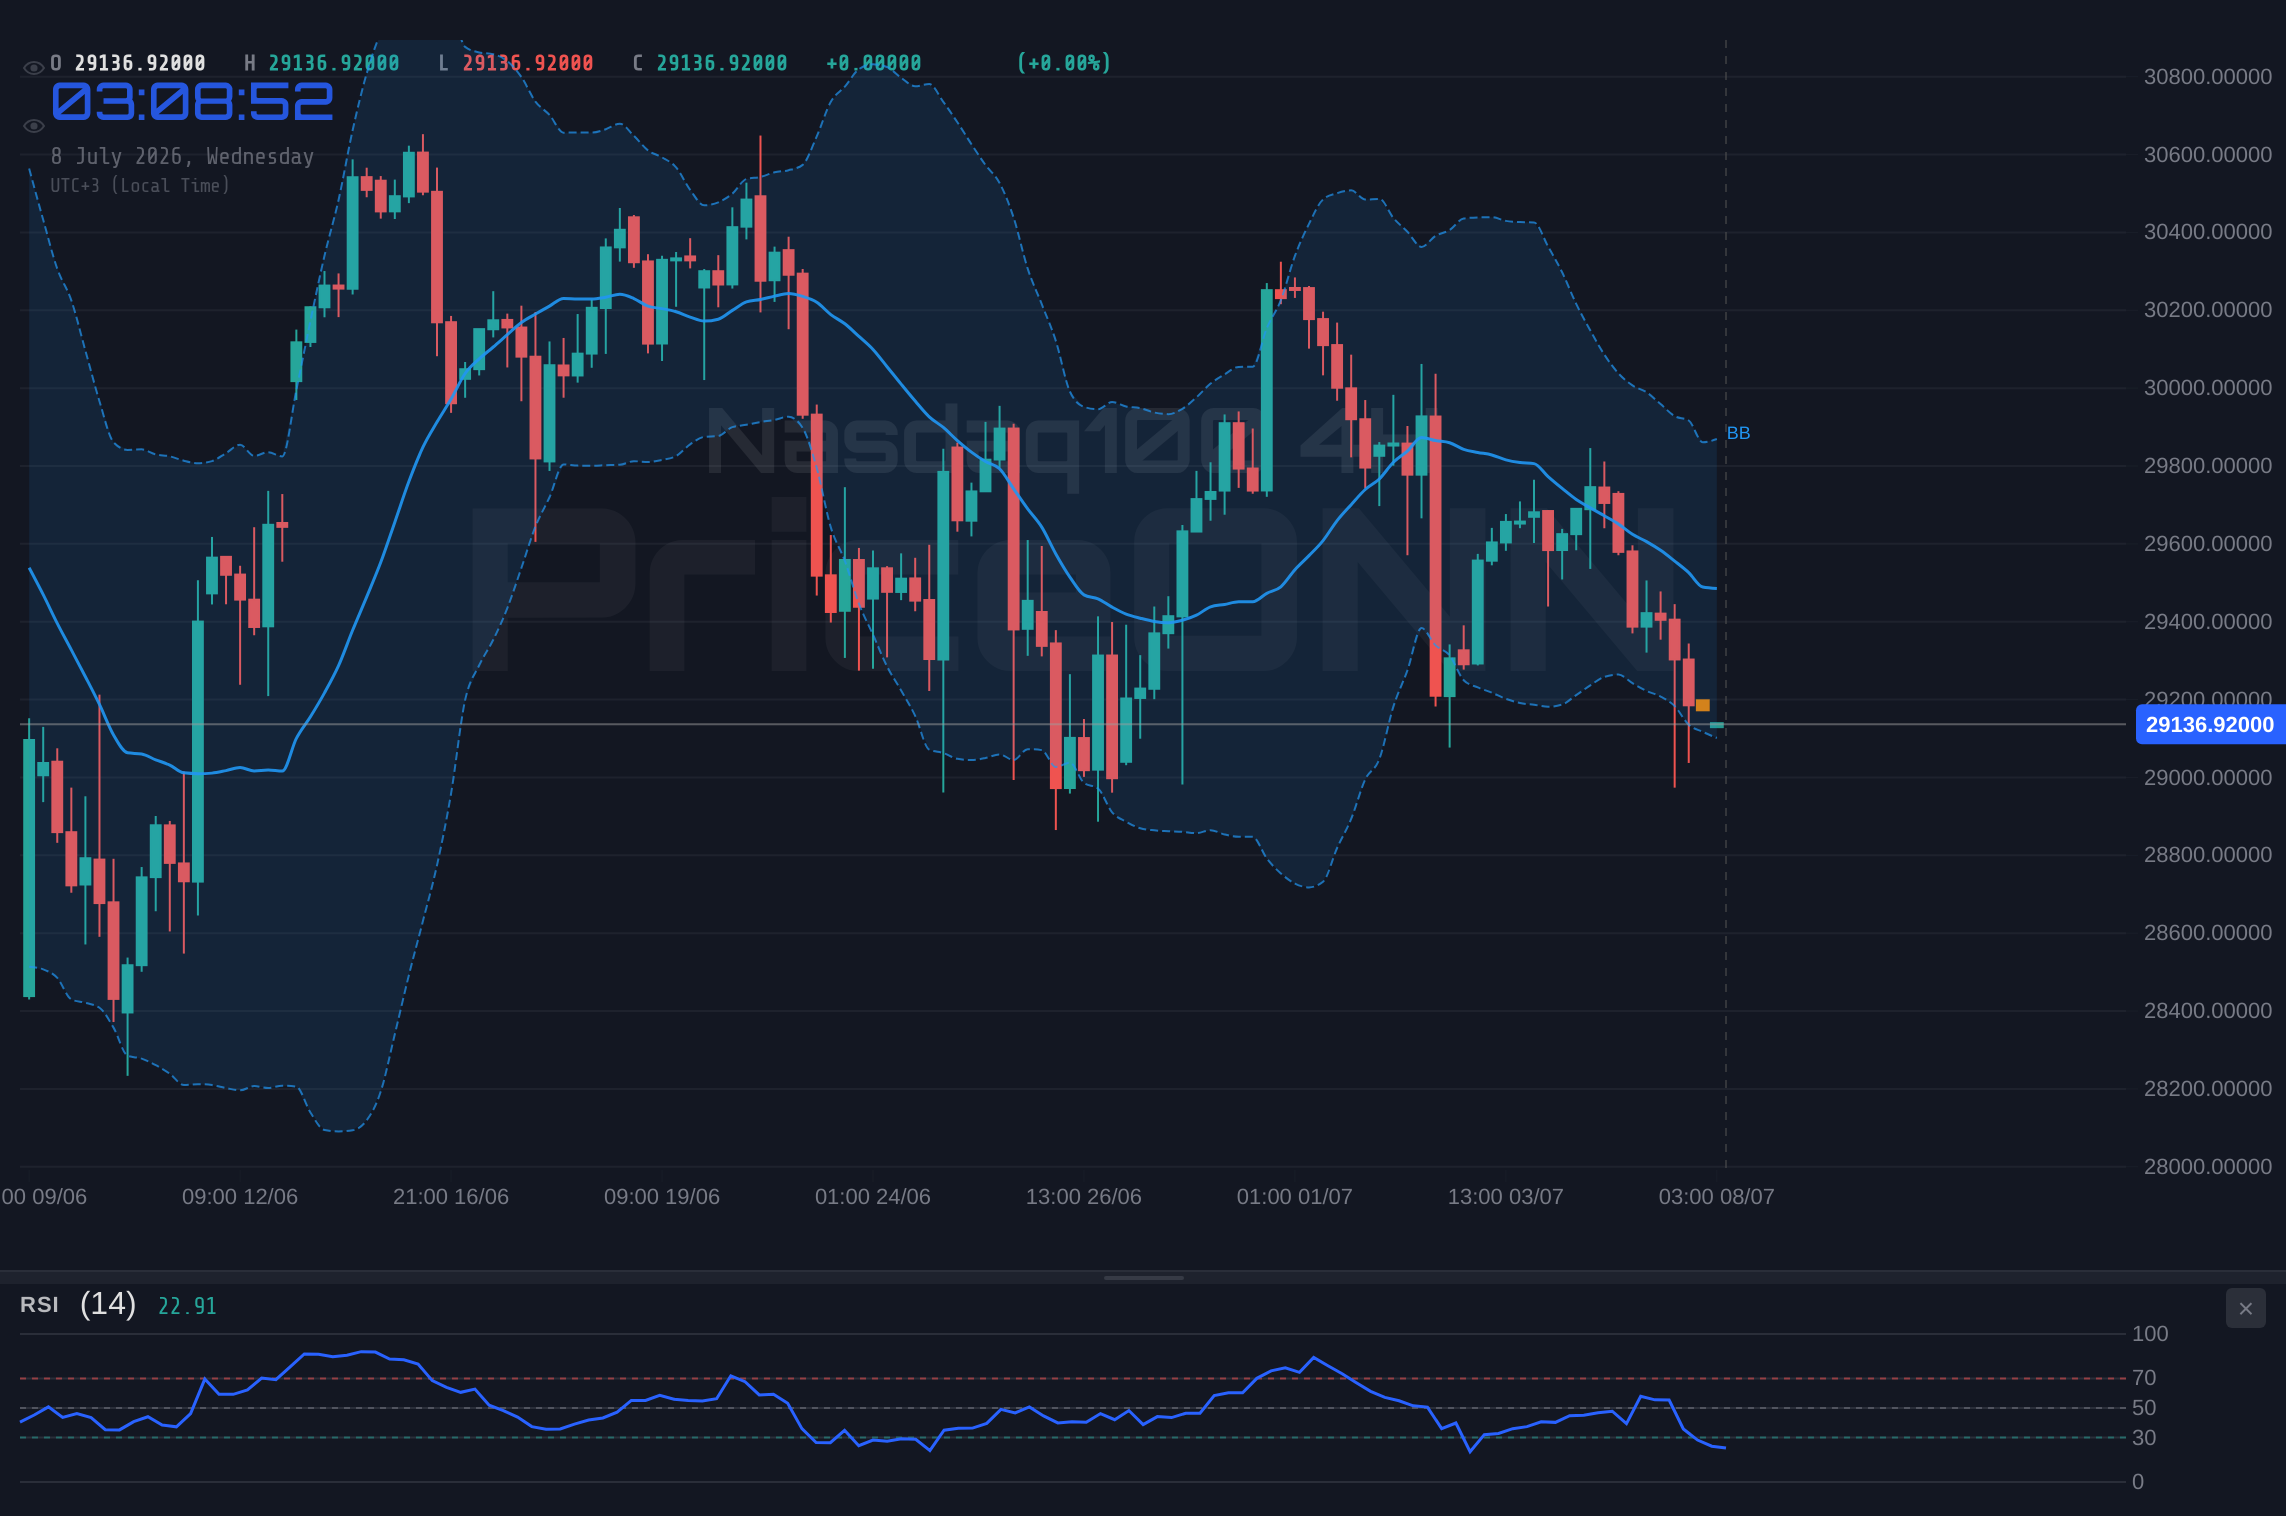
Examining the Nasdaq100's technical landscape at $29,126.52 reveals a blend of conflicting signals across different timeframes. On the 1-hour chart, the trend is decisively bearish with a strength of 95%, supported by a MACD showing negative momentum and an RSI at 34.87, firmly in neutral territory but leaning bearish. This suggests short-term selling pressure is dominant. However, the 4-hour chart presents a more neutral picture with a 50% trend strength, while the daily chart, despite a bearish daily close, indicates a bullish trend with 78% strength, albeit with a MACD exhibiting negative momentum and an RSI at 46.06. This divergence across timeframes highlights a market in transition, where short-term trends are battling against longer-term underlying strength.
The ADX, a measure of trend strength, also paints a nuanced story. On the 1-hour and 4-hour charts, it sits at 39.49 and 22.4 respectively, suggesting strong bearish momentum in the short term, but weakening trend strength on higher timeframes. The daily ADX at 16.03 points to a very weak trend, indicating that the current price action might be more range-bound or consolidating than indicative of a sustained directional move. Stochastic indicators are also showing a mixed bag: oversold conditions on the 1-hour chart might suggest a pause in selling, while the daily Stochastic shows a bullish signal with %K above %D. This technical ambiguity underscores the importance of carefully observing key price levels for confirmation.
The Bullish Case: Reclaiming the High Ground
Scenario 1: A Sustainable Rebound from Support
For the bulls to regain control, the Nasdaq100 needs to decisively hold the current support levels, primarily around $29,073.83. A strong bounce from this zone, ideally with increasing volume, would signal that the recent dip was a temporary correction rather than the start of a significant downtrend. The immediate trigger for such a scenario would be a failure for sellers to push the price below $29,073.83, followed by a confirmed close above the 1-hour resistance at $29,210.12. If this bullish momentum is sustained, the next price targets would be the 4-hour resistance levels, starting with $29,507.59, and potentially pushing towards the $29,887.73 daily resistance. This scenario would be reinforced by positive economic data releases, such as inflation figures coming in softer than expected or a more dovish tone from the Federal Reserve, which could ease concerns about prolonged high interest rates.
Confirmation of this bullish thesis would also require a shift in the technical indicators. We would look for the RSI to move back above 50, indicating a return to bullish momentum, and for MACD crossovers on the shorter timeframes to signal upward movement. The ADX needs to show a decrease in bearish trend strength or a pickup in bullish trend strength. A break above the daily resistance at $29,887.73, sustained over a few trading sessions, would further solidify this bullish outlook, suggesting a potential retest of higher price territories. This scenario hinges on market participants regaining confidence in growth prospects and a less restrictive monetary policy environment.
Probability Estimate: 30%
While a rebound is possible, the current technical signals and the broader macroeconomic environment suggest this scenario carries a moderate probability. The persistent strength of the DXY at 101.17 and the ongoing concerns about inflation create significant headwinds that cannot be easily dismissed. The Nasdaq100's current price of $29,126.52 is vulnerable if these macro factors continue to dominate market sentiment. However, if key support levels hold and positive catalysts emerge, a short-covering rally could certainly materialize.
The Bearish Case: Further Descent
Scenario 2: Breakdown Below Key Support
The path of least resistance, according to some short-term technical indicators, appears to be downwards. A bearish scenario for the Nasdaq100, currently at $29,126.52, would be triggered by a decisive break below the critical support level of $29,073.83. Confirmation would come from a sustained close below this level on the 4-hour chart, accompanied by strong selling volume. If this breakdown occurs, the next logical downside targets would be the lower support levels identified on the daily chart: $29,073.83 (which would then act as resistance if broken), $28,769.40, and potentially extending towards $28,564.95. This scenario would likely be fueled by disappointing economic data, such as higher-than-expected inflation or employment figures that suggest the Fed has little room to pivot towards easing. Geopolitical tensions could also escalate, increasing demand for safe-haven assets and putting pressure on riskier assets like tech stocks.
In this bearish scenario, technical indicators would align to signal further downside. We would expect the RSI to remain below 50, potentially falling into oversold territory on shorter timeframes, and the MACD to maintain its negative momentum. The ADX would ideally show increasing trend strength in the bearish direction. A close below the $28,564.95 level would significantly increase the probability of a deeper correction, potentially targeting the $27,000-$28,000 range, depending on the severity of the catalyst. This outlook would reflect a market environment where growth concerns and inflation fears outweigh any optimism about future Fed policy shifts.
Probability Estimate: 55%
Given the current technical readings on the 1-hour chart, the strength of the DXY at 101.17, and the general caution surrounding growth assets, the bearish scenario appears to be the most probable in the near term. The Nasdaq100's current price of $29,126.52 is perched precariously close to key support, making it vulnerable to a break. The confluence of negative short-term signals and macroeconomic uncertainties provides a strong foundation for this outlook. However, it's crucial to remember that market sentiment can shift rapidly based on new data or central bank commentary.
The Waiting Game: Consolidation and Uncertainty
Scenario 3: Range-Bound Action and Consolidation
It's also plausible that the Nasdaq100, currently trading around $29,126.52, could enter a period of consolidation. This would occur if neither the bulls nor the bears can gain decisive control, leading to a period of sideways price action. Such a scenario typically plays out when the market is awaiting significant catalysts, such as major economic data releases or central bank policy announcements. In this range-bound environment, the index might oscillate between the immediate support at $29,073.83 and the immediate resistance at $29,210.12 on the 1-hour chart, or potentially a wider range defined by the daily support at $29,073.83 and resistance at $29,887.73. This phase of consolidation could be characterized by choppy price action and lower trading volumes as market participants adopt a wait-and-see approach.
During consolidation, technical indicators often provide mixed or neutral signals, reflecting the indecision in the market. The RSI might hover around the 50 level, and the MACD could show flattening momentum. The ADX would likely remain relatively low, indicating a lack of strong directional trend. This period of uncertainty allows for underlying fundamentals to be digested, and for traders to position themselves ahead of the next significant move. The key triggers for breaking out of this range would be a clear catalyst that shifts the market's outlook, such as a surprisingly strong or weak inflation report, a definitive statement from the Fed, or a significant geopolitical development.
Probability Estimate: 15%
While consolidation is always a possibility, especially ahead of major economic events, the current technical indicators and the prevailing macroeconomic climate suggest a lower probability for a prolonged neutral phase. The strong bearish signals on the 1-hour chart and the significant levels being tested indicate a higher likelihood of a directional move, whether it be a bounce or a breakdown. However, if key upcoming data points are indeed mixed or inconclusive, this scenario could gain traction.
What's Next? Key Triggers to Watch
The immediate future for the Nasdaq100, currently hovering around $29,126.52, will likely be dictated by a few key factors. Firstly, the price action around the $29,073.83 support level is crucial. A failure to hold this level could accelerate the bearish scenario, while a strong bounce could pave the way for a retest of higher ground. Secondly, market participants will be keenly watching economic data releases. Upcoming inflation reports and employment figures will be critical in shaping expectations for Federal Reserve policy. Any deviation from consensus forecasts could trigger significant volatility. For instance, a surprisingly weak Non-Farm Payrolls (NFP) report, if it were to occur, could support a bullish case by increasing the likelihood of a Fed pivot, while stronger-than-expected data could reinforce the bearish outlook.
Thirdly, the movement of the US Dollar Index (DXY), currently at 101.17, will continue to be a significant correlated factor. A sustained rise in the dollar could continue to exert downward pressure on the Nasdaq100, while a weakening dollar might offer some respite. Finally, broader market sentiment, often reflected in the performance of the S&P 500 (trading around 6572.87), will play a role. A general risk-off environment would likely weigh on the tech-heavy index, whereas a return of risk appetite could see a recovery. Traders should remain vigilant for confirmation signals across multiple timeframes and indicators before making any decisive moves.
Bearish Scenario: The Downward Spiral
55% ProbabilityNeutral Scenario: The Waiting Game
15% ProbabilityBullish Scenario: The Rebound
30% ProbabilityFrequently Asked Questions: Nasdaq100 Analysis
What happens if the Nasdaq100 breaks below the $29,073.83 support level?
A break below $29,073.83 on the Nasdaq100 would likely trigger further selling pressure, targeting the next support at $28,769.40. This scenario would be confirmed by sustained bearish momentum on technical indicators and potentially negative macroeconomic news.
Should I consider buying the Nasdaq100 at current levels around $29,126.52 given the mixed signals?
Caution is advised at current levels of $29,126.52 due to the conflicting technical signals and the proximity to key support. A more prudent approach might be to wait for confirmation of a bounce above $29,210.12 or a decisive break below $29,073.83 before entering trades.
Is the RSI at 46.06 a sell signal for the Nasdaq100 right now?
An RSI of 46.06 on the daily chart for the Nasdaq100 is in neutral territory but leans towards bearish momentum. It's not a direct sell signal on its own but suggests that upward momentum is not strong, and the index remains vulnerable to further declines if other bearish factors align.
How might the DXY at 101.17 affect the Nasdaq100's direction this week?
The current DXY level of 101.17 indicates a strong dollar, which often correlates with pressure on risk assets like the Nasdaq100. If the dollar continues to strengthen, it could exacerbate the downward move in the Nasdaq100, potentially pushing it towards lower support levels.
| Indicator | Value | Signal | Interpretation |
|---|---|---|---|
| RSI (14) | 46.06 | Neutral | Suggests lack of strong momentum, leaning bearish |
| MACD Histogram | Negative | Bearish | Indicates negative momentum building |
| ADX | 16.03 | Weak Trend | Confirms lack of strong directional conviction |
| Stochastic | K=42.49, D=29.88 | Bullish Signal | Potential for short-term bounce, but overall context is key |
| 1H Trend Strength | 95% | Bearish | Dominant short-term bearish pressure |
Track markets in real-time
AI-powered analysis, technical indicators and real-time price data.
Join Our Telegram Channel
Breaking market news, AI analysis and trading signals instantly.
Join Channel