

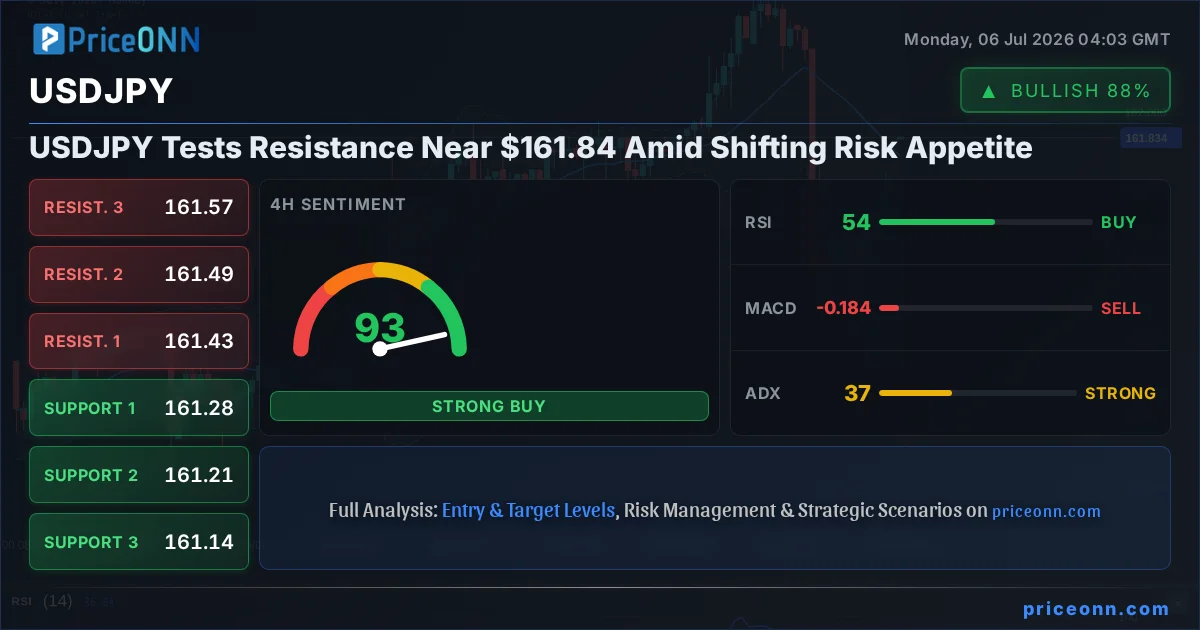
USDJPY is currently navigating a critical juncture, hovering just below the significant resistance mark of $161.84. This price point, a focal point for traders and analysts alike, represents a key battleground where the bulls' recent upward momentum faces a stern test. The pair has seen a notable push higher, driven by a combination of factors including the strengthening US Dollar Index (DXY) and persistent yield differentials. However, the question on everyone's mind is whether this ascent can be sustained, or if the market is poised for a correction. Understanding the interplay of technical indicators, macroeconomic drivers, and shifting risk sentiment is crucial for deciphering the next potential move in this high-profile currency pair.
- USDJPY is trading at $161.84, testing resistance near the $161.75 level.
- The ADX at 37.05 indicates a strong trend, but RSI at 68.74 (1H) and 60.29 (1D) shows mixed signals, suggesting caution.
- Key support levels are identified at $161.72, $161.68, and $161.62 on the 1-hour chart.
- The correlation with DXY, currently at 100.95, remains a significant factor influencing USDJPY's direction.
Navigating the $161.84 Resistance Zone
The Battle for Control: Price Action and Key Levels
The USDJPY pair is currently locked in a tight dance around the $161.84 mark, a level that has historically acted as a significant psychological and technical barrier. On the 1-hour chart, the immediate resistance is seen at $161.82, with further hurdles at $161.88 and $161.92. The fact that the current price is pushing these boundaries suggests underlying bullish sentiment, likely fueled by the upward momentum observed in the US Dollar Index (DXY), which is currently trading at 100.95 and showing a general upward trend on the daily timeframe. This correlation is fundamental; a stronger dollar typically implies upward pressure on USDJPY. The daily chart, in particular, shows USDJPY trending upwards with 92% strength, suggesting that the path of least resistance might still be to the upside, despite the proximity to resistance.
However, the narrative isn't entirely one-sided. While the 1-hour chart shows a general upward trend (90% strength) and the 4-hour chart presents a neutral stance (50% strength), the daily timeframe displays a robust uptrend (92% strength). This multi-timeframe alignment is usually a strong signal, but the immediate price action near resistance demands a closer look. The intraday trading range has been relatively tight, oscillating between $161.624 and $161.927, indicating a period of consolidation as the market digests recent data and prepares for the next move. The presence of strong support levels at $161.725, $161.684, and $161.624 on the 1-hour chart provides a safety net for any potential pullback, but the immediate focus remains on breaking through the $161.84 ceiling.
Momentum Indicators: A Mixed Bag of Signals
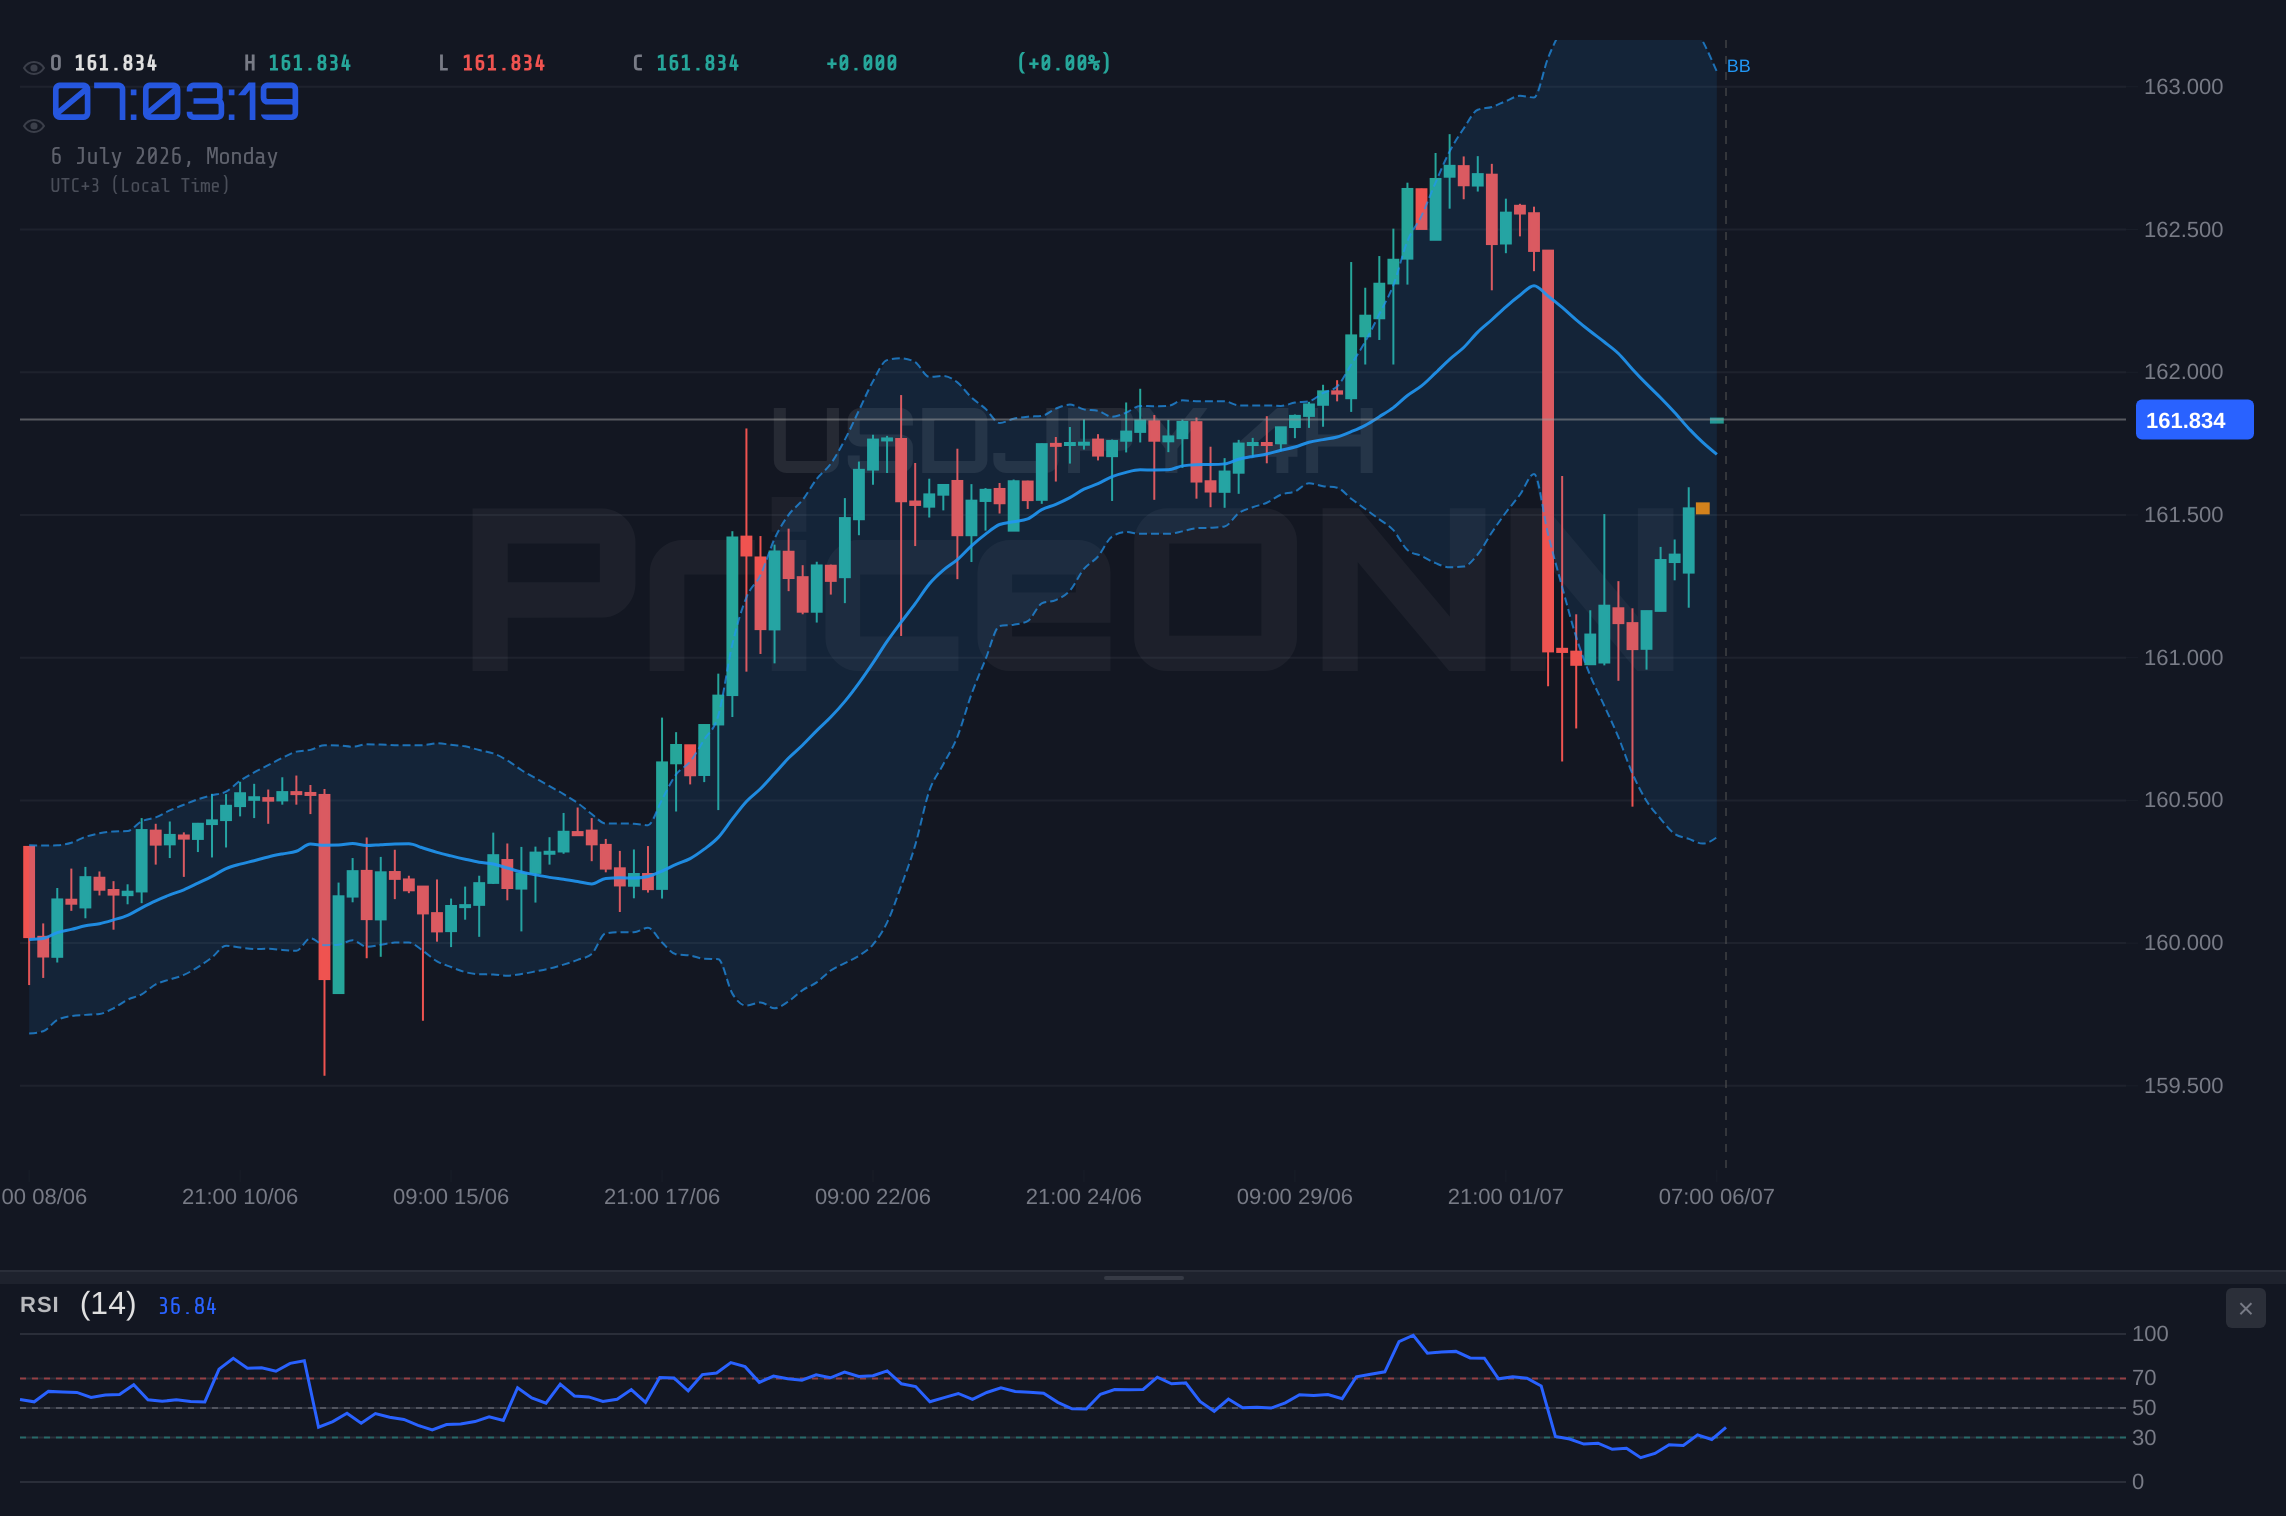
Diving into the technical indicators, we see a picture that is far from clear-cut, demanding a nuanced approach from traders. On the 1-hour timeframe, the Relative Strength Index (RSI) is sitting at 68.74, firmly in the neutral zone but trending upwards. This suggests that while there's buying pressure, it hasn't reached extreme overbought territory yet, leaving room for further upside. The MACD indicator, however, paints a slightly different story; it's showing negative momentum with the MACD line below the signal line. This divergence between RSI and MACD can often signal underlying weakness in the current trend, even if price is still pushing higher. Stochastic oscillators are also flashing an overbought signal, with %K at 95.16 and %D at 82.43, indicating that the upward move might be getting stretched on this shorter timeframe.
Moving to the 4-hour chart, the picture shifts again. The RSI here is at 53.83, indicating a neutral stance with a slight upward bias, which aligns better with the price action. The MACD shows negative momentum, still below the signal line, which is somewhat contradictory to the broader bullish trend indicated by the ADX at 37.05. The ADX itself, across all timeframes (1H: 31.17, 4H: 37.05, 1D: 24.51), generally points towards a strong trend, though its strength varies. The daily ADX reading of 24.51 suggests a moderately trending market, which can be less conducive to sharp, sustained moves compared to higher ADX values. The Stochastic on the 4-hour chart shows %K at 73.54 and %D at 39.37, suggesting a bullish signal as %K crosses above %D, but the overall overbought condition needs monitoring. This complex tapestry of indicator signals underscores the importance of not relying on a single metric, but rather synthesizing the information across different timeframes and tools.
The Macroeconomic Undercurrents
Dollar Strength and Yield Differentials: The Driving Forces
The persistent strength of the US Dollar Index (DXY), currently trading at 100.95, remains a primary driver for USDJPY. This strength is often underpinned by a combination of factors, including interest rate expectations in the US, global risk sentiment, and relative economic performance. While the Federal Reserve has signaled a data-dependent approach to monetary policy, the market often prices in future rate hikes or holds based on inflation and employment figures. The latest US employment data, which caused volatility last week, highlighted this sensitivity. If the Fed maintains a hawkish stance, or if economic data continues to surprise to the upside, the yield differential between US Treasuries and Japanese government bonds could widen further, providing sustained support for USDJPY.
Conversely, the Bank of Japan (BOJ) has maintained an ultra-loose monetary policy, with Governor Ueda recently indicating that the central bank is in a “good position” after its June rate hike. This divergence in monetary policy is a fundamental catalyst for the USDJPY pair's appreciation. While the Japanese government has been vocal about intervening in the FX markets if the yen weakens excessively, the underlying economic fundamentals often dictate the longer-term trend. The historical precedent suggests that significant interventions are rare and often temporary. Therefore, the broader trend is likely to be dictated by the widening interest rate gap, making USDJPY's upward trajectory a persistent theme unless there's a significant shift in either the Fed's or the BOJ's policy outlook.
Geopolitical Winds and Risk Appetite
Global geopolitical tensions, while not directly headline news for USDJPY in the last 48 hours, always play a background role. Events like the ongoing Russia-Ukraine conflict, Middle East tensions, or US-China relations can influence global risk appetite, which in turn affects currency markets. During periods of heightened uncertainty, the Japanese Yen (JPY) often benefits from its safe-haven status. However, the overwhelming strength of the US dollar and the significant interest rate differential have so far dwarfed this safe-haven appeal. The current market sentiment appears to be cautiously optimistic, with major indices like the S&P 500 showing gains, suggesting that immediate flight-to-safety flows into JPY are not dominant. Nevertheless, any sudden geopolitical escalation could rapidly shift this dynamic, potentially offering a bid for the yen and pressuring USDJPY lower, irrespective of the broader trend.
The recent news about Big Tech's struggle for electricity highlights the growing demand for power, potentially influenced by AI development. While this is a longer-term structural trend, it can indirectly impact commodity prices and inflation expectations, which then feed into central bank policy decisions. For instance, higher energy prices could lead to renewed inflation concerns, potentially prompting the Fed to maintain a tighter monetary policy, which would be supportive of USDJPY. Conversely, any signs of economic slowdown or geopolitical instability could dampen risk appetite, leading to a reversal in USDJPY. The interconnections are complex, and traders must remain vigilant to these broader macroeconomic and geopolitical undercurrents.
Trading Scenarios and Outlook
Given the current technical and fundamental backdrop, several scenarios are plausible for USDJPY. The proximity to significant resistance at $161.84, coupled with mixed indicator signals, suggests a period of increased volatility or consolidation before a decisive move. The strong ADX readings across timeframes point to an underlying trend, but the conflicting signals from RSI and MACD on the shorter timeframes warrant caution. The key will be how the pair behaves around the $161.84 level. A decisive break and hold above this resistance could open the door for further upside, targeting higher levels. Conversely, a failure to break through could lead to a pullback towards the identified support zones, testing the resilience of the current uptrend.
Bearish Scenario: Resistance Holds Firm
Bearish Scenario: Resistance Holds Firm
60% ProbabilityNeutral Scenario: Consolidation Around Resistance
Neutral Scenario: Consolidation Around Resistance
25% ProbabilityBullish Scenario: Resistance Breakout
Bullish Scenario: Resistance Breakout
15% ProbabilityThe Path Forward: What to Watch
Key Economic Events and Data Points
Looking ahead, several economic events could significantly influence USDJPY's trajectory. While specific upcoming data releases weren't detailed in the provided context, general market awareness of economic calendars is crucial. Any significant inflation or employment data from the US or Japan could trigger sharp moves. For instance, stronger-than-expected US inflation figures might reinforce the Fed's hawkish stance, potentially pushing USDJPY higher. Conversely, softer data could lead to a reassessment of Fed policy expectations, putting downward pressure on the pair. Similarly, any dovish signals from the BOJ, or increased intervention fears, could impact the yen's strength. Traders should closely monitor the economic calendar for high-impact releases related to both economies.
The recent volatility following US Non-Farm Payrolls (NFP) data serves as a stark reminder of how sensitive USDJPY can be to macroeconomic surprises. The market's reaction to such data often depends on whether it aligns with, or deviates from, prevailing expectations. If the data suggests a stronger economy than anticipated, it could reinforce the bullish case for USDJPY by widening the interest rate differential. If the data disappoints, it might trigger a risk-off sentiment, benefiting the yen in the short term, although the powerful dollar trend could mitigate this effect. The ECB's recent stance, with Governing Council member Emmanuel Moulin noting the bank is in a “good position” after its rate hike, suggests a cautious approach to further tightening in Europe, which indirectly affects the broader FX landscape and dollar strength.
Technical Confirmation and Risk Management
For USDJPY, confirmation of any directional bias will be crucial. A sustained break above $161.84, accompanied by supportive technical indicators (e.g., RSI moving out of overbought territory on the 1H chart, MACD showing sustained positive momentum), would strengthen the bullish case. On the flip side, a decisive break below the $161.72 support level, with indicators turning bearish, would signal a potential reversal or deeper correction. Given the strong trend indicated by the ADX, any pullback might be an opportunity for buyers to enter the market at better levels, provided key supports hold. However, the risk of a sharp reversal cannot be ignored, especially if market sentiment shifts rapidly due to unforeseen geopolitical events or economic data surprises.
Effective risk management remains paramount. Traders should consider using stop-loss orders to protect against adverse price movements, especially when trading near significant resistance or support levels. The current market environment, characterized by strong underlying trends but also conflicting short-term signals, requires a disciplined approach. Patience is key; waiting for clear confirmation signals before entering positions can significantly improve the probability of success. The market always provides opportunities, and forcing trades in uncertain conditions often leads to losses. By adhering to a well-defined strategy and managing risk diligently, traders can navigate the volatility surrounding USDJPY and potentially capitalize on upcoming market movements.
Frequently Asked Questions: USDJPY Analysis
What happens if USDJPY breaks above the $161.84 resistance level?
A sustained close above $161.84, particularly above $161.92, could trigger a bullish scenario. Target 1 would be the psychological level of $162.04, followed by $162.25. This scenario becomes more probable if accompanying technical indicators show continued bullish momentum.
Should I consider buying USDJPY at current levels near $161.84 given the mixed RSI and MACD signals?
Entering at current levels carries risk due to resistance near $161.84 and conflicting short-term indicators. A neutral scenario suggests consolidation, while a bearish scenario is more probable if $161.72 support breaks. Patience and waiting for clearer signals or a confirmed breakout are advised.
Is the RSI at 68.74 on the 1-hour chart a sell signal for USDJPY?
An RSI of 68.74 is in the neutral zone, trending upwards, which doesn't constitute a direct sell signal yet. While it indicates buying pressure, it's not in extreme overbought territory. However, coupled with negative MACD momentum, it suggests potential weakness and warrants monitoring for signs of reversal or consolidation.
How might the US Dollar Index (DXY) at 100.95 impact USDJPY's trend this week?
The DXY's strength at 100.95 generally supports USDJPY, as they often move in tandem. If the DXY continues to rise, driven by Fed rate expectations or risk-off sentiment, it would likely provide further upward pressure on USDJPY. Conversely, a significant DXY pullback could lead to a correction in USDJPY.
Track markets in real-time
AI-powered analysis, technical indicators and real-time price data.
Join Our Telegram Channel
Breaking market news, AI analysis and trading signals instantly.
Join Channel