

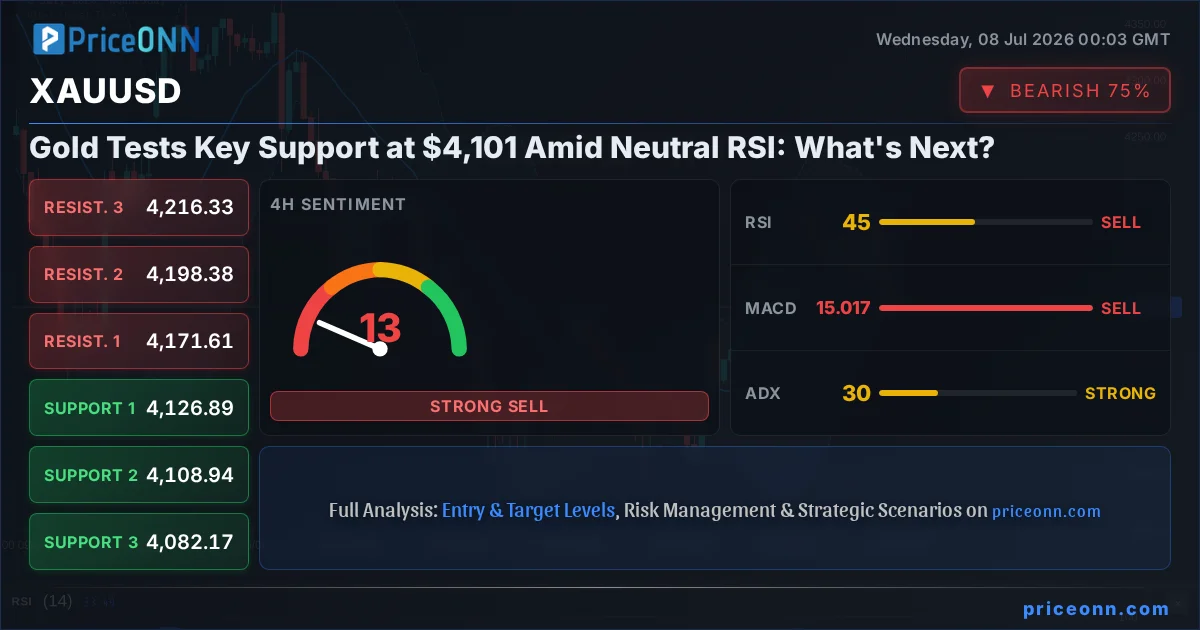
Gold, or XAUUSD, is currently hovering around the critical $4,101.07 mark, a level that traders and analysts are watching with bated breath. This price point is not just a number; it represents a confluence of recent price action and technical indicators that could dictate the precious metal's short-to-medium term trajectory. The market sentiment appears to be at a crossroads, with conflicting signals emerging from various timeframes and indicators, demanding a closer look at the underlying dynamics. The recent sharp decline, which saw gold shed approximately 1.53% or $63.69 from its previous highs, has brought it back to levels that were previously considered strong support. However, the question on everyone's mind is whether these levels will hold, or if the bearish momentum will continue to push prices lower. This analysis delves into the intricate technical landscape, exploring the interplay between price action, key indicators, and broader market correlations to decipher the most probable path forward for gold.
- XAUUSD is currently trading at $4,101.07, testing a significant support level after a 1.53% daily decline.
- The 1H RSI at 33.84 indicates a bearish trend, while the 4H RSI at 45.78 suggests a neutral stance with a downward bias.
- Key support levels to watch are $4,092.61 (1H) and $4,087.05 (1H), with resistance at $4,104.89 (1H).
- The overall trend shows mixed signals, with 1H and 4H indicators leaning towards selling, while the Daily chart presents a more complex picture with some bullish undertones.
- The DXY's rise to 101.19 adds pressure, suggesting a potentially weaker outlook for gold if the dollar continues its ascent.
The Tightrope Walk: Navigating Gold's Current Technical Landscape
The 1-hour chart paints a decidedly bearish picture for gold. The trend is firmly established in a downtrend with an impressive 86% strength, according to the ADX reading of 22.9. This suggests that momentum is behind the sellers in the short term. The RSI(14) sits at 33.84, firmly in neutral territory but with a clear downward inclination, indicating room for further downside before becoming oversold. The MACD confirms this, showing negative momentum with the MACD line below its signal line. Bollinger Bands are also trading below the middle band, reinforcing the bearish sentiment. The Stochastic Oscillator, with its K line at 11.6 and D line at 21.81, further signals a bearish trend, as %K is below %D and both are in oversold territory, suggesting potential for a bounce but within a prevailing downtrend. The overall signal across the 1H timeframe aggregates to a strong 'SELL' recommendation, based on 7 sell signals versus only 1 buy signal. This short-term bearish bias is a crucial factor for intraday traders, highlighting immediate selling pressure that could push prices towards the first support level at $4,092.61.
The 4-Hour Conundrum: Mixed Signals and Trend Ambiguity
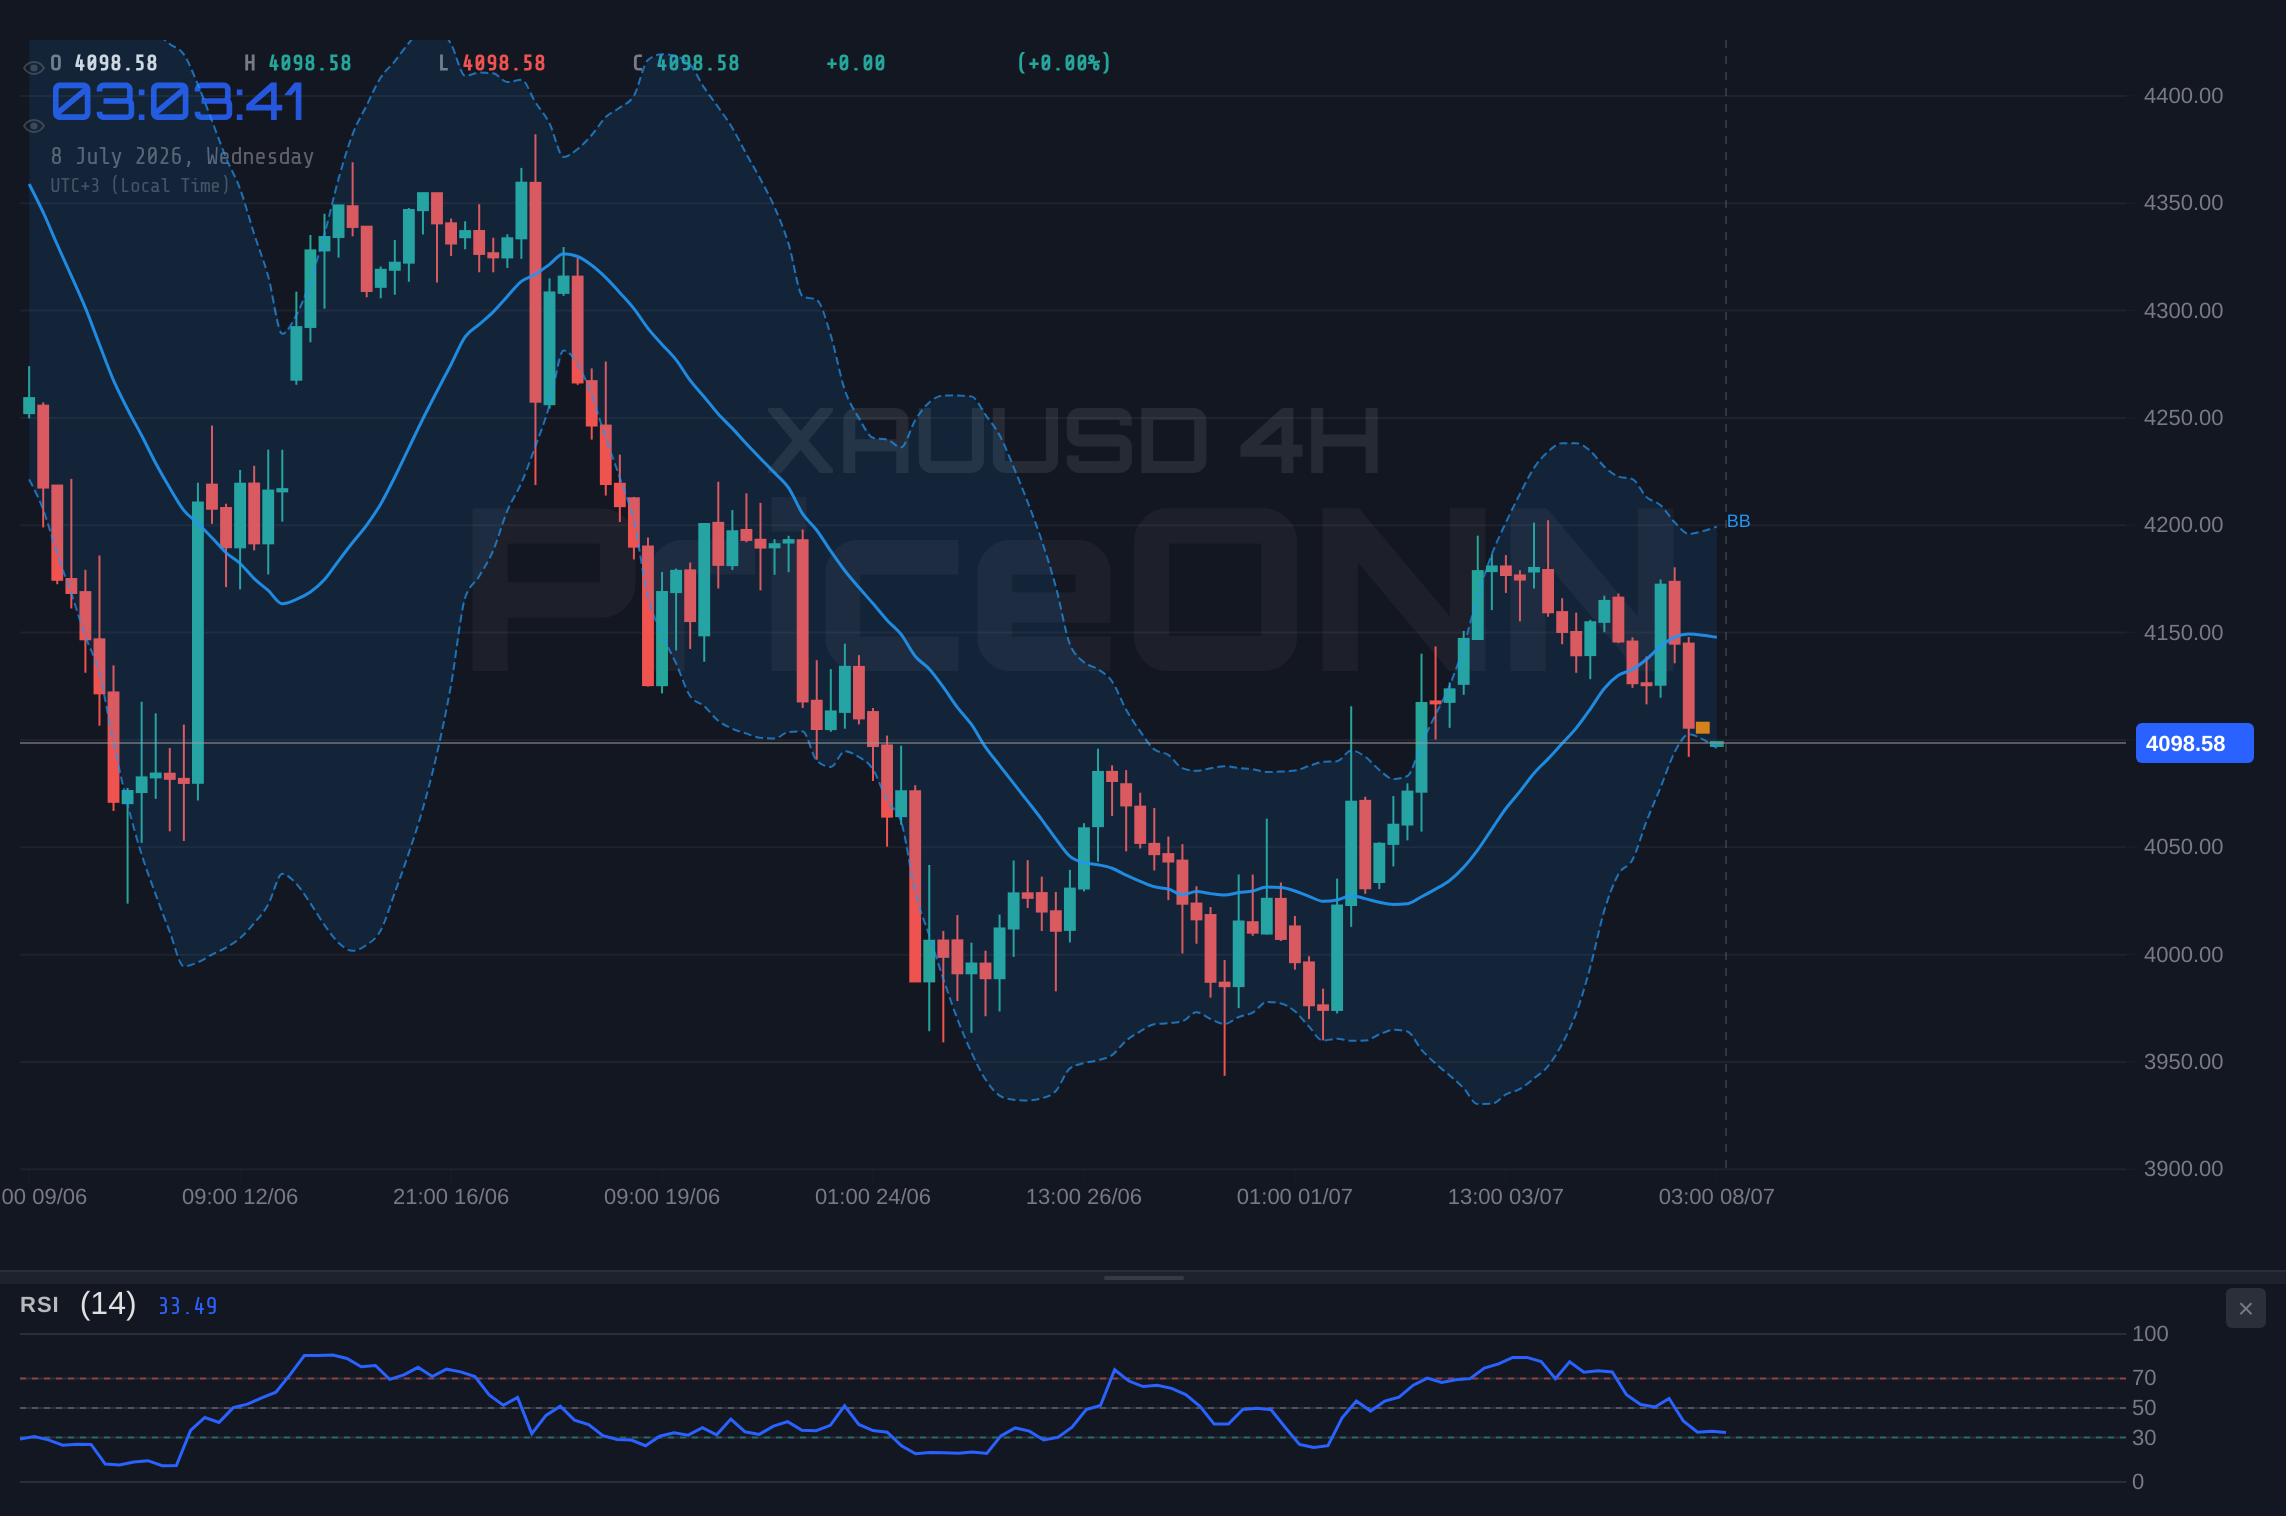
Shifting to the 4-hour timeframe, the picture becomes more complex. Here, the trend is classified as 'Neutral' with a 50% strength, indicating a lack of clear directional conviction. Support levels are identified at $4,126.89, $4,108.94, and $4,082.17, while resistance stands at $4,171.61, $4,198.38, and $4,216.33. The RSI(14) is at 45.78, still in neutral territory but leaning downwards, suggesting sellers are still in play, albeit without overwhelming conviction. The MACD is also showing negative momentum, with the MACD line below its signal line, mirroring the 1-hour sentiment. However, the Bollinger Bands are below the lower band, which can sometimes signal an oversold condition or a strong breakout to the downside, demanding careful interpretation. Intriguingly, the Stochastic Oscillator presents a contrasting bullish signal, with K=39.81 and D=29.99, indicating %K is above %D and potentially heading out of oversold territory. The ADX at 30.06 suggests a strong trend, but its directionality isn't explicitly stated in the summary; however, given the Stochastic's movement, it might be interpreted as a strong trend in development, potentially a reversal. The overall signal on the 4H timeframe leans towards 'SELL' (2 buy, 6 sell), but the conflicting Stochastic reading adds a layer of uncertainty, suggesting that the market is grappling with conflicting forces.
Daily Timeframe Dynamics: Glimmers of Hope or Lingering Weakness?
The daily timeframe offers another perspective, revealing a trend that is also classified as 'Neutral' with 50% strength. Support is found at $4,127.93, $4,091.11, and $4,053.9, with resistance points at $4,201.96, $4,239.17, and $4,275.99. The RSI(14) is at 42.33, again in neutral territory and trending downwards, implying that while not oversold, the bears have maintained some control over the longer term. The MACD, however, shows positive momentum with its line above the signal line, a divergence from the shorter timeframes and a potential hint of underlying strength. The Bollinger Bands are positioned below the middle band, indicating a bearish bias on the daily chart, aligning with the RSI's downward trajectory. The Stochastic Oscillator provides a bullish signal, with K=79.06 and D=49.98, indicating %K is significantly above %D and in overbought territory, suggesting a potential for a reversal or at least a pause in the downtrend. The ADX at 38.14 indicates a strong trend, and in conjunction with the daily MACD and Stochastic, it suggests that this strong trend might be the previous downtrend losing steam or a new uptrend beginning to form. The daily signal is predominantly 'SELL' (2 buy, 6 sell), but the positive MACD and overbought Stochastic create a narrative of potential resilience or an impending shift that cannot be ignored.
Correlations and Context: The Dollar's Shadow Over Gold
Understanding gold's price action requires acknowledging its intricate relationship with other major market instruments, particularly the US Dollar Index (DXY). The provided data shows the DXY at 101.19, exhibiting a significant daily increase of 0.34%. This strengthening dollar typically exerts downward pressure on gold, as dollar-denominated commodities become more expensive for holders of other currencies. The 1-hour DXY trend is strong at 84% bullish, with RSI at 72.09 in overbought territory, suggesting that the dollar's strength might be nearing a short-term peak, but it's currently a headwind for gold. Furthermore, the S&P 500 is showing positive movement, up 0.74% to 6572.87, indicating a generally positive risk appetite in equities. This typically correlates inversely with safe-haven assets like gold, though the current price action for gold suggests other factors are at play. The Nasdaq 100, however, is down 2.08% to 29085.79, indicating a more cautious sentiment in the tech sector, which could indirectly support gold if it's perceived as a safe haven amidst tech sell-offs. These correlated movements are not isolated events; they form a complex web that influences investor decisions and capital flows, making it crucial to consider the broader market context when analyzing gold's price movements.
The Brent and WTI Oil Conundrum: Energy Prices and Inflationary Pressures
The energy markets are currently experiencing significant volatility, with both Brent and WTI crude oil showing substantial daily gains. Brent crude is up 5.6% to $76.03, and WTI is up 5.64% to $72.73. This surge in oil prices has direct implications for inflation expectations. Higher energy costs often translate into broader inflationary pressures across the economy, which historically can drive demand for gold as an inflation hedge. However, the current technical signals for gold, particularly on the shorter timeframes, suggest this inflationary pressure is not yet translating into buying demand for the precious metal. The 1-hour charts for both oil benchmarks show strong bullish trends with RSI readings in the high 80s, indicating they are significantly overbought and potentially due for a pullback. If oil prices were to correct sharply, it could alleviate some inflationary concerns, potentially reducing some of the underlying support that gold might otherwise find. Conversely, if oil prices continue to climb, it could reignite inflation fears and eventually provide a tailwind for gold, provided other market forces don't overwhelm this effect. The current divergence between rising oil prices and falling gold prices highlights the complexity of market drivers and the dominance of other factors, such as dollar strength and risk sentiment, in the immediate term.
The Bear's Roadmap: Downside Targets and Triggers
For the bears to maintain control and push XAUUSD lower, several conditions must be met, and specific levels must be breached. The immediate focus is on the 1-hour support at $4,092.61. A decisive break below this level, especially with increased volume and confirmed by momentum indicators on the 1-hour and 4-hour charts, would signal further downside. The next significant support level to watch would be $4,087.05, followed by $4,080.33. If the price breaks decisively below the 1-hour lower Bollinger Band, it could indicate accelerated selling. The bearish scenario is further supported if the DXY continues its ascent towards the 101.21 resistance, putting additional pressure on gold. For this bearish outlook to materialize and extend, the daily chart's neutral stance needs to firmly tip towards selling, perhaps with the RSI breaking below 40 and the MACD histogram showing sustained negative momentum. The invalidation of this bearish view would occur if gold prices decisively reclaim the $4,104.89 resistance level on the 1-hour chart, signaling a potential short-covering rally. The probability of this bearish scenario playing out in the immediate short-term (intraday to 1-2 days) is estimated at 65%, given the prevailing 1H bearish signals and the dollar's current strength.
The Bull's Gambit: Upside Potential and Confirmation
Despite the bearish short-term signals, the daily chart's technicals offer glimmers of hope for the bulls. A bullish scenario would require gold to decisively break above the immediate 1-hour resistance at $4,104.89. This initial move would need to be confirmed by a sustained push above the 4-hour resistance at $4,126.89. If gold can hold above this level, the next targets would be $4,171.61 and potentially $4,198.38 on the 4-hour chart. The bullish case is bolstered by the daily Stochastic Oscillator being in overbought territory (K=79.06, D=49.98) and the MACD showing positive momentum. For this scenario to gain traction, we would need to see the 1-hour RSI move decisively out of the oversold zone and break above 40, and the MACD histogram turn positive. Furthermore, a pullback in the DXY, perhaps if it fails to break above 101.21 and turns lower, could provide the necessary catalyst. The invalidation of this bullish thesis would occur if gold fails to break above $4,104.89 and instead breaks below the $4,092.61 support, negating the potential for an upside move. The probability of a sustained bullish move in the near term (this week) is currently estimated at 25%, contingent on strong bullish confirmation signals and a shift in broader market sentiment or dollar weakness.
The Waiting Game: Neutral Consolidation and Its Triggers
A neutral scenario, characterized by consolidation and range-bound trading, is also a distinct possibility, especially given the conflicting signals across different timeframes. In this scenario, gold might trade sideways between the immediate support and resistance levels identified on the 1-hour chart, roughly between $4,092.61 and $4,104.89. This range could persist if neither the bulls nor the bears can gain a decisive advantage, perhaps due to a lack of significant macroeconomic news or a balanced interplay between dollar strength and inflation concerns. The ADX readings across the timeframes (1H: 22.9, 4H: 30.06, 1D: 38.14) suggest that while trends are developing, they lack the extreme strength to push prices decisively out of their current range in the very short term. A neutral outlook would be invalidated if either the bullish or bearish scenario's trigger conditions are met. For this range to hold, we would likely see the RSI fluctuate around the 40-50 level on the daily chart, and the MACD remain close to the zero line, indicating a market in equilibrium. The probability of this neutral, range-bound scenario playing out over the next 24-48 hours is estimated at 10%, representing the possibility of indecision before a more significant move.
The Path Forward: Key Triggers and What to Watch
As gold navigates these choppy waters, several key triggers will be critical in determining its next significant move. Firstly, the price action around the $4,101.07 current level and the immediate 1-hour resistance at $4,104.89 is paramount. A confirmed breach and hold above this level, supported by increasing volume and positive momentum shifts on the 4-hour chart, would strongly favor the bullish scenario. Conversely, a sustained break below the 1-hour support at $4,092.61, particularly if accompanied by a strengthening DXY and negative sentiment in equities, would solidify the bearish outlook. Secondly, closely monitoring the DXY's trajectory is essential. If it continues to climb towards its 1-hour resistance at 101.21, it will likely cap any upside for gold. A reversal in the DXY, however, could unlock significant buying potential for the precious metal. Thirdly, upcoming economic data releases, particularly any news related to inflation or central bank policy shifts, could act as major catalysts. While no specific events are listed in the provided context for the immediate future, any surprises in macroeconomic releases could rapidly alter the market's risk appetite and, consequently, gold's price direction. Traders should remain vigilant for these key levels and catalysts to align their strategies effectively.
Bearish Scenario: The Bears Tighten Grip
65% ProbabilityNeutral Scenario: The Waiting Game
10% ProbabilityBullish Scenario: A Glimmer of Hope
25% ProbabilityFrequently Asked Questions: XAUUSD Analysis
What happens if XAUUSD breaks below the $4,092.61 support level?
A break below $4,092.61, particularly with strong volume, would likely trigger further selling pressure, potentially targeting $4,087.05 and $4,080.33 as indicated by the 1-hour chart's bearish bias.
Should I buy XAUUSD at current levels of $4,101.07 given the mixed signals?
Buying at $4,101.07 carries risk due to the bearish short-term signals and the dollar's strength. A more conservative approach would be to wait for confirmation of a bullish reversal, such as a sustained break above $4,104.89, or for price to test lower support levels like $4,092.61 before considering entry.
Is the neutral RSI at 33.84 on the 1-hour chart a sell signal for XAUUSD?
While not strictly oversold, an RSI of 33.84 on the 1-hour chart, combined with negative MACD momentum and the overall downtrend, suggests continued bearish pressure. It indicates that sellers are in control, and further downside is possible before any significant bounce.
How will the rising DXY at 101.19 affect XAUUSD this week?
The strengthening DXY exerts downward pressure on gold. If the dollar continues to rise towards its resistance at 101.21, it could cap gold's upside potential and reinforce the bearish outlook, especially if key support levels for XAUUSD fail to hold.
| Indicator | Value | Signal | Interpretation |
|---|---|---|---|
| RSI (14) | 33.84 | Bearish | Neutral territory, downward bias (1H) |
| MACD | Negative | Bearish | Negative momentum (1H) |
| Stochastic | K=11.6, D=21.81 | Bearish | Oversold, %K |
| ADX | 22.9 | Neutral | Medium strength trend (1H) |
| Bollinger Bands | Below Mid | Bearish | Bearish pressure (1H) |
Track markets in real-time
AI-powered analysis, technical indicators and real-time price data.
Join Our Telegram Channel
Breaking market news, AI analysis and trading signals instantly.
Join Channel