

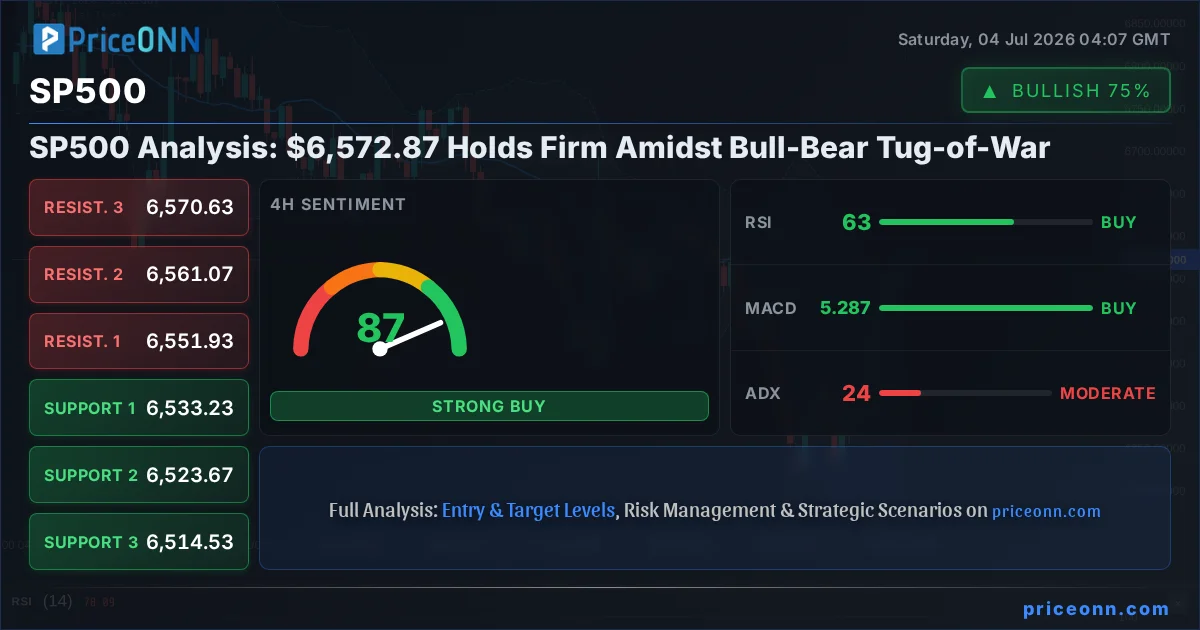
Last Friday, the S&P 500 index closed at $6,572.87, marking a modest 0.74% gain for the week. Yet, beneath this seemingly stable surface, a fierce debate rages between market bulls and bears. The index's trajectory has been a complex interplay of technical signals and shifting macroeconomic narratives, leaving traders and investors on edge. Is this upward momentum sustainable, or are we merely witnessing a temporary reprieve before a deeper correction? This analysis delves into the intricate technical landscape, the underlying fundamental drivers, and the potential scenarios that could shape the S&P 500's path in the coming trading sessions, offering a comprehensive outlook for the week ahead. With the ADX hovering around 24.23, indicating a moderate trend, and conflicting signals from RSI and MACD, the market is at a critical juncture, demanding a nuanced approach to trading.
- The S&P 500 closed Friday at $6,572.87, with a weekly gain of 0.74%.
- Critical support sits at $6,533.23 (4H), tested multiple times this week, while resistance at $6,570.63 (4H) is currently being challenged.
- RSI at 62.83 on the 4H chart signals upward momentum, but the 1H RSI at 70.95 suggests overbought conditions on shorter timeframes, hinting at potential pullbacks.
- The ADX at 24.23 indicates a moderate trend, suggesting that while a direction is forming, it lacks strong conviction across all timeframes.
- Macroeconomic data, particularly US jobs figures and Fed rate expectations, are key catalysts influencing the SP500's correlation with the DXY.
The Bulls' Stronghold: Defending Key Levels
The bulls have managed to keep the S&P 500 afloat, primarily by defending crucial support levels. On the 4-hour chart, the index found solid footing around $6,533.23. This level has been tested and held, preventing a more significant decline and providing a base for the recent recovery. The ability of the market to bounce from this zone suggests underlying buying interest, even as broader sentiment remains cautious. Furthermore, the daily chart shows a more significant support cluster beginning around $6,377.47, indicating that while short-term fluctuations are to be expected, a substantial drop would require breaking through multiple layers of demand. The fact that the index has so far avoided a decisive break below these established support zones is a testament to the bulls' determination to maintain control, or at least prevent a rout.
Technically, several indicators on the shorter timeframes lend credence to the bullish argument for immediate price action. The 1-hour RSI, while approaching overbought territory at 70.95, is still within a range that has historically supported further upside before a significant pullback. The MACD on the 1-hour chart, despite showing negative momentum, is positioned close to its signal line, suggesting that any downward pressure might be temporary. On the 4-hour timeframe, the picture is more constructive: RSI stands at 62.83, comfortably in bullish territory, and the MACD is above its signal line with positive momentum. The Stochastic oscillator on the 4-hour chart is particularly noteworthy, with %K at 97.85 and %D at 86.96, indicating extreme bullishness but not yet showing a bearish crossover. This suggests that while the buying pressure is intense on this timeframe, a reversal could be imminent if the momentum doesn't continue to build.
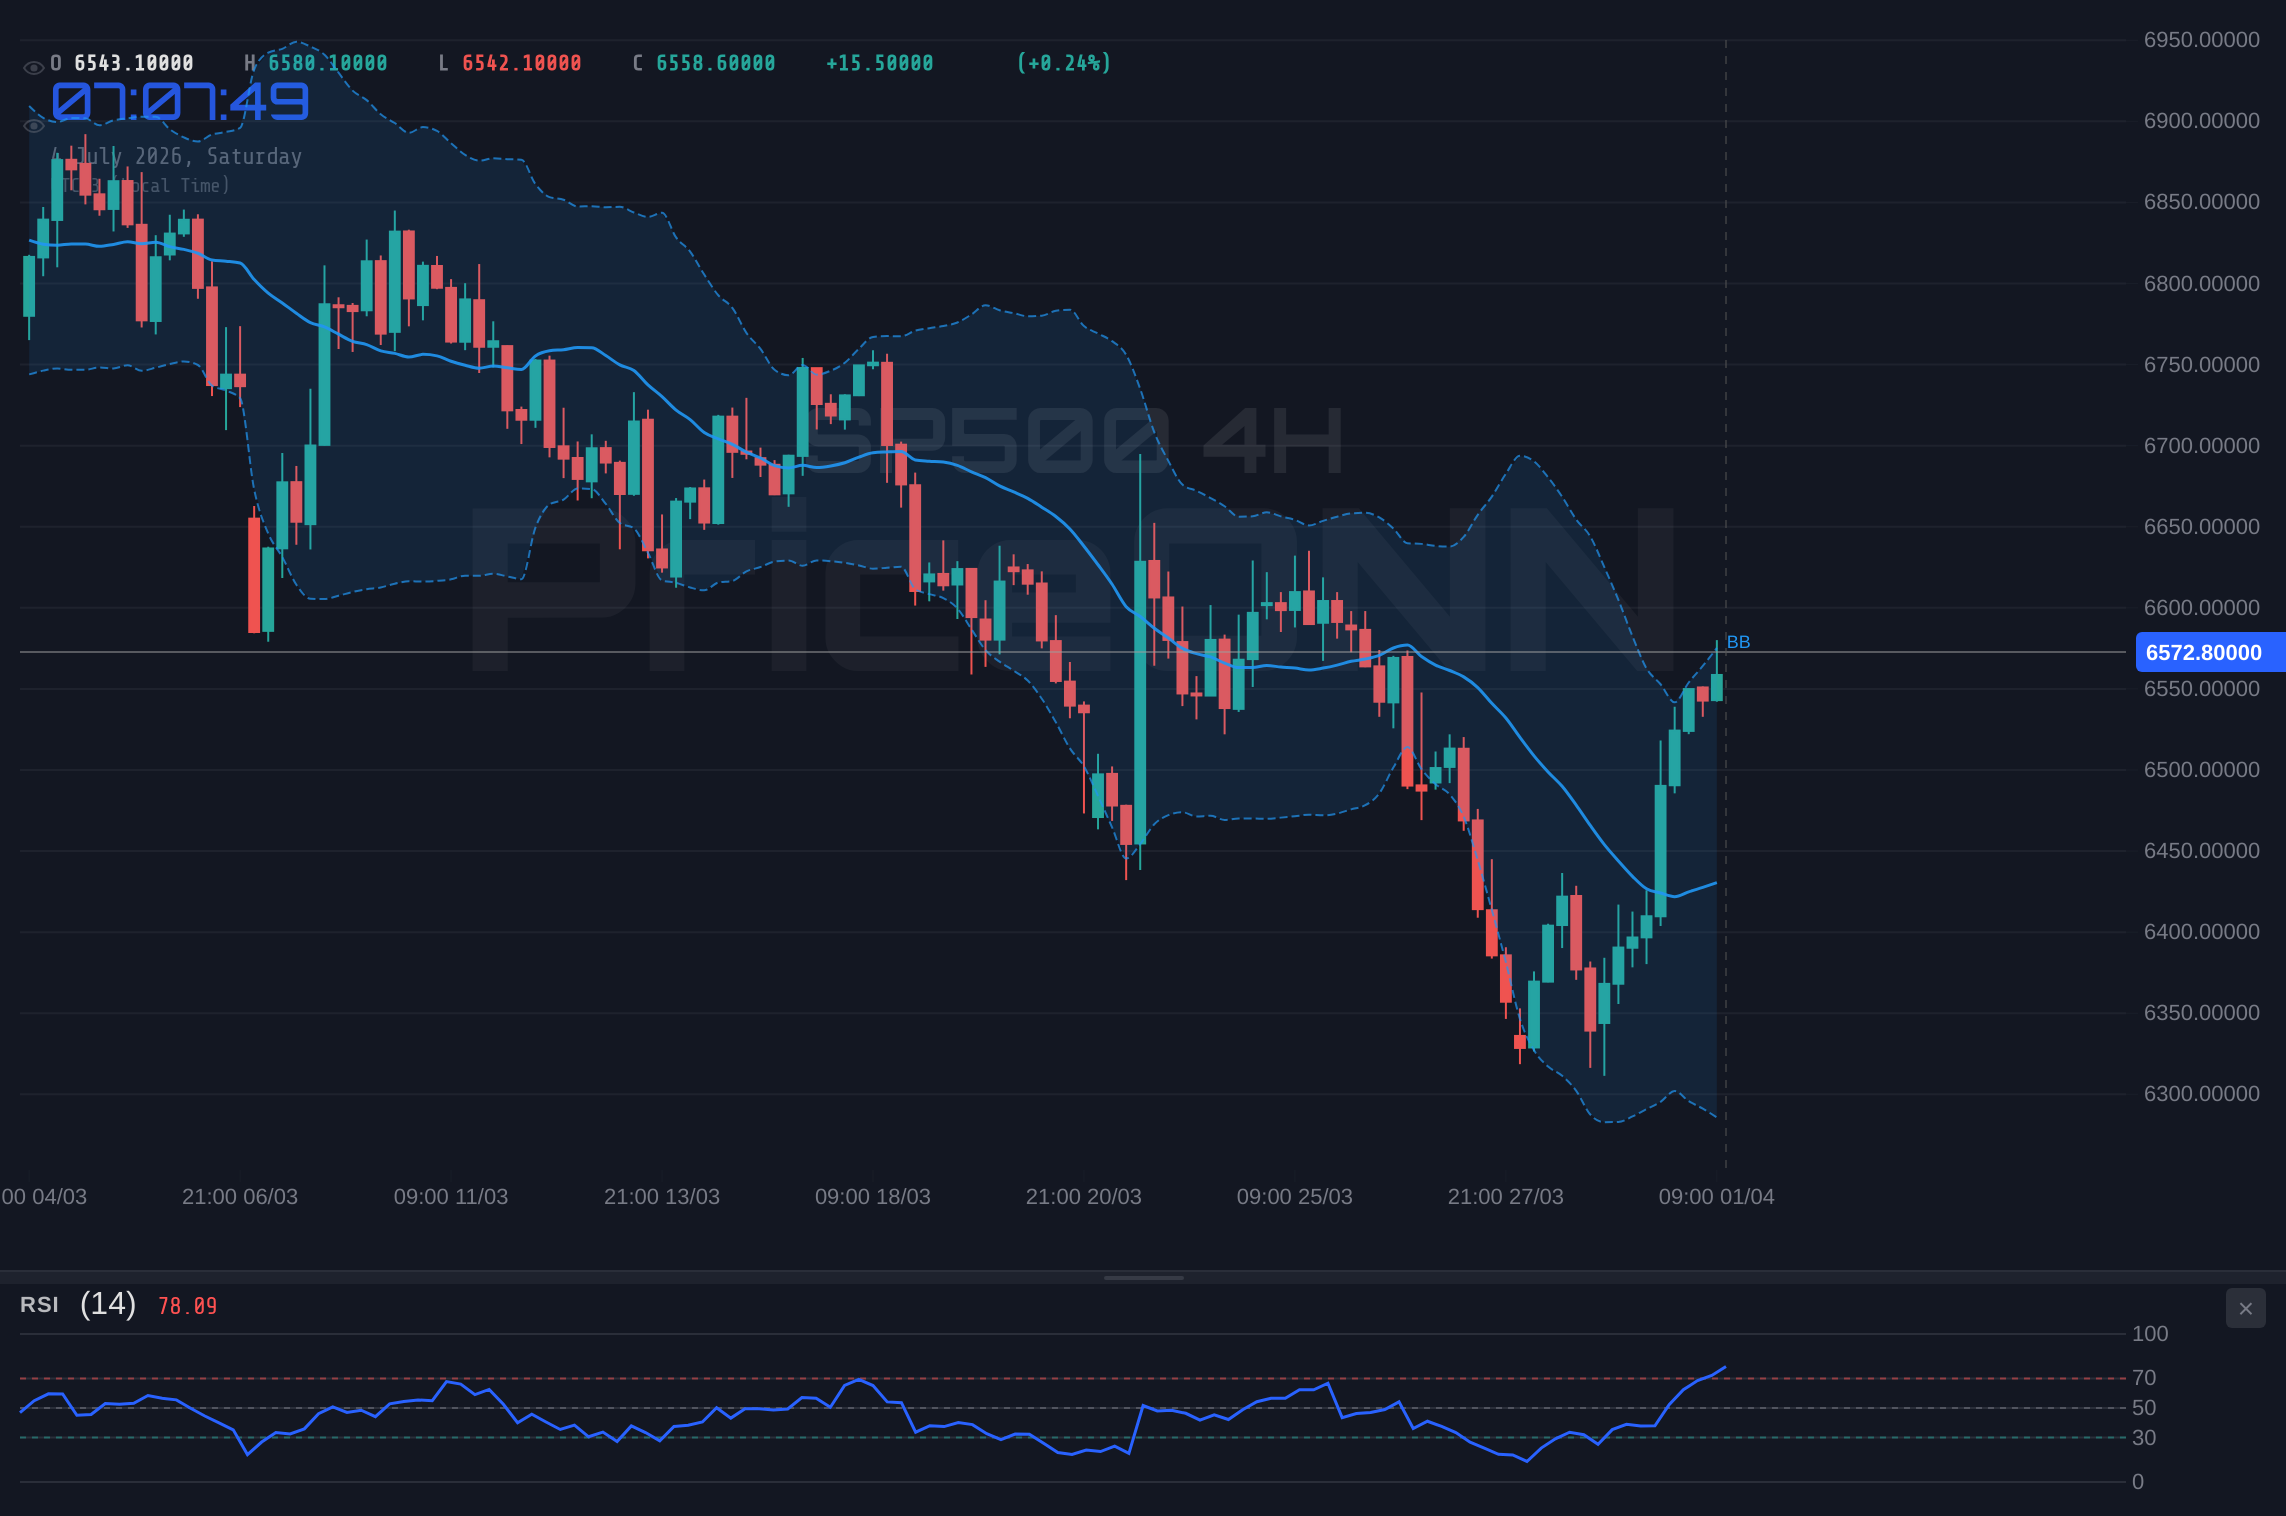
The overall trend strength, as indicated by the ADX, presents a mixed but generally supportive picture for the bulls in the short to medium term. On the 1-hour chart, the ADX is at 49.72, signifying a strong upward trend, albeit one that might be entering overextended territory. The 4-hour ADX at 24.23 suggests a moderate trend, which is often a healthy zone for sustained moves without excessive volatility. However, the daily ADX at 47.51 indicates a strong downward trend, which contradicts the shorter-term bullish signals. This divergence highlights the ongoing battle: while shorter timeframes show strength, the longer-term trend still favors the bears. The bulls' challenge is to convert this short-term strength into a sustained daily uptrend, which would require breaking through key resistance levels and establishing higher lows.
The recent economic data has also provided some succor to the bulls. Cooling US jobs data, as suggested by the July 3rd news mentioning softer US jobs data and lower Fed rate hike odds, can be interpreted as a positive for equities. Lower rate hike odds reduce the cost of capital for businesses and consumers, potentially boosting economic activity and corporate earnings. This narrative allows the market to breathe a sigh of relief, shifting focus away from aggressive monetary tightening towards a more stable economic outlook. The Dow Jones futures climbing on this news further reinforces the idea that risk appetite is returning, a sentiment that typically benefits the broader stock market, including the S&P 500. The ability of the market to digest this data without a significant sell-off is a positive sign for those betting on a continued rally, suggesting that the bulls are finding fundamental justification for their positions.
The Bears' Counterattack: Fading Momentum and Macro Headwinds
Despite the bulls' efforts, the bears are far from defeated. The most significant concern for the bulls is the conflicting signals across different timeframes, particularly the bearish undertones on the daily chart. The daily RSI at 45.35, while not deeply oversold, indicates a downward trend in momentum, suggesting that the recent upward moves might be corrective rather than indicative of a new bull market. The daily MACD is also showing negative momentum, with the MACD line below the signal line, reinforcing the idea that the longer-term trend is still under pressure. This daily picture is a stark contrast to the more optimistic signals seen on the 1-hour and 4-hour charts, raising questions about the sustainability of any current rallies. The bears are likely waiting for a decisive break below the key support levels to confirm their thesis.
The overbought conditions on shorter timeframes, particularly the 1-hour RSI at 70.95 and the 4-hour Stochastic oscillator nearing extreme levels (%K at 97.85), are red flags for the bulls. While these indicators can sometimes extend into overbought territory during strong uptrends, they also signal a heightened risk of a pullback or consolidation. A Stochastic crossover where %K falls below %D, which is already beginning to form on the 1-hour chart (K=65.73, D=73.5), often precedes a short-term reversal. The bears will be looking to capitalize on any profit-taking or forced liquidation that occurs when these shorter-term indicators begin to turn south. This could lead to a sharp snap-back, especially if liquidity thins out, potentially triggering stop-loss orders and accelerating the decline.
The strong daily ADX reading of 47.51 is a critical piece of evidence for the bears. A high ADX value signifies a strong trend, and in this case, it's a downward trend. This suggests that the underlying pressure on the market is still bearish, and any rallies are likely to face significant selling pressure as the trend reasserts itself. The bears’ strategy would be to fade rallies, betting that the strength on shorter timeframes is a temporary anomaly within a larger bearish structure. They will be looking for price to fail at resistance levels, such as the 4-hour resistance at $6,570.63, and then to break decisively below the 4-hour support at $6,533.23. A close below this level on the 4-hour chart would be a significant bearish signal, potentially opening the door for a move towards the daily support levels.
The correlation with the US Dollar Index (DXY) also plays a crucial role. While the DXY saw a slight dip on Friday, its overall strength in recent periods has historically put pressure on assets like the S&P 500. The news on July 2nd regarding USDJPY needing interventions and pushing EURUSD lower, coupled with the general strength of the dollar, suggests that global liquidity might be tightening or risk-off sentiment could resurface. If the DXY starts to climb again, especially with the Fed potentially maintaining a hawkish stance or economic data surprising to the upside, it could easily snuff out the current bullish sentiment in equities. The bears will be watching the DXY closely for any signs of renewed strength as a confirmation of their bearish outlook.
Navigating the Crossroads: Scenarios and Strategy
The current technical setup for the S&P 500 presents a classic bull vs. bear scenario, with conflicting signals across timeframes and a critical battleground at key support and resistance levels. The 4-hour chart offers the most constructive picture for the bulls, showing a moderate trend (ADX 24.23) with RSI in bullish territory (62.83) and MACD positive. However, the daily chart paints a more cautious picture, with a strong downtrend indicated by ADX 47.51 and a bearish MACD signal. The 1-hour chart, while showing bullish momentum, is approaching overbought levels, increasing the risk of a short-term reversal.
The key levels to watch remain the 4-hour support at $6,533.23 and resistance at $6,570.63. A decisive break above the latter, especially with increasing volume and conviction, could signal a continuation of the bullish trend, targeting higher resistance levels. Conversely, a failure to hold $6,533.23 could trigger a sharp sell-off, as bears would likely push towards the daily support levels starting around $6,377.47. The market sentiment is currently delicate, heavily influenced by upcoming economic data and central bank commentary. Any unexpected inflation data or hawkish remarks from the Fed could quickly shift the balance, invalidating bullish setups and reinforcing bearish trends.
Traders must remain vigilant and employ robust risk management strategies. The conflicting signals mean that a breakout strategy, waiting for confirmation after a clear breach of a key level, is likely to be more prudent than trying to anticipate the market's next move. For those looking for bullish continuation, a close above $6,570.63 on the 4-hour chart, confirmed by sustained buying pressure and positive daily momentum, would be the primary trigger. For bears, a break and hold below $6,533.23 on the 4-hour chart would open up significant downside potential. The neutral scenario anticipates continued choppiness around current levels, with potential for a range-bound market until a clearer directional signal emerges from either technicals or macro fundamentals.
Bearish Scenario: Trend Reassertion
55% ProbabilityNeutral Scenario: Consolidation Phase
25% ProbabilityBullish Scenario: Breakout Confirmation
20% ProbabilityThe divergence between the daily bearish trend (ADX 47.51) and the shorter-term bullish signals (4H RSI 62.83, MACD positive) is the core tension. Bulls need to see the daily trend reverse or at least pause, while bears need to break the 4H support at $6,533.23 to confirm their longer-term view.
The Week Ahead: Watching Key Catalysts
Looking ahead, the S&P 500's path will likely be dictated by a confluence of technical factors and macroeconomic events. The upcoming economic calendar will be crucial, particularly any data that influences Federal Reserve policy expectations. While the recent softer US jobs data has eased some pressure regarding rate hikes, any signs of persistent inflation or a surprisingly strong labor market report could quickly reignite hawkish sentiment. This would likely strengthen the US Dollar Index (DXY), which is currently trading around 100.85, and put renewed pressure on equities.
Traders will be closely monitoring the DXY's reaction to any US economic releases. A sustained move above 101.00 could signal a renewed risk-off environment, potentially leading to a sell-off in the S&P 500. Conversely, if the DXY falters and breaks below key support levels, it could provide further tailwinds for the equity market. The correlation between the DXY and major indices like the S&P 500 is a critical element to track; a strengthening dollar often correlates with a weaker stock market, and vice versa.
On the technical front, the S&P 500 must decisively break through the 4-hour resistance cluster around $6,570.63 to confirm a bullish continuation. A sustained move above this level, ideally with strong volume and follow-through buying, would target the next resistance at $6,605.07. Failure to overcome this immediate resistance, however, could lead to a reversal, with bears aiming to break the 4-hour support at $6,533.23. A breach of this level would likely trigger stop-loss orders and accelerate the decline towards daily support zones.
The market structure itself also provides clues. The fact that the S&P 500 has managed to hold key support levels suggests that institutional players may be accumulating positions, anticipating a potential rebound or at least a period of consolidation before the next major move. However, the bearish sentiment on the daily chart, reinforced by the ADX at 47.51, cannot be ignored. This indicates that while short-term trading opportunities might exist on the upside, the longer-term trend remains a significant headwind. Traders should prioritize risk management, employing stop-losses tightly and waiting for clear confirmation before committing to large positions.
The current environment, characterized by mixed technical signals and a sensitive macroeconomic backdrop, calls for a disciplined approach. The bulls need to prove that the strength seen on shorter timeframes can translate into a sustained daily uptrend, breaking key resistance levels and establishing higher lows. The bears, on the other hand, are looking for a failure at current resistance and a decisive break below established support to confirm their bearish thesis. The interplay between these forces, influenced by upcoming economic data and central bank rhetoric, will likely define the S&P 500's performance in the near term.
The divergence between the 1-hour and 4-hour bullish signals (RSI 70.95, Stochastics 97.85) and the daily bearish trend (ADX 47.51, RSI 45.35) highlights the current market indecision. Bulls must overcome the immediate overbought conditions and daily downtrend, while bears need to break through significant 4-hour support at $6,533.23.
Historically, periods of such technical divergence often precede significant market moves as one side eventually gains the upper hand. The strength of the US Dollar Index (DXY), currently around 100.85, remains a critical barometer. A sustained rise in the DXY could easily derail the bullish narrative for equities, especially if it coincides with hawkish Fed commentary. Conversely, any weakness in the dollar, perhaps driven by dovish signals from the Fed or positive economic data from other major economies, could provide a much-needed boost to the S&P 500.
The price action around the 4-hour support at $6,533.23 and resistance at $6,570.63 will be paramount in determining the immediate direction. A clear break and hold above $6,570.63 could open the door for a move towards $6,605.07 and potentially higher. However, failure to hold $6,533.23 would likely trigger a cascade of selling, pushing the index towards the daily support levels, with the first significant zone identified around $6,377.47. Given the conflicting signals, a breakout strategy, waiting for confirmation of a sustained move beyond these key levels, is advisable.
The narrative of the Federal Reserve's monetary policy remains a dominant theme. While recent data has suggested a potential pause in rate hikes, any deviation from this expectation could significantly impact market sentiment. Traders are keenly observing Fed officials' speeches for clues about future policy direction. If the Fed signals a more hawkish stance, citing persistent inflation, it could lead to a strengthening dollar and a sell-off in risk assets like the S&P 500. Conversely, any hint of a more dovish outlook or a pivot could fuel further gains.
The broader correlation with other risk assets is also worth noting. The performance of Nasdaq 100 (currently at 29658.89) and the Dow Jones Industrial Average (at 52840) provides context. While the Nasdaq has shown some bullish signs on shorter timeframes, its daily trend is bearish (ADX 47.51). The Dow Jones, however, shows a stronger bullish trend across multiple timeframes. This divergence within the US equity market adds another layer of complexity, suggesting that not all sectors are moving in lockstep. Investors should pay attention to which indices are leading the market and whether the S&P 500's movements are supported by broader equity strength.
Ultimately, the S&P 500 is at a critical juncture. The bulls have the immediate technical advantage on shorter timeframes, but the longer-term bearish trend on the daily chart, coupled with potential macroeconomic headwinds, presents significant challenges. The price action around the 4-hour support at $6,533.23 and resistance at $6,570.63 will be key determinants of the short-term direction. Patience and strict risk management will be essential for navigating this uncertain environment.
Upcoming economic data releases, particularly any concerning inflation or employment figures, alongside statements from Federal Reserve officials, could introduce significant volatility. Traders should exercise caution and ensure adequate risk management is in place, especially around these key events.
Frequently Asked Questions: S&P 500 Analysis
What happens if the S&P 500 breaks below the 4-hour support at $6,533.23?
A break below the 4-hour support at $6,533.23 would likely invalidate the immediate bullish sentiment and signal a continuation of the daily downtrend. Bears would then target the next significant daily support level around $6,377.47, potentially triggering stop-loss orders and accelerating selling pressure.
Should I buy the S&P 500 at current levels of $6,572.87 given the mixed signals?
Buying at current levels of $6,572.87 carries significant risk due to conflicting signals across timeframes. A more prudent approach would be to wait for confirmation: either a decisive break above 4-hour resistance at $6,570.63 with follow-through, or a clear test and hold of 4-hour support at $6,533.23, ideally with bullish confirmation signals.
Is the RSI at 70.95 on the 1-hour chart a sell signal for the S&P 500?
An RSI reading of 70.95 on the 1-hour chart suggests overbought conditions, which can indicate a potential for a short-term pullback or consolidation. While not a definitive sell signal on its own, it warrants caution for new long positions and suggests that any upward momentum may be temporary until longer-term trends confirm strength.
How will upcoming US jobs data affect the S&P 500 this week?
Softer US jobs data, as hinted at by recent reports, could lower Fed rate hike odds, potentially boosting the S&P 500. Conversely, surprisingly strong data could reignite hawkish Fed expectations, strengthening the DXY and pressuring equities. The market's reaction will depend on whether the data aligns with or deviates from current expectations.
Technical Outlook Summary
| Indicator | Value | Signal | Interpretation |
|---|---|---|---|
| RSI (14) | 62.83 | Bullish | Uptrend momentum on 4H, but nearing overbought on 1H (70.95). |
| MACD Histogram | +0.78 | Bullish | Positive momentum on 4H, but negative on 1H indicates divergence. |
| Stochastic | %K: 97.85, %D: 86.96 | Bearish Crossover Imminent | Extreme overbought on 4H, suggesting a potential reversal soon. |
| ADX | 24.23 | Moderate Trend | Suggests a forming trend on 4H, but daily trend remains strong bearish (47.51). |
| Bollinger Bands | Middle Band Breakout | Bullish | Price holding above the middle band on 4H, indicating upward pressure. |
Key Levels
Track markets in real-time
AI-powered analysis, technical indicators and real-time price data.
Join Our Telegram Channel
Breaking market news, AI analysis and trading signals instantly.
Join Channel