

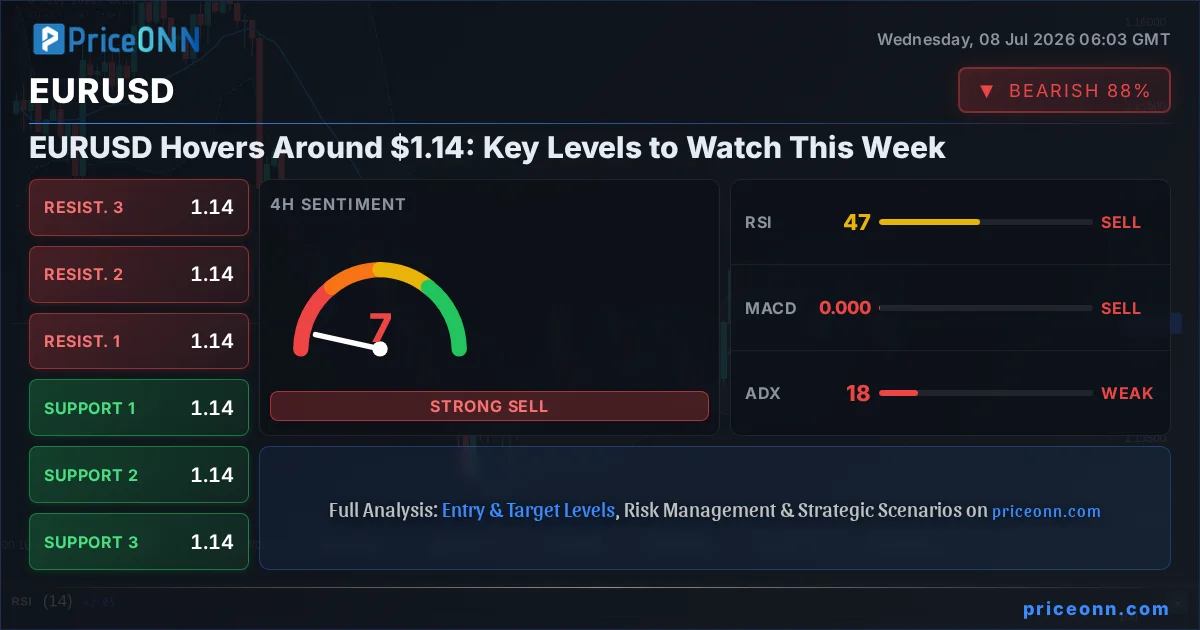
EURUSD is currently navigating a critical juncture, trading around the $1.14 mark. This pivotal price point has become the focal point for traders and analysts alike, as the pair finds itself in a neutral zone, lacking a clear directional conviction. The interplay between the Federal Reserve's hawkish stance and the European Central Bank's own monetary policy tightening has created a delicate balance, leaving EURUSD in a tight range. Understanding the key levels, the conflicting signals from various technical indicators, and the broader macroeconomic backdrop is paramount for anyone looking to navigate this currency pair effectively in the coming days. This analysis aims to dissect the current market sentiment, explore potential scenarios, and highlight the crucial data points that will likely dictate EURUSD's next significant move.
- EURUSD holds steady near $1.14, reflecting a neutral market sentiment across multiple timeframes.
- Critical support is identified at 1.13969, while resistance looms at 1.14362, defining the immediate trading range.
- Conflicting signals from indicators like RSI (41.42, bearish) and Stochastic (K=63.16, bullish) highlight the current indecision.
- The DXY at 101.04 and upcoming Fed minutes are key macro drivers influencing EURUSD's correlation and potential direction.
The Tightrope Walk: EURUSD at $1.14
The EURUSD pair is currently exhibiting a classic 'wait-and-see' attitude, consolidating around the $1.14 level. This price area has become a battleground for bulls and bears, with neither side able to establish firm control. On the 1-hour chart, the trend is neutral with a power score of 50%, a testament to the indecision plaguing the market. Support is found at 1.14108, 1.14080, and 1.14058, while resistance is forming around 1.14158, 1.14180, and 1.14208. These tight levels suggest that any move outside this narrow band could trigger significant volatility. The RSI(14) on this timeframe sits at 49.86, hovering just below the neutral 50 mark, indicating a slight bearish bias. MACD shows positive momentum, but the Bollinger Bands are trading below the middle band, hinting at a potential bearish inclination. However, the Stochastic oscillator, with K at 75.55 and D at 84.17, is flashing a bearish signal, suggesting that while the price might be consolidating, the underlying momentum could be shifting downwards. This mixed bag of signals on the shorter timeframe underscores the current uncertainty.
Diving deeper into the 4-hour timeframe, the neutrality persists, though the power score remains at 50%. Here, support levels are more defined at 1.13995, 1.13919, and 1.13844, with resistance capping the upside at 1.14146, 1.14221, and 1.14297. The RSI(14) dips to 46.55, reinforcing the bearish sentiment observed on the hourly chart, and suggesting a downward pressure is building. MACD is firmly in negative momentum territory, with the MACD line below its signal line, indicating that sellers are gaining traction. The Bollinger Bands are above the middle band, which might seem counterintuitive given the bearish RSI and MACD, but it could also signal that the price is consolidating within an upward-sloping channel on a slightly longer timeframe, albeit with waning strength. The Stochastic oscillator is at K=19.18 and D=43.42, presenting a clear bearish signal as %K falls below %D, and indicating oversold conditions that could precede a bounce, but the overall trend strength, measured by ADX at 17.59, is weak, suggesting choppy, range-bound trading is more likely than a strong directional move.
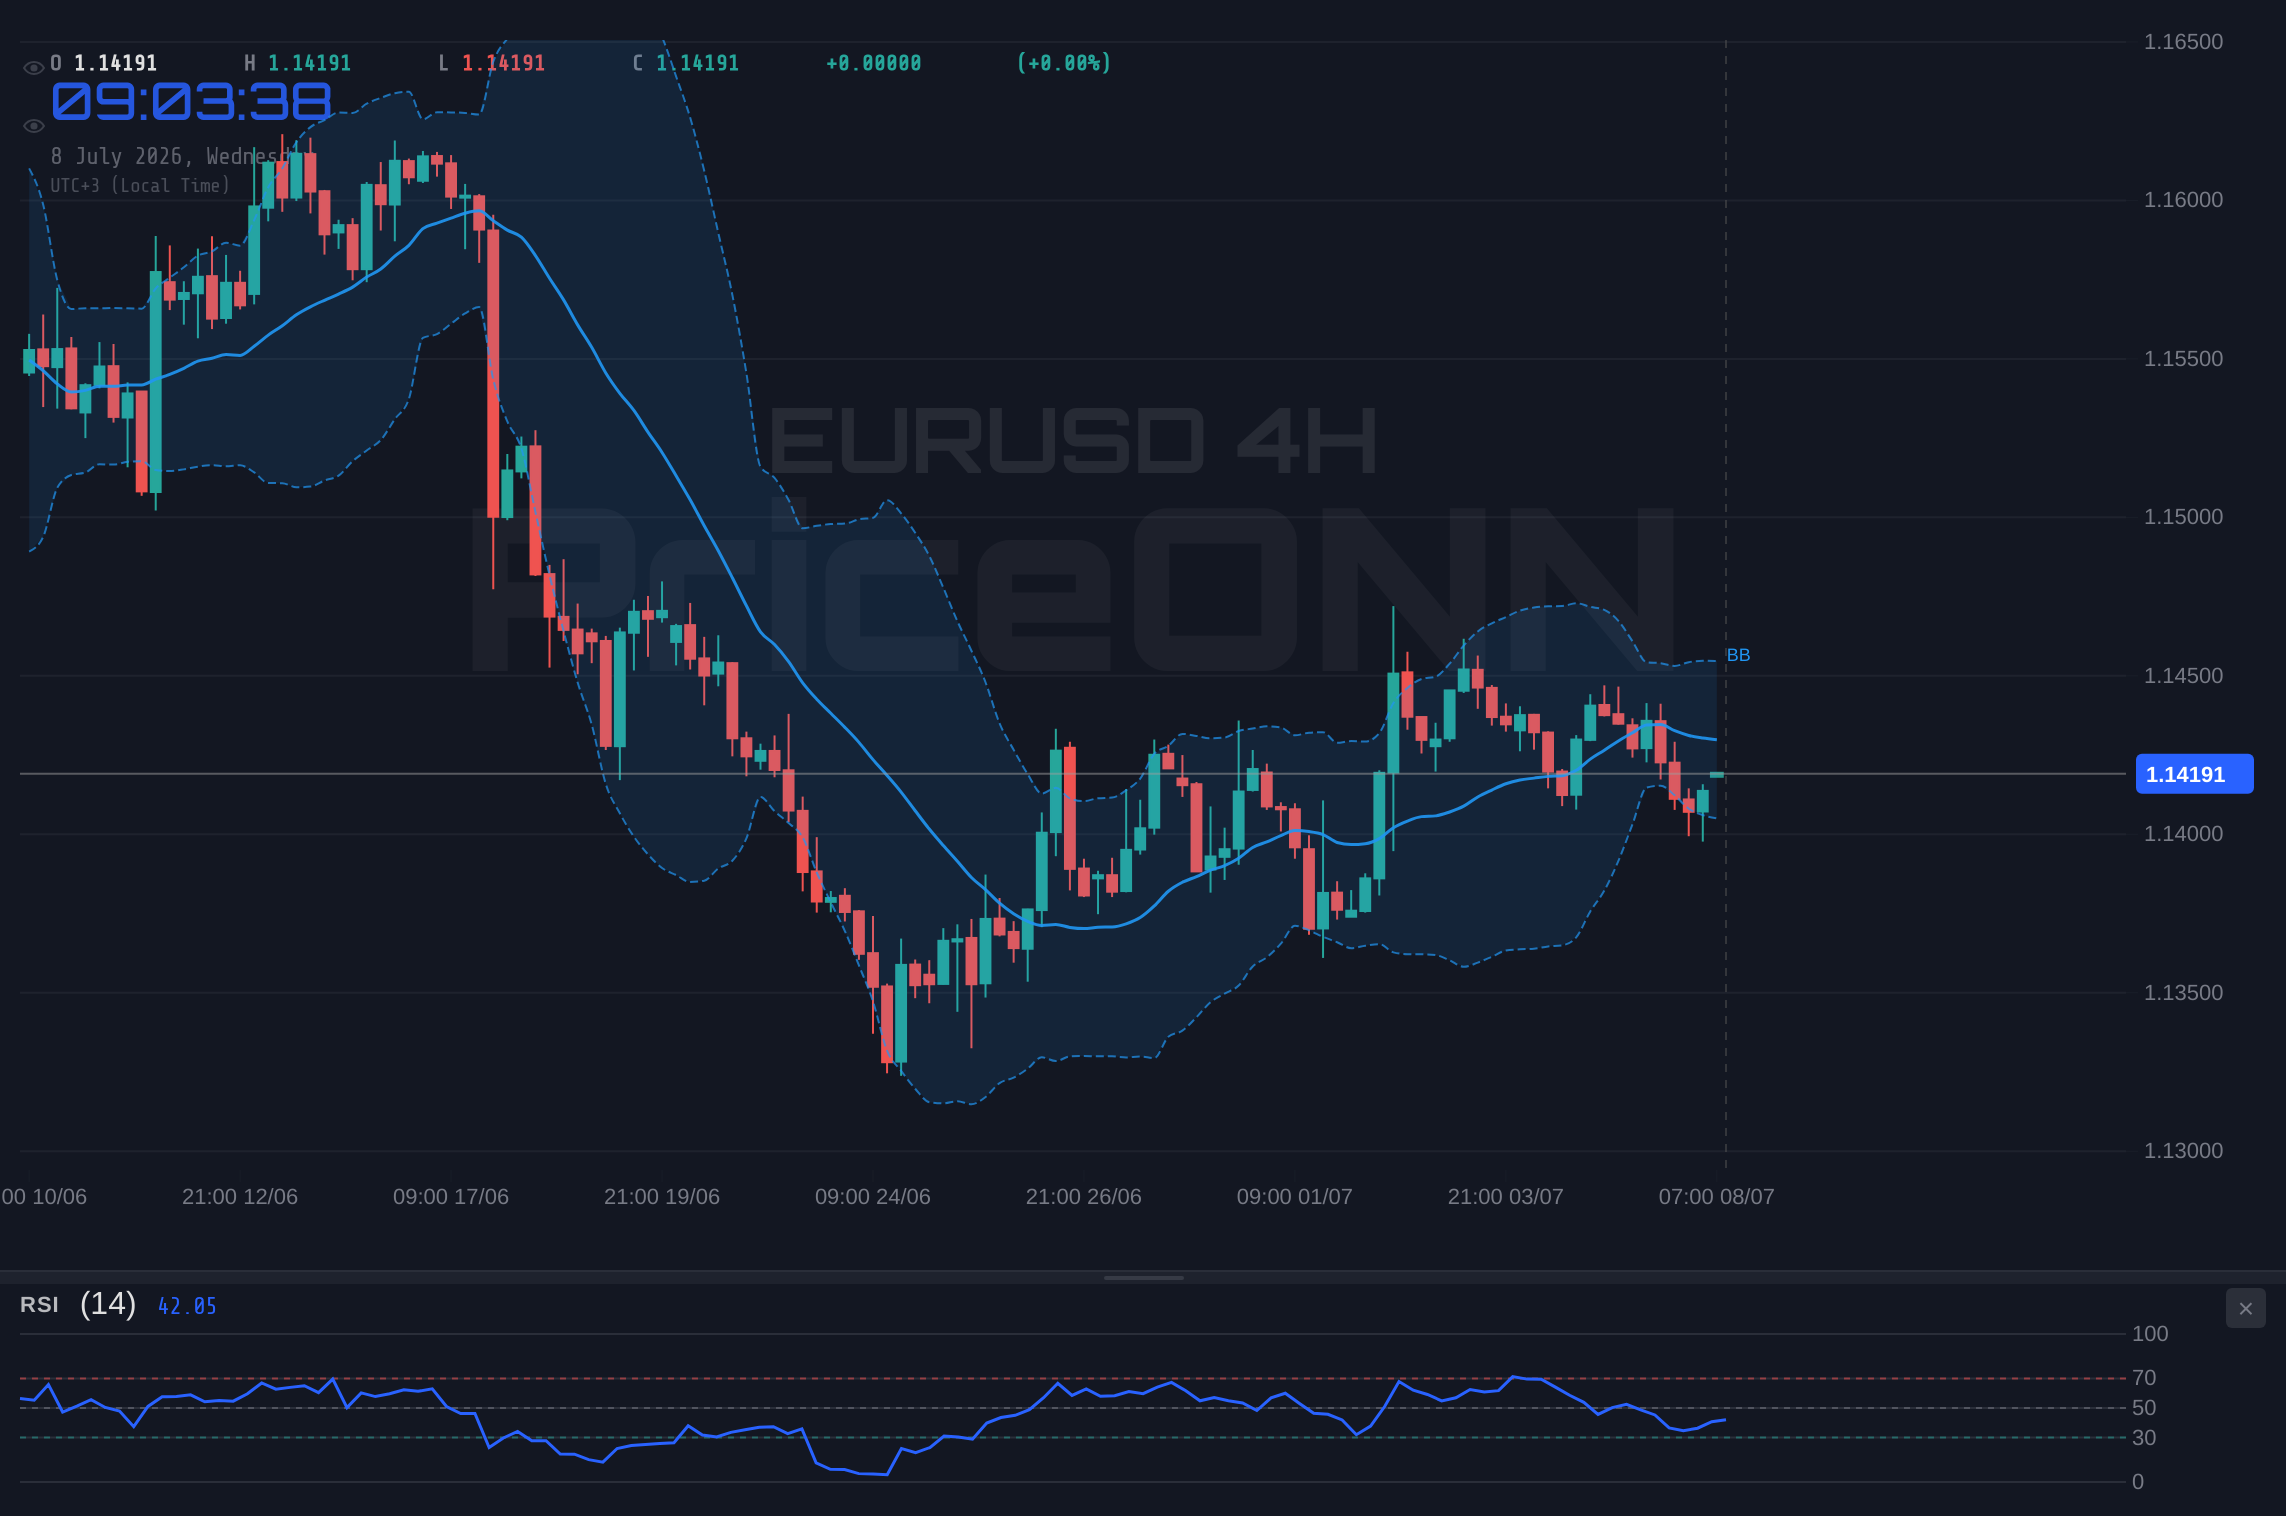
The daily chart for EURUSD paints a more complex picture. While the overall trend is classified as neutral with a 50% power score, the ADX at 32.1 indicates a strong underlying trend, albeit one that is currently directionless or in a state of flux. Support is found at more significant levels: 1.13969, 1.13827, and 1.13576. Resistance is also more robust, situated at 1.14362, 1.14613, and 1.14755. The RSI(14) is at 41.42, continuing the bearish lean seen across the shorter timeframes, suggesting that sellers have more room to maneuver before entering oversold territory. MACD, however, shows positive momentum with the MACD line above its signal line, a divergence from the hourly and 4-hour charts. This could be a sign of underlying strength or a lagging indicator. The Bollinger Bands are below the middle band, aligning with the bearish RSI. Stochastic, on the other hand, offers a bullish divergence, with K at 63.16 and D at 59.46, indicating a potential upward move as %K crosses above %D and enters the upper half of the oscillator's range. This conflict between the RSI and Stochastic on the daily chart is a key reason for the pair's current neutral stance; it suggests that while short-term pressures might be bearish, there's potential for a recovery if certain conditions are met.
Correlation and Context: The Dollar's Shadow
The performance of EURUSD is inextricably linked to the movements of the US Dollar Index (DXY). Currently, the DXY is trading at 101.04, showing a slight daily decrease of 0.01%. On the 1-hour chart, the DXY exhibits a bullish trend with 88% power, supported by RSI at 57.24 and a MACD showing positive momentum. However, its Stochastic oscillator is in a bearish crossover (K=54.89, D=70.65), and the ADX at 25.13 indicates a strong trend. The 4-hour chart shows a neutral trend for the DXY (50% power), with RSI at 52.69 and positive MACD momentum, but a bullish Stochastic crossover (K=77.01, D=50.62). The daily DXY shows a neutral trend (50% power), with RSI at 60.38 and a bearish Stochastic crossover (K=38.17, D=40.14). This mixed picture for the DXY itself adds another layer of complexity to the EURUSD outlook. Generally, a stronger dollar (higher DXY) tends to pressure EURUSD downwards, and vice versa. The current subtle weakness in the DXY might be offering some marginal support to EURUSD, but the overall trend for the dollar appears to be consolidating, mirroring the EURUSD's own neutral stance.
Beyond the dollar's immediate movements, broader market sentiment plays a crucial role. The S&P 500, a key indicator of risk appetite, is currently trading at 6572.87, showing a significant daily increase of 0.74%. On its 1-hour chart, the S&P 500 displays a strong bullish trend (100% power), with RSI at 70.95 nearing overbought territory. The MACD shows negative momentum, contrasting with the overall price action, while Stochastic is in a bearish crossover (K=65.73, D=73.5). The daily S&P 500, however, shows a bearish trend (100% power) with RSI at 45.35. This divergence between intraday strength and daily weakness in the S&P 500 suggests that while there's short-term optimism, the broader equity market might be facing headwinds. A decline in risk appetite, signaled by a drop in the S&P 500 and Nasdaq, typically leads to increased demand for safe-haven assets, potentially benefiting the dollar and weakening EURUSD. Conversely, a sustained rally in equities could support riskier currencies and put upward pressure on EURUSD. The current mixed signals from US equities add to the ambiguity surrounding EURUSD's direction.
Geopolitical tensions and central bank communications are also significant drivers. Recent news indicates that the Federal Reserve and the European Central Bank are both maintaining hawkish tones, a factor that has kept EURUSD in a tight range. The ECB's June rate hike, though perhaps priced in, underscores their commitment to fighting inflation. Meanwhile, market participants are eagerly awaiting the upcoming Fed minutes. These minutes will likely provide deeper insights into the Fed's future monetary policy path, particularly concerning interest rate decisions. Any hints of further tightening or a shift in forward guidance could significantly impact the dollar and, consequently, EURUSD. The recent cooling of the US labor market, as suggested by softer payrolls data, might temper the Fed's hawkishness, but the overall inflationary pressures remain a concern for both central banks. This delicate balancing act between inflation control and economic growth concerns will continue to dominate market narratives and influence currency movements.
The Bull's Roadmap: A Path to Higher Ground
The Bull's Roadmap: A Path Above $1.14
25% ProbabilityFor EURUSD to embark on a sustained upward journey, several conditions must be met. The immediate hurdle is the resistance cluster around 1.14146 to 1.14362. A break above the daily resistance at $1.14362 would be the primary trigger. This move would need to be confirmed by increased trading volume and positive divergences across indicators like the RSI and Stochastic on the daily timeframe. Currently, the daily RSI is at 41.42, and Stochastic is showing a bullish crossover, which could set the stage for such a move if momentum builds. A successful breach of $1.14362 would likely see the pair target the next resistance at $1.14613, a level that previously acted as a ceiling. Further upside could then extend towards $1.14755. This scenario is contingent on a weakening dollar and a positive shift in broader market sentiment, perhaps driven by dovish signals from the Fed or stronger-than-expected economic data from the Eurozone. However, given the current neutral signals and conflicting indicators, this bullish path appears less probable in the short term, carrying only a 25% probability.
Where Bears Take Control: A Descent Below $1.14
Where Bears Take Control: A Descent Below $1.14
65% ProbabilityThe path of least resistance for EURUSD appears to be downwards, at least in the short to medium term. The prevailing bearish sentiment across the 1-hour and 4-hour charts, with RSI readings below 50 and bearish MACD signals, lends credence to this view. The trigger for a bearish move would be a decisive break below the daily support at $1.13969. This level has acted as a floor previously, and a failure to hold it could lead to a cascade of stop-losses, accelerating the decline. Confirmation would come from increasing bearish momentum on the MACD and a continued downward trend in the RSI. If this level gives way, the first target would be $1.13827, a previous significant support. A break below this could then open the door for a move towards $1.13576. This scenario is supported by the current correlation with a potentially strengthening dollar, especially if upcoming Fed minutes signal a more hawkish path than anticipated. The weak trend strength indicated by ADX on shorter timeframes suggests that any downward move might be choppy, but the overall technical picture leans bearish, giving this scenario a 65% probability.
The Waiting Game: Consolidation Around $1.14
The Waiting Game: Consolidation Around $1.14
10% ProbabilityWhile less probable given the conflicting signals and strong ADX readings on some timeframes, a prolonged period of consolidation cannot be entirely ruled out. This neutral scenario would see EURUSD continue to trade within its established range, likely between the key support at $1.13969 and resistance at $1.14362. Such a scenario would typically unfold if upcoming economic data fails to provide a clear directional impetus, or if market participants adopt a cautious approach ahead of major events like the FOMC minutes. In this 'waiting game,' price action might oscillate around the $1.14146 to $1.14208 levels, reflecting the indecision. This outcome is less likely (assigned a 10% probability) because the strong ADX readings on daily and hourly charts suggest a directional move is more probable than a sustained period of low volatility and tight range trading. However, if key macro releases surprise to the downside for the dollar or provide mixed signals from the Eurozone, this sideways chop could persist.
What I'm Watching: Key Triggers for EURUSD
The market is currently at a crossroads, and several key factors will dictate EURUSD's next move. First and foremost, the upcoming FOMC Meeting Minutes are critical. Any indication of a shift in the Fed's stance on future rate hikes, particularly regarding their persistence in fighting inflation or any hints towards a pause, will likely cause significant volatility. Traders will scrutinize the language for clues about the path of interest rates, which will directly impact the DXY and, by extension, EURUSD. Pay close attention to any mentions of economic data, inflation trends, and the overall balance of risks.
Secondly, the DXY's reaction to these minutes and any other dollar-specific news will be paramount. While currently showing a mixed picture across timeframes, a decisive move by the DXY above its immediate resistance levels (around 101.15 on the 4H) or a fall below its support (around 101.02 on the 1H) could provide a strong directional cue for EURUSD. A strengthening DXY would likely exert downward pressure on the pair, while a weakening dollar could offer support.
Finally, I'll be watching the price action around the key levels of $1.13969 (support) and $1.14362 (resistance) on the daily chart. A clear break and sustained close beyond either of these levels, especially with confirming volume and indicator signals, will signal the likely direction for the next leg of the trade. The divergence between the daily RSI and Stochastic currently adds intrigue; a confirmation of the Stochastic's bullish signal through price action would support a move higher, while a failure to do so and a continued bearish lean from the RSI would favor a move lower. The interplay between these technical levels and the fundamental catalysts will be the key to unlocking the next significant move in EURUSD.
| Indicator | Value | Signal | Interpretation |
|---|---|---|---|
| RSI (14) | 41.42 | Bearish | Suggests downward pressure, room to fall before oversold. |
| MACD Histogram | -0.00093 | Bearish | Negative momentum indicates sellers are in control. |
| Stochastic | K:63.16, D:59.46 | Bullish | Bullish crossover in neutral zone, potential for upside. |
| ADX | 32.1 | Strong Trend | Indicates a strong trend, but direction is unclear from other indicators. |
| Bollinger Bands | Middle Band | Neutral | Price is trading below the middle band, suggesting bearish bias. |
Bearish Scenario: The Path to $1.13576
65% ProbabilityBullish Scenario: A Break Above $1.14362
25% ProbabilityNeutral Scenario: Range-Bound Action
10% ProbabilityFrequently Asked Questions: EURUSD Analysis
What happens if EURUSD breaks below the $1.13969 support level?
A decisive break below the $1.13969 support, confirmed by daily close and bearish momentum, would likely trigger a move towards $1.13827, the next key support. This scenario carries a 65% probability given current technical indicators.
Should I consider buying EURUSD at current levels of $1.14 given the mixed signals?
Buying EURUSD at current levels of $1.14 is a high-risk proposition due to conflicting indicators and a neutral market sentiment. A bullish trigger would be a close above $1.14362, with targets at $1.14613, but this scenario only has a 25% probability.
Is the RSI at 41.42 a sell signal for EURUSD this week?
An RSI reading of 41.42 on the daily chart does indicate a bearish bias, suggesting downward pressure. While not yet in oversold territory, it aligns with the more probable bearish scenario targeting $1.13827.
How will the upcoming Fed minutes affect EURUSD around the $1.14 level?
The Fed minutes are a critical catalyst. Hawkish commentary could strengthen the dollar, pushing EURUSD below $1.13969, while dovish signals might support a move towards $1.14362 resistance.
The EURUSD pair is currently in a state of equilibrium, hovering around the $1.14 mark. While short-term indicators lean bearish, the conflicting signals on the daily chart and the broader macroeconomic uncertainty prevent a clear directional bias. The market is keenly awaiting the release of the FOMC meeting minutes, which are expected to provide crucial insights into the future path of US monetary policy. Any hint of a policy shift from the Federal Reserve could be the catalyst needed to break EURUSD out of its current neutral zone. Until then, traders should exercise caution and focus on the key support at $1.13969 and resistance at $1.14362. Patience and disciplined risk management will be key to navigating this period of consolidation. The market always offers opportunities; the key is to wait for the setup to align with your strategy, whether that involves a breakdown below support or a breakout above resistance.
Track markets in real-time
AI-powered analysis, technical indicators and real-time price data.
Join Our Telegram Channel
Breaking market news, AI analysis and trading signals instantly.
Join Channel