

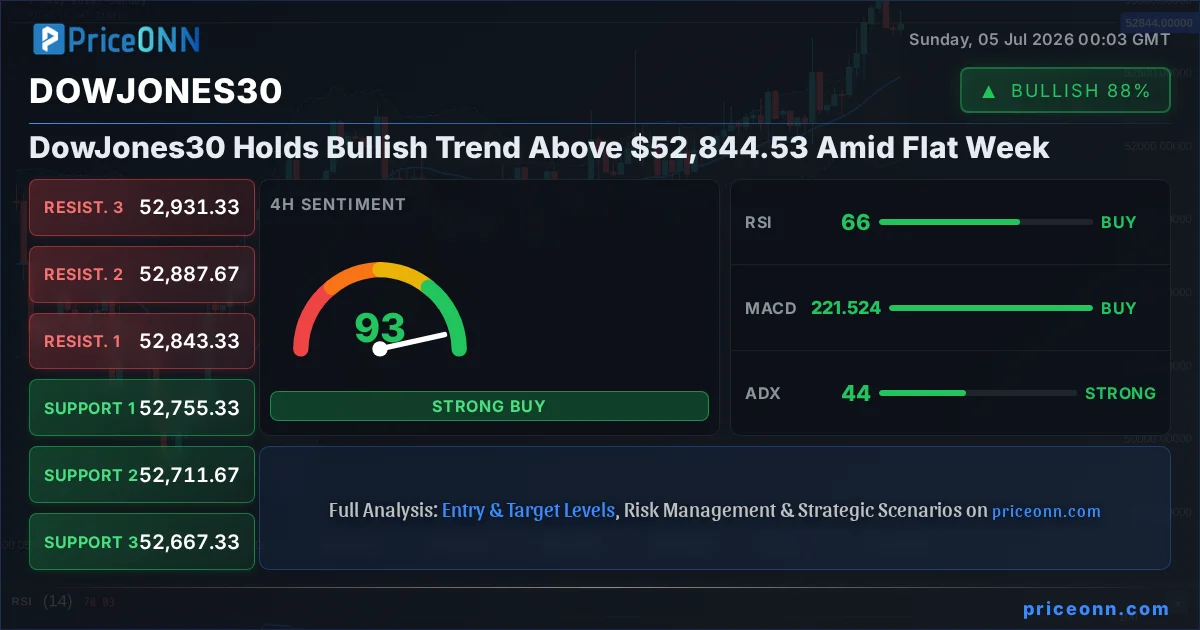
This past week has been a peculiar one for the Dow Jones Industrial Average (DJIA), characterized by a distinct lack of directional conviction. Trading largely sideways, the index hovered around the critical $52,844.53 mark, offering little clarity for traders anticipating a significant move. However, a closer look at the underlying technicals reveals that despite the choppiness, the broader bullish trend remains stubbornly in place. This flat week, while seemingly uneventful, has set the stage for potential developments as we look towards the next trading period. The interplay between key support levels holding firm and resistance areas being tested, albeit without a decisive breakout, paints a picture of consolidation within a larger upward trajectory.
- The DowJones30 is consolidating around $52,844.53, showing a flat week with limited volatility.
- Critical support at $52,755.33 held firm, preventing a bearish breakdown and reinforcing the bullish trend.
- RSI(14) at 65.55 on the 4H chart indicates a strong upward trend, though nearing overbought territory.
- MACD histogram shows positive momentum on the 4H chart, aligning with the bullish outlook.
- The DXY at 100.82 is showing a slight bearish bias, which could offer some tailwind to risk assets like the Dow Jones.
Navigating the Sideways Squeeze: DowJones30's Technical Landscape
The 4-Hour Chart: A Tale of Consolidation
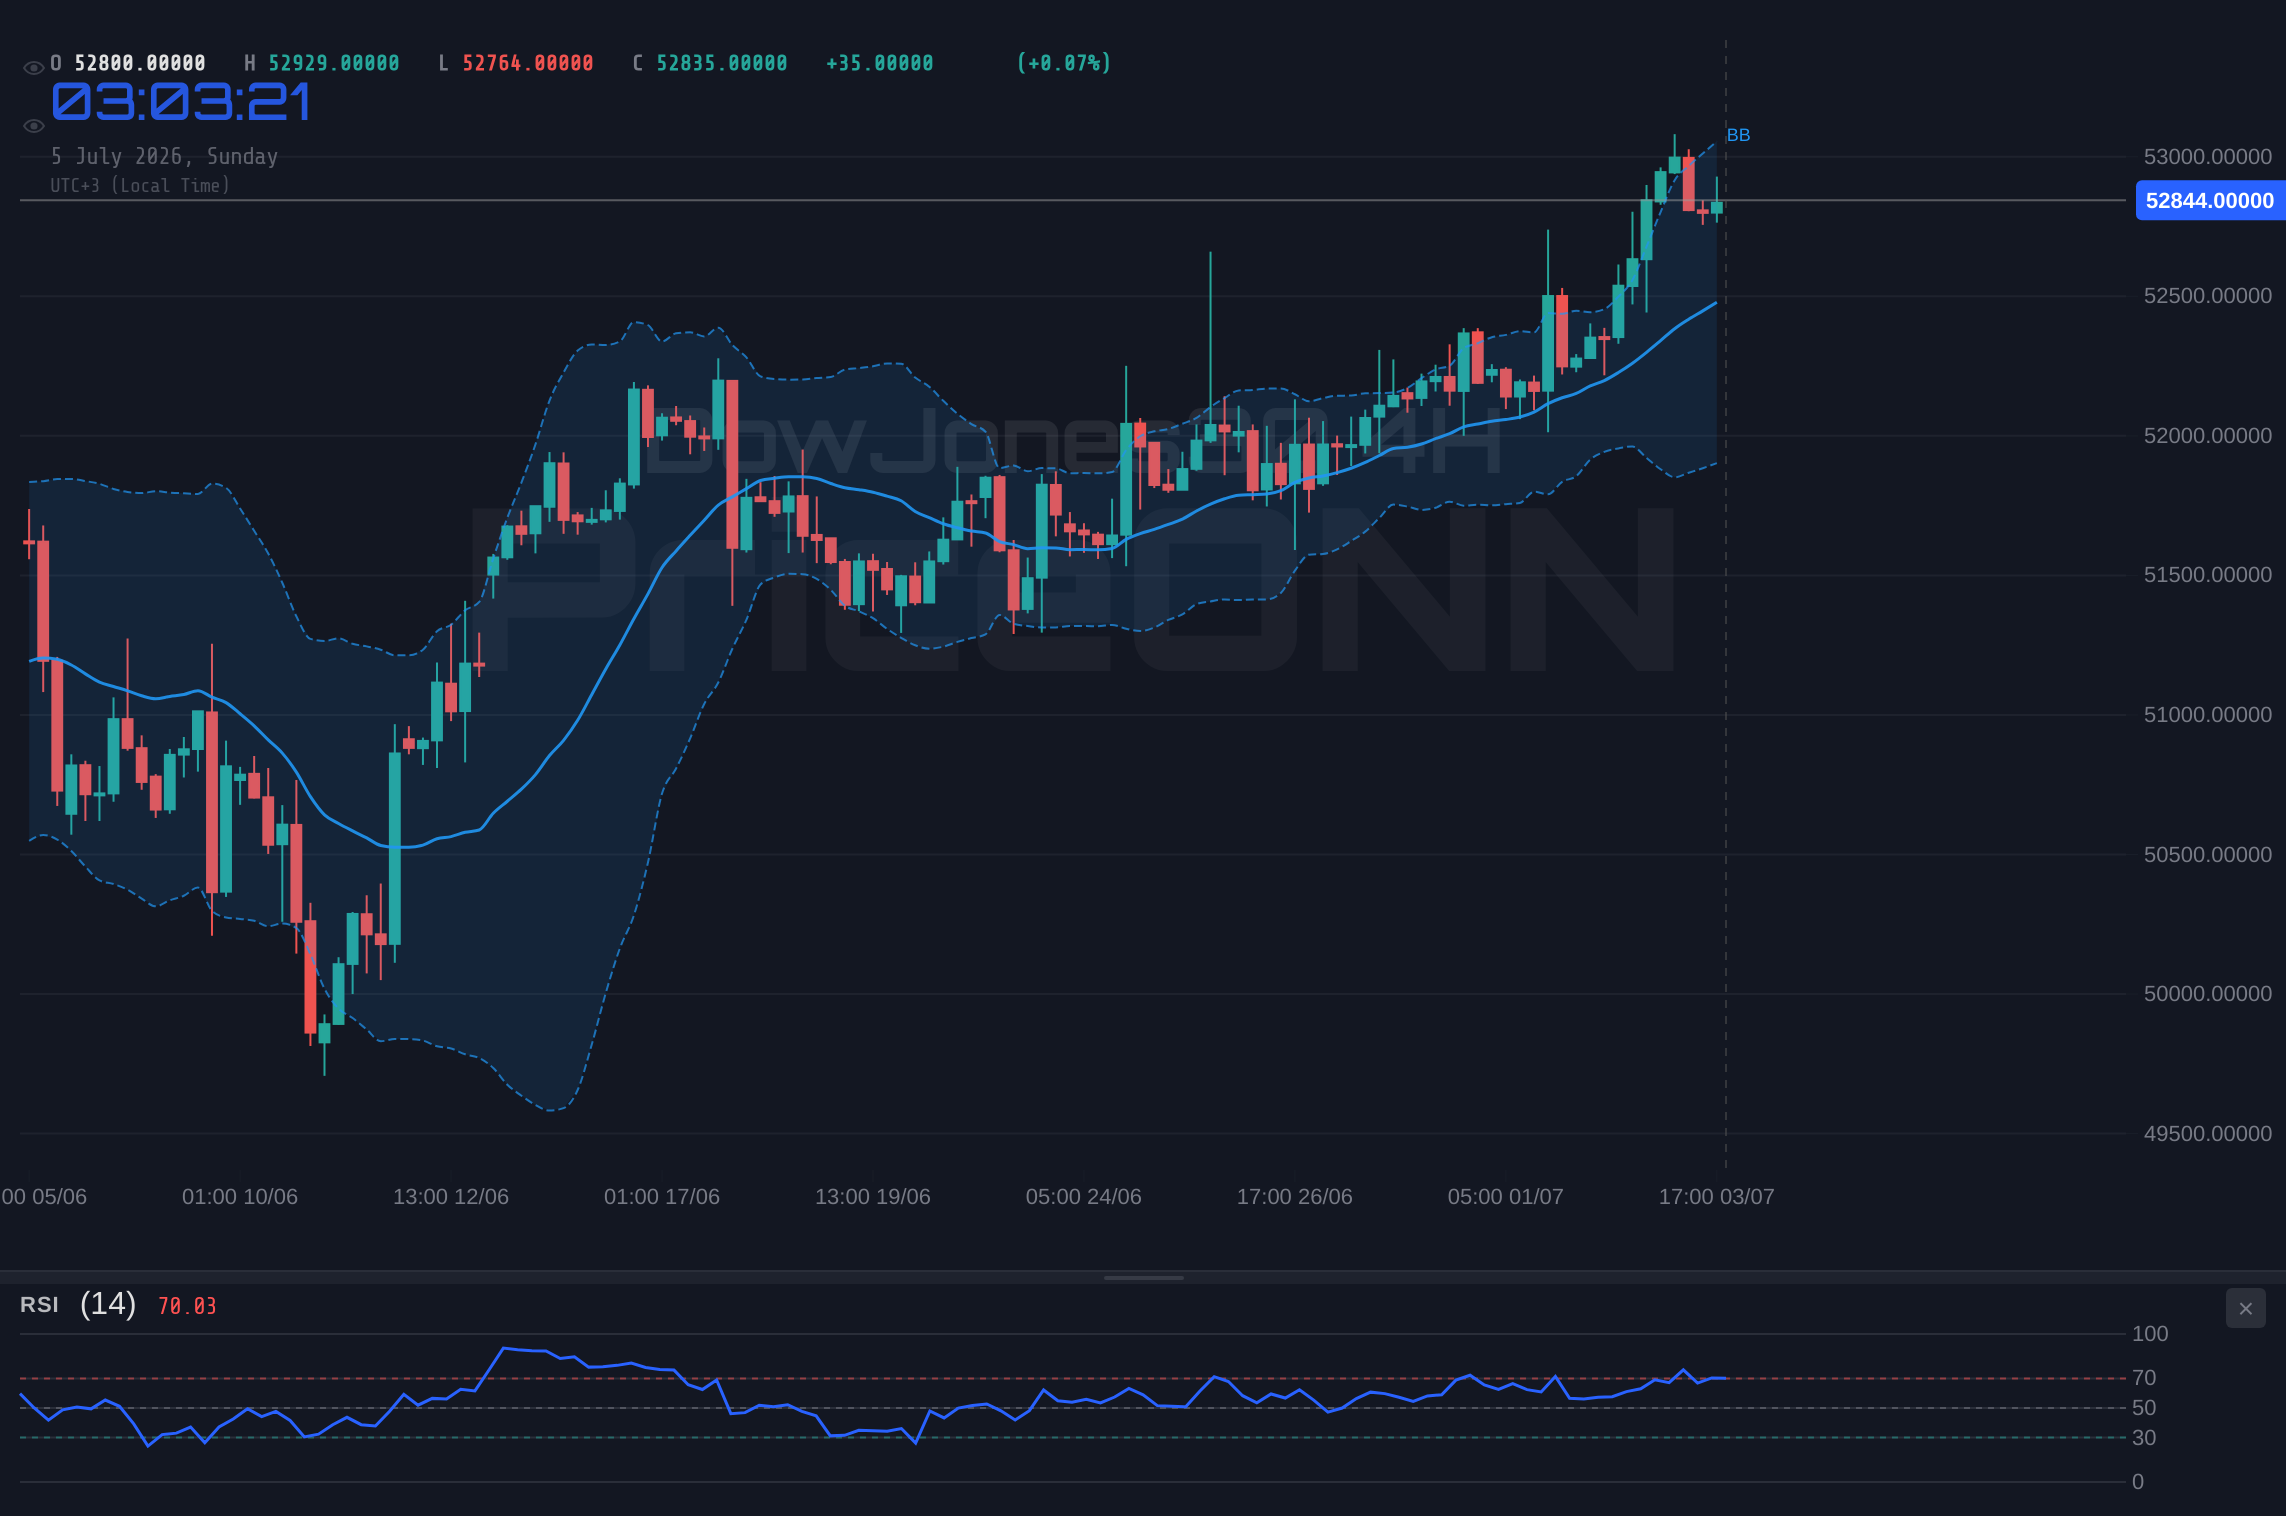
Examining the 4-hour chart for the Dow Jones Industrial Average ($52,844.53), we see a market in a state of equilibrium, at least for the past week. The index has been oscillating within a relatively tight range, with prices consistently finding support above the $52,755.33 level and facing resistance near $52,843.33. This pattern is indicative of a market pause, where neither the bulls nor the bears have managed to seize decisive control. The ADX at 43.74 on this timeframe confirms a strong trend is in play, but the sideways price action suggests this trend is currently consolidating rather than advancing aggressively. It’s a classic case of “coiling,” where energy is building up for a potential breakout in either direction. The resilience shown at the support levels is particularly noteworthy; a failure to hold these areas would have signaled a significant shift in sentiment, but they have so far acted as a reliable floor.
The RSI(14) on the 4-hour chart sits at 65.55, firmly in bullish territory but not yet in the extreme overbought zone. This reading suggests that while upward momentum is present, there is still room for price appreciation before sellers might step in aggressively. Coupled with the MACD histogram showing positive momentum, the technical indicators on this timeframe lean towards a continuation of the bullish trend, albeit with the caveat of the current consolidation. The Stochastic Oscillator, however, presents a slightly mixed signal. With the %K line at 69.5 and the %D line at 82.72, it indicates a bearish crossover in the overbought region, suggesting a potential short-term pullback or at least a cooling-off period is possible before any significant upward move. This divergence between the RSI and Stochastic warrants careful observation; it highlights the indecision present in the market at these price points.
Daily Timeframe: The Trend Remains Unchanged
Shifting our focus to the daily chart, the Dow Jones Industrial Average ($52,844.53) continues to paint a picture of a robust upward trend. The index closed last Friday well above key support levels, demonstrating underlying strength. The daily ADX at 30.24 still signifies a strong uptrend, reinforcing the idea that the recent consolidation is merely a pause within a larger bullish cycle. The price action has consistently respected the upward channel, with higher highs and higher lows being printed over recent weeks. This longer-term perspective is crucial; it suggests that the sideways movement observed on the shorter timeframes is more likely a healthy correction or a period of accumulation rather than a reversal of fortune for the bulls.
On the daily chart, the RSI(14) is at 67.98, reflecting strong bullish sentiment without being excessively overbought. This level suggests ample room for further upside potential. The MACD is also in positive territory, with the histogram above the signal line, further confirming the strength of the prevailing uptrend. The Stochastic Oscillator, with %K at 83.19 and %D at 64.48, shows a bullish crossover in the overbought zone, indicating that upward momentum could continue, although it might be entering a phase where caution is advised due to the elevated readings. Bollinger Bands on the daily chart are also hugging the upper band, indicating strong upward pressure. This confluence of indicators on the daily timeframe provides a solid foundation for the bullish thesis, suggesting that any short-term choppiness is unlikely to derail the primary trend without significant fundamental shifts.
The Influence of the Dollar and Equities
DXY's Subtle Shift and its Implications
The US Dollar Index (DXY) is currently trading around 100.82, showing a slight downward bias for the week. While not a dramatic fall, this subtle weakness in the dollar can often translate into a supportive factor for risk assets like the Dow Jones Industrial Average ($52,844.53). Historically, there's an inverse correlation between the DXY and major equity indices; as the dollar weakens, it can make US equities relatively more attractive to international investors, potentially driving demand. On the 1-hour chart, the DXY shows a bearish trend with RSI at 47.34 and MACD in positive territory but below the signal line, suggesting continued pressure. The 4-hour chart, however, presents a more mixed picture with RSI at 40.39 and a bullish Stochastic signal, indicating potential for a bounce. Nevertheless, the prevailing sentiment from the DXY data suggests that the dollar is not currently providing a strong headwind for the Dow Jones, and any further weakening could offer a tailwind.
The daily chart for the DXY shows a different story, with RSI at 57.43 and a bullish Stochastic signal. This suggests that while short-term weakness might persist, the longer-term trend for the dollar could still be in an upward phase. This divergence in signals across timeframes for the DXY mirrors the indecision seen in the Dow Jones itself. The key takeaway here is that the dollar is not a strong opposing force at the moment. If the DXY were to experience a more significant decline, it could provide the catalyst needed for a stronger upward move in the Dow Jones, especially if it breaks above its immediate resistance levels. Traders are watching the DXY closely as a barometer for global risk sentiment and its potential impact on US equity markets.
Equity Market Correlations: SP500 and Nasdaq
The performance of the broader equity market, as represented by the S&P 500 and Nasdaq 100, provides crucial context for the Dow Jones Industrial Average ($52,844.53). The S&P 500 has shown a bullish trend, trading around 6572.87 with a strong daily ADX of 47.51 indicating a powerful downward trend on the daily chart, despite a recent 0.74% daily gain. This suggests that the overall market sentiment remains cautious, with significant underlying bearish pressure. The Nasdaq 100, currently at 29658.74, also exhibits mixed signals, with a strong upward move on the 1-hour chart but a bearish trend indicated on the daily timeframe (ADX 16.7). This divergence within the equity space suggests that while individual indices might be showing pockets of strength, the broader market sentiment is not unequivocally bullish.
The fact that the Dow Jones is holding its ground while other indices show more pronounced bearish trends on longer timeframes could indicate a rotation into more defensive or value-oriented stocks, which are typically represented in the Dow Jones. Alternatively, it could be a sign of temporary strength before a broader market decline. The ADX readings on the daily charts for both SP500 (47.51) and Nasdaq (47.51) confirm strong downward trends despite intraday gains, highlighting the prevailing bearish sentiment in the broader equity space. This contrast between the Dow's resilience and the underlying bearish pressure in the S&P 500 and Nasdaq warrants attention. It suggests that the Dow's bullish trend might be more fragile than it appears, or that it is being supported by factors not present in the tech-heavy Nasdaq.
Key Levels and Potential Scenarios
Support and Resistance: The Battleground
The current trading range for the Dow Jones Industrial Average ($52,844.53) is defined by critical support and resistance levels that traders are closely monitoring. On the 4-hour chart, the immediate support lies at $52,755.33, followed by $52,711.67 and $52,667.33. These levels have proven their significance over the past week, acting as a bulwark against bearish sentiment. A break below these points would invalidate the current bullish posture and could trigger a more substantial sell-off. Conversely, resistance is encountered at $52,843.33, $52,887.67, and $52,931.33. A decisive move above the $52,843.33 resistance, particularly with increasing volume, could signal the resumption of the upward trend and open the door for further gains towards the $52,931.33 level and beyond.
The daily chart presents broader levels: support at $52,407.67, $51,971.33, and $51,725.67, while resistance is observed at $53,089.67, $53,335.33, and $53,771.67. The proximity of the current price to the 4-hour resistance suggests that the immediate focus is on whether the index can break out of its current range. A successful breakout above $52,931.33 on the 4-hour chart could lead to a test of the daily resistance zone. The strength of the trend, as indicated by the ADX on multiple timeframes, suggests that if a breakout occurs, it could be sustained. However, the conflicting signals from oscillators like Stochastic on the 4-hour chart indicate that a period of consolidation might precede any significant directional move.
Trade Scenarios: Mapping the Possibilities
Bearish Scenario: The Breakdown Below Support
30% ProbabilityNeutral Scenario: Continued Consolidation
35% ProbabilityBullish Scenario: Breaking Resistance
35% ProbabilityThe Path Forward: What to Watch Next
Looking ahead, the Dow Jones Industrial Average ($52,844.53) stands at a crucial juncture. The resilience shown above support levels suggests that the bulls are still in play, but the lack of a decisive breakout above resistance points to lingering caution. The key level to watch in the coming trading sessions will be the $52,843.33 resistance on the 4-hour chart. A convincing break above this level, confirmed by sustained price action and potentially increased trading volume, could signal the resumption of the upward trend. This would likely be supported by a weaker dollar and potentially a more risk-on environment in the broader equity markets. Traders should be looking for confirmation signals, such as a higher daily close above this resistance, before committing to a long position.
Conversely, a failure to overcome $52,843.33 could lead to further consolidation or even a test of the lower support levels. The $52,755.33 support is paramount; a breach of this level would likely invalidate the immediate bullish outlook and could open the door for a more significant downward move, potentially targeting the $52,711.67 and $52,667.33 areas. The conflicting signals from oscillators like the Stochastic on the 4-hour chart suggest that a short-term pullback is a distinct possibility, even within the broader bullish trend. Therefore, a patient approach, waiting for clear directional signals and confirmation, will be essential for navigating the current market conditions. Monitoring the correlation with the DXY and the performance of the S&P 500 and Nasdaq will be vital for gauging the overall market sentiment.
The current technical setup, with strong daily uptrend indicators like RSI at 67.98 and a positive MACD, suggests that the path of least resistance is still to the upside. However, the consolidation observed on shorter timeframes and the mixed signals from oscillators like Stochastic indicate that the market is digesting recent gains. The ADX readings across timeframes confirm a strong trend is present, but the sideways price action means this trend is currently in a pause or consolidation phase. For the bulls to regain full control, a decisive breakout above the $52,843.33 resistance is necessary. For the bears to gain traction, a breach of the $52,755.33 support would be the first major sign of weakness. Until then, the market remains in a delicate balance, offering opportunities for both short-term traders playing the range and longer-term investors holding for the continuation of the primary trend.
The economic calendar in the coming week will be crucial. While specific major events might not be immediately on the horizon for the Dow Jones itself, broader market drivers such as inflation data, central bank commentary, and employment figures can significantly influence risk appetite. Given the current consolidation, any unexpected macroeconomic data or geopolitical news could act as the catalyst needed to break the stalemate. For instance, weaker-than-expected employment figures could further weaken the dollar and boost equities, while stronger inflation data might rekindle fears of further rate hikes, putting pressure on indices like the Dow Jones. Therefore, staying attuned to macroeconomic releases and geopolitical developments will be as important as monitoring the technical levels themselves.
The Dow Jones Industrial Average ($52,844.53) has navigated a week of indecision, consolidating its gains around a key price point. The underlying bullish trend, however, remains intact as evidenced by daily chart indicators and the holding of critical support levels. The immediate future hinges on the index's ability to break through the $52,843.33 resistance. While short-term fluctuations and potential pullbacks are possible due to mixed oscillator signals and broader equity market caution, the overall technical picture on the daily timeframe supports a continued upward trajectory. Traders are advised to watch for decisive moves above resistance or clear breaks below support, while keeping a close eye on macroeconomic events that could provide the next directional impetus.
Frequently Asked Questions: DowJones30 Analysis
What happens if the DowJones30 breaks below the $52,755.33 support level?
If the DowJones30 closes decisively below the 4-hour support at $52,755.33, it would invalidate the immediate bullish outlook. This breakdown could lead to a further test of lower support levels, such as $52,711.67 and potentially $52,667.33, as bearish sentiment could accelerate.
Should I buy the DowJones30 at current levels around $52,844.53 given the mixed signals?
Buying at current levels around $52,844.53 carries risk due to mixed signals from oscillators like Stochastic on the 4-hour chart. A higher probability trade would involve waiting for a confirmed breakout above $52,843.33 resistance, or a clear bounce from $52,755.33 support.
Is the RSI at 65.55 on the 4-hour chart a sell signal for the DowJones30?
An RSI reading of 65.55 on the 4-hour chart is not a direct sell signal but indicates strong upward momentum that is approaching overbought territory. While it suggests caution and potential for a short-term pullback, it aligns with the overall bullish trend on the daily timeframe, requiring confirmation from other indicators or price action.
How will upcoming economic data releases affect the DowJones30's trend above $52,844.53?
Upcoming economic data, particularly employment and inflation figures, can significantly impact the DowJones30's trend. Stronger-than-expected data could pressure the index by fueling rate hike fears, while weaker data might support it by increasing expectations for Fed easing, potentially driving it higher past $52,844.53.
| Indicator | Value | Signal | Interpretation |
|---|---|---|---|
| RSI (14) | 67.98 | Bullish | Strong uptrend momentum, nearing overbought on daily. |
| MACD Histogram | +0.53 | Bullish | Positive momentum confirmed on daily, supporting trend. |
| Stochastic | K=83.19, D=64.48 | Bullish | Bullish crossover in overbought territory on daily, signals continued strength but requires caution. |
| ADX | 30.24 | Strong Trend | Confirms a powerful uptrend on the daily chart. |
| Bollinger Bands | Middle Band | Bullish | Price trading above the middle band on daily chart supports uptrend. |
Track markets in real-time
AI-powered analysis, technical indicators and real-time price data.
Join Our Telegram Channel
Breaking market news, AI analysis and trading signals instantly.
Join Channel