

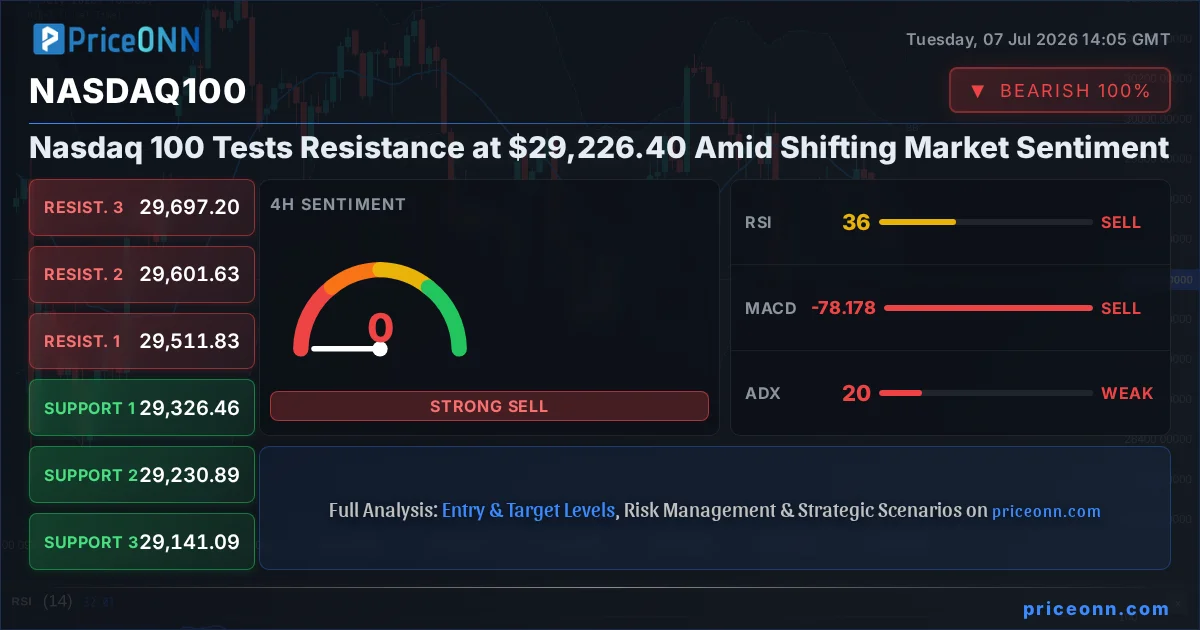
The Nasdaq 100, a barometer for the tech-heavy segment of the US equity market, is currently navigating a critical juncture, trading near the $29,226.40 mark. This level is not just a number; it represents a confluence of recent price action, investor sentiment, and the ever-present influence of macroeconomic forces. As traders and investors digest a complex tapestry of economic data, central bank pronouncements, and geopolitical undercurrents, understanding the potential pathways forward for this pivotal index becomes paramount. The interplay between inflation concerns, interest rate expectations, and the inherent resilience of the tech sector is creating a dynamic trading environment, demanding a nuanced approach to market analysis. This analysis delves into the current technical and fundamental landscape, exploring the drivers shaping the Nasdaq 100's trajectory and what key levels traders should be watching.
- RSI at 25.45 on the 1H chart signals oversold conditions, suggesting potential for a short-term bounce, while the 1D RSI at 46.86 indicates a neutral-to-bearish lean.
- Critical support for the Nasdaq 100 is identified at $29,274.21 on the 1H chart and $29,073.83 on the 1D chart, with resistance looming at $29,553.27 (1H) and $30,294.68 (1D).
- The MACD histogram on the 1H and 4H charts shows negative momentum, indicating bearish pressure, while the ADX at 33.51 on the 1H suggests a strong downtrend is in play.
- Fed rate expectations, influenced by upcoming inflation and employment data, are a key driver, correlating the Nasdaq 100's movements with the DXY's current 100.91 level.
Navigating the Macroeconomic Crosscurrents
The financial markets are currently being shaped by a tug-of-war between persistent inflation concerns and the looming specter of tighter monetary policy. Central banks globally, particularly the Federal Reserve, are walking a tightrope, aiming to curb inflation without triggering a significant economic downturn. Recent data, including the mixed labor market signals and the ongoing debate around the trajectory of interest rates, creates a challenging environment for growth-oriented assets like those heavily represented in the Nasdaq 100. The market's reaction to Fed minutes and upcoming economic releases, such as inflation reports and employment figures, will be crucial in determining the next directional move. For instance, any indication of a more hawkish stance from the Fed, perhaps due to sticky inflation data, could lead to increased pressure on growth stocks, pushing the Nasdaq 100 towards its key support levels. Conversely, signs of inflation cooling faster than expected or a dovish pivot could reignite buying interest.
The Dollar Index (DXY), currently trading at 100.91, plays a significant role in this dynamic. A strengthening dollar often correlates with increased pressure on global equities, including the Nasdaq 100, as it can signal tighter financial conditions and reduced appetite for risk assets. Conversely, a weakening dollar might coincide with a risk-on environment, potentially providing a tailwind for the index. The correlation between the DXY and the Nasdaq 100, while not always perfect, is a critical element for traders to monitor. As the DXY hovers around the 100.91 mark, its influence on global capital flows and investor sentiment cannot be understated. The market is keenly watching for any shifts in this relationship, which could provide vital clues about broader market direction.
Technical Signals: A Mixed Picture on Multiple Timeframes
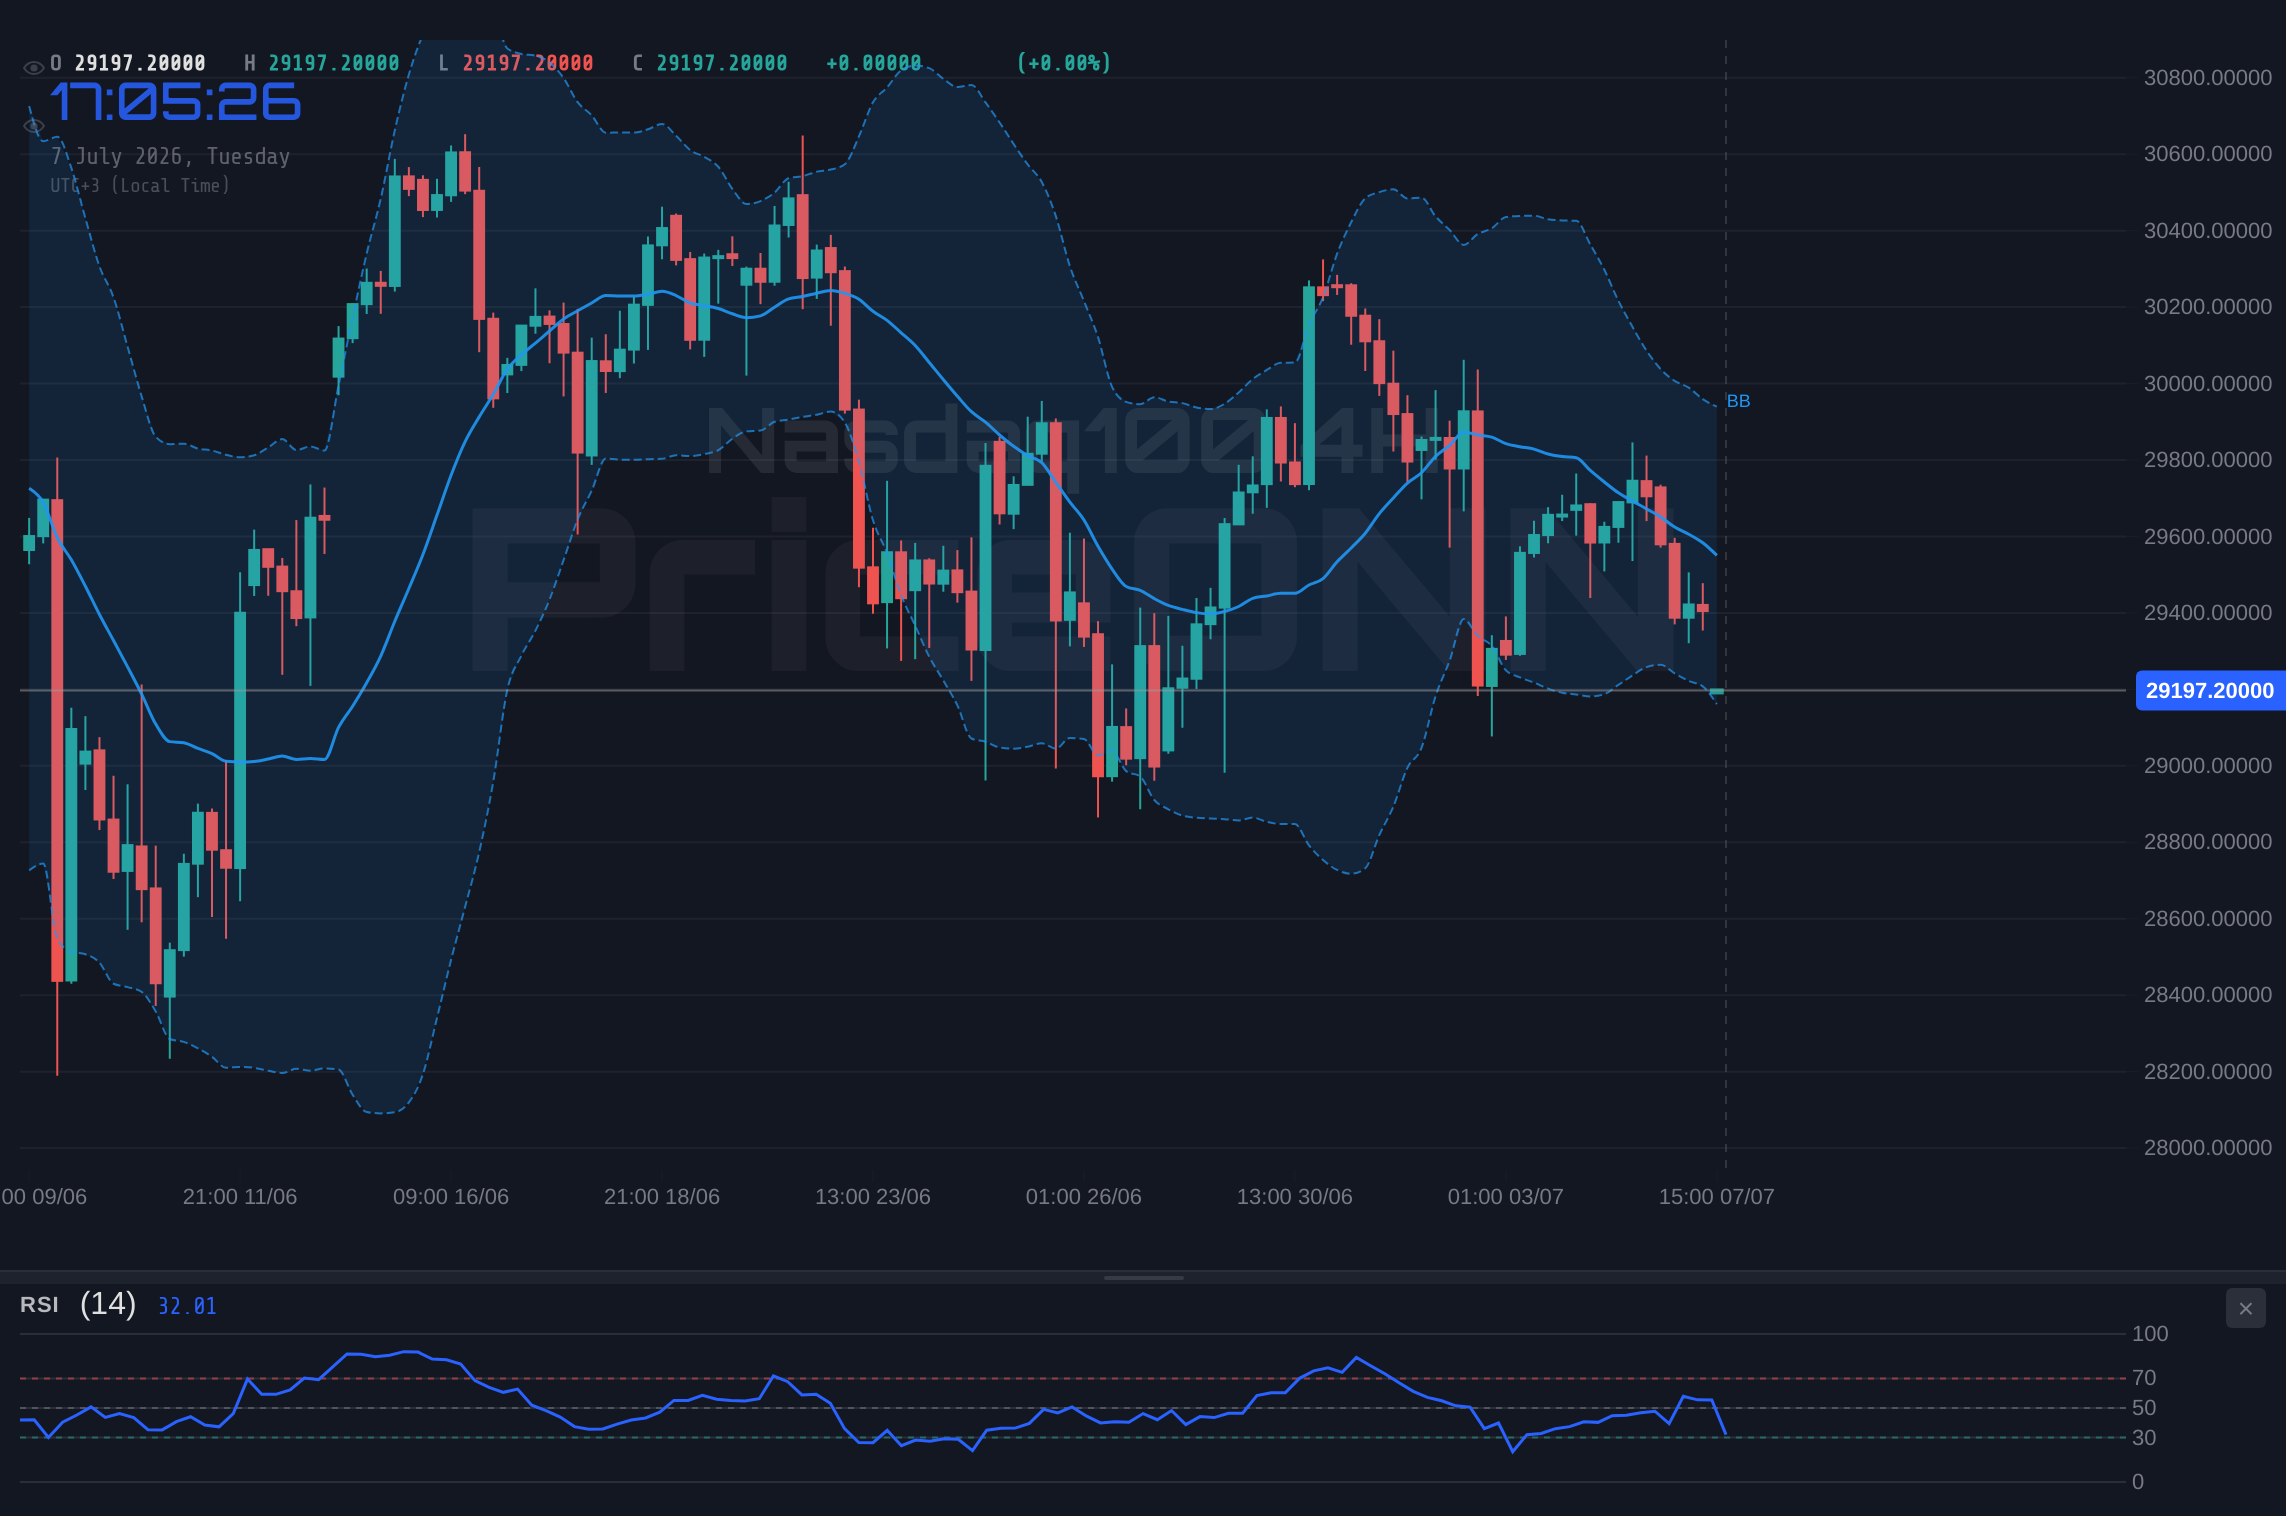
Examining the Nasdaq 100's technical landscape reveals a divergence of signals across different timeframes, underscoring the current market uncertainty. On the 1-hour chart, the index is trading at $29,226.40, with immediate support identified at $29,274.21 and resistance at $29,553.27. The RSI(14) at 25.45 suggests oversold conditions in this very short-term timeframe, potentially hinting at a near-term bounce. However, the MACD histogram is showing negative momentum, and the ADX at 33.51 indicates a strong downtrend, painting a bearish picture for intraday traders. This suggests that while a short-term technical rebound might be possible, the underlying trend on this timeframe remains weak.
Deeper analysis on the 4-hour chart presents a slightly different, though still cautious, outlook. Here, support is found at $29,326.46, with resistance at $29,511.83. The RSI(14) at 36.85 remains in neutral territory, leaning towards bearish, while the MACD continues to exhibit negative momentum. The ADX at 19.79 points to a weaker trend on this timeframe, suggesting consolidation or a lack of strong directional conviction. This timeframe's signals are not as decisively bearish as the 1-hour chart, hinting that the intraday weakness might be a temporary phase within a broader, potentially more range-bound, market movement.
The daily timeframe provides the most significant context. With the Nasdaq 100 currently at $29,226.40, the key support level is $29,073.83, and the critical resistance is $30,294.68. The daily RSI(14) stands at 46.86, firmly in neutral territory and showing a slight downward eğilimi, which aligns with the bearish outlook from the shorter timeframes. The MACD, however, displays positive momentum on the daily chart, with the MACD line above its signal line, offering a glimmer of hope for a potential reversal or stabilization. The Bollinger Bands are trading below the middle band, indicating a bearish trend, but the ADX at 15.62 suggests a weak trend overall, implying that the current downward move may lack sustained conviction. This blend of signals suggests that while the immediate pressure is bearish, the longer-term picture is still forming, and a significant catalyst may be needed to break the current stalemate.
The Influence of Tech Sector Dynamics
Within the Nasdaq 100, the performance of its constituent mega-cap technology stocks plays a disproportionately large role in shaping the index's overall direction. These companies, often at the forefront of innovation in areas like artificial intelligence, cloud computing, and semiconductors, are highly sensitive to shifts in interest rate expectations and overall economic growth prospects. A rising interest rate environment can increase borrowing costs for these companies and reduce the present value of their future earnings, thus impacting their stock valuations. Conversely, a stable or declining rate environment, coupled with robust consumer demand for their products and services, can fuel significant rallies.
Currently, the market is grappling with the implications of potential shifts in central bank policy. If inflation remains stubbornly high, central banks might be compelled to maintain higher interest rates for longer, or even implement further tightening measures. This scenario would likely put downward pressure on growth stocks, impacting the Nasdaq 100. However, if economic data begins to show a sustained cooling of inflation, coupled with resilient employment figures, it could open the door for central banks to signal a pause or even a pivot towards rate cuts. Such a development would undoubtedly be a significant tailwind for the tech-heavy Nasdaq 100, potentially triggering a strong upward re-rating of the index and its components.
Correlation Analysis: DXY, SP500, and Oil's Role
The Nasdaq 100 does not operate in a vacuum; its movements are intricately linked to broader market trends and key economic indicators. The Dollar Index (DXY), currently at 100.91, serves as a crucial reference point. When the DXY strengthens, it typically implies a global preference for dollar-denominated assets, often at the expense of riskier investments like equities. This inverse correlation means that a rising DXY can exert downward pressure on the Nasdaq 100, especially if the strength is driven by hawkish Fed policy expectations. Traders closely monitor the DXY's trajectory for clues about global liquidity and risk appetite.
The S&P 500, trading at 6572.87, provides another vital correlation. As a broader measure of the US stock market, its performance often influences the Nasdaq 100. A strong upward trend in the S&P 500 generally supports the Nasdaq 100, while a decline in the S&P 500 can drag the tech-heavy index lower, particularly if the weakness is concentrated in growth sectors. Recent S&P 500 data shows a 0.74% increase, reaching 6572.87, suggesting some positive momentum in the broader market, although the 1D RSI indicates a potential for a pullback. Furthermore, oil prices, with Brent crude at $73.55, act as a key inflation indicator. Rising oil prices can fuel inflation expectations, potentially leading to tighter monetary policy, which, as discussed, could negatively impact the Nasdaq 100. Conversely, falling oil prices might signal easing inflationary pressures, a scenario that could be more favorable for growth stocks.
Economic Calendar: Key Events to Watch
The coming days and weeks are packed with economic events that will undoubtedly shape the market's narrative and influence the Nasdaq 100's path. Investors are keenly awaiting key inflation data, such as CPI and PCE reports, which will provide crucial insights into the persistence of inflationary pressures. The outcomes of these reports will heavily influence the Federal Reserve's monetary policy decisions. Similarly, employment data, including Non-Farm Payrolls (NFP) and unemployment rate figures, will offer a gauge of the labor market's health and its implications for consumer spending and overall economic growth. Any deviation from expectations in these high-impact releases could trigger significant market volatility.
Upcoming central bank communications, including speeches from Fed officials and the release of meeting minutes, will also be under intense scrutiny. These communications often provide forward guidance on monetary policy, signaling the potential direction of interest rates. The market's interpretation of this guidance - whether it leans hawkish or dovish - will play a pivotal role in shaping risk appetite and, consequently, the performance of growth-oriented indices like the Nasdaq 100. For example, a hawkish tone from the Fed could reinforce the current bearish momentum, while a dovish signal might pave the way for a bullish reversal. Traders must remain vigilant, tracking these economic releases and communications to anticipate potential market reactions.
Bullish Scenario: Rebound from Support
25% ProbabilityNeutral Scenario: Range-Bound Consolidation
40% ProbabilityBearish Scenario: Breakdown Below Key Support
35% ProbabilityThe Road Ahead: Caution and Opportunity
The current market environment for the Nasdaq 100 is characterized by a delicate balance of forces. While short-term technical signals on the 1-hour chart may suggest oversold conditions and a potential for a bounce, the broader downtrend indicated by MACD on shorter timeframes and the neutral-to-bearish RSI on the daily chart warrant caution. The ADX values, particularly the strong trend reading on the 1-hour chart (33.51), suggest that downward momentum could persist, especially if key economic data releases prove to be unfavorable. The critical support at $29,073.83 on the daily chart is a level to watch closely; a decisive breach of this level could signal a more significant correction.
However, opportunity often lies within volatility. If upcoming economic data surprises to the upside, perhaps showing a faster-than-expected cooling of inflation, or if central banks signal a more dovish policy path, the Nasdaq 100 could find a strong footing. A confirmed breakout above the $29,553.27 resistance on the 1-hour chart, backed by increasing volume and positive sentiment, could signal the start of a renewed uptrend. The interplay between the DXY's current level of 100.91 and the Nasdaq 100's reaction will be a key indicator of risk appetite. Ultimately, patient traders who adhere to strict risk management principles and wait for clear confirmation of a directional bias will be best positioned to navigate these uncertain, yet potentially rewarding, market conditions.
Frequently Asked Questions: Nasdaq100 Analysis
What happens if the Nasdaq 100 breaks below the key support level of $29,073.83?
A decisive close below $29,073.83 on the daily chart would likely invalidate the bullish scenario and signal a further downside move. This could trigger a sell-off towards the next significant support levels, potentially around $28,100, as bearish sentiment takes hold.
Is the RSI at 25.45 on the 1H chart a buy signal for the Nasdaq 100 at $29,226.40?
While an RSI of 25.45 often indicates oversold conditions and can precede a short-term bounce, it is not a standalone buy signal. The negative MACD momentum and strong ADX trend on the 1H chart suggest caution is warranted, and confirmation from price action or other indicators would be necessary.
How is the DXY at 100.91 influencing the Nasdaq 100's current trend analysis?
The DXY's current level of 100.91 suggests a relatively strong dollar, which typically exerts downward pressure on risk assets like the Nasdaq 100. This correlation indicates that any further strengthening of the dollar could exacerbate selling pressure on the index.
How will upcoming inflation data affect the Nasdaq 100's outlook this week?
Higher-than-expected inflation data could lead the Federal Reserve to maintain or increase interest rates, negatively impacting the Nasdaq 100. Conversely, softer inflation readings might encourage a more dovish Fed stance, potentially boosting the index towards its resistance levels.
Track markets in real-time
AI-powered analysis, technical indicators and real-time price data.
Join Our Telegram Channel
Breaking market news, AI analysis and trading signals instantly.
Join Channel