

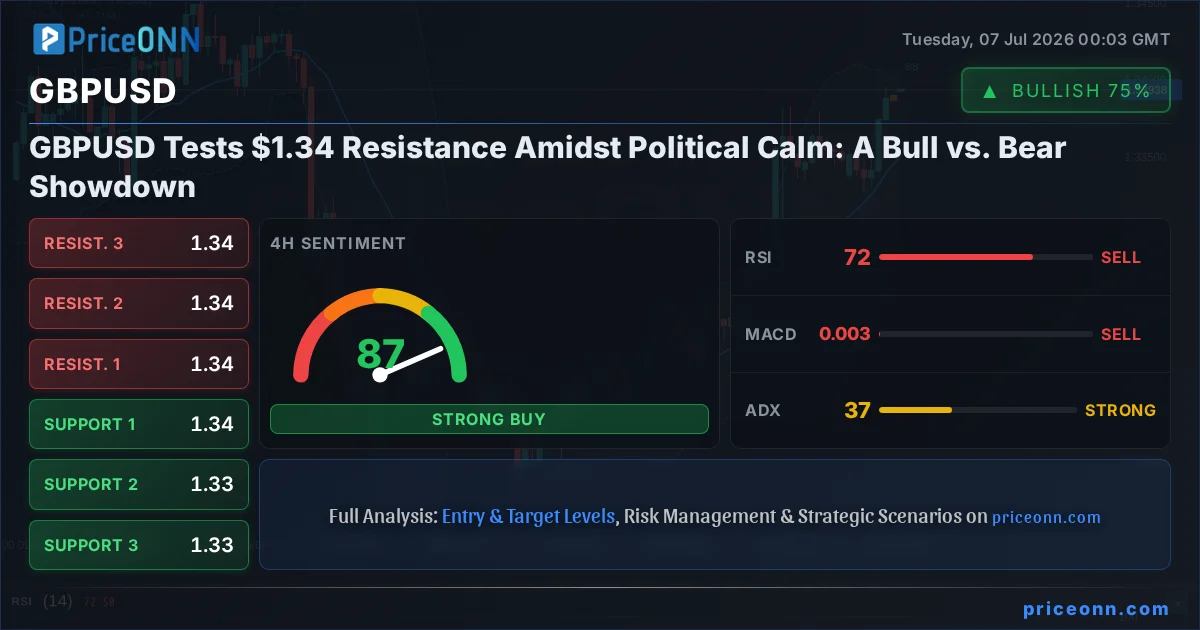
The currency pair GBPUSD is currently locked in a tense battleground around the $1.34 mark. After a period of political uncertainty, the recent stabilization in Britain's political landscape has provided a much-needed tailwind for the Sterling. This development has ignited a debate among traders and analysts: Is this the start of a sustained bullish run for GBPUSD, or are we merely witnessing a temporary reprieve before renewed selling pressure emerges? The market's current positioning, with bulls pushing towards resistance and bears on alert, sets the stage for a critical juncture that demands a closer look at both sides of the argument.
- The GBPUSD is currently trading at $1.33948, facing resistance near $1.34009.
- Political stabilization in the UK has bolstered the Pound, with the 1H RSI at 68.57 indicating bullish momentum.
- However, the 1D Stochastic is showing %K at 88.81 and %D at 63.69, suggesting potential overbought conditions.
- Correlation analysis shows DXY at 100.87, currently under pressure, which typically supports GBPUSD.
The Bull Case: Sterling's Sterling Performance
The narrative for the bulls hinges on the perceived easing of political headwinds that have plagued the UK economy for some time. The "Sunrise Market Commentary" from July 6th alluded to the Pound finding support as "the stabilisation of the political situation in Britain is driving the GBPUSD rally." This suggests that the market has largely priced out the immediate political risks, allowing fundamental economic factors to take center stage. With the 1-hour chart showing a robust uptrend (ADX 31.61) and the RSI at a strong 68.57, the momentum is clearly with the buyers. The MACD is also displaying positive momentum on the 1H and 4H charts, reinforcing the idea that upward pressure is building. Furthermore, the current upward trajectory in GBPUSD aligns with a weakening US Dollar Index (DXY), which is currently trading around 100.87 and showing signs of bearish momentum on lower timeframes. This inverse correlation is a classic driver for GBPUSD, and as the DXY faces headwinds, the Sterling often finds room to breathe and appreciate.
Digging deeper into the technicals, the 4-hour chart for GBPUSD, while showing a neutral trend, still paints a cautiously optimistic picture for the bulls. The RSI at 71.58, though bordering on overbought, indicates strong buying interest that has been sustained. The ADX at 37.07 confirms a strong uptrend, suggesting that the current move has conviction behind it. Even though the Stochastic %K is above %D, the overall signal remains bullish, hinting at continued upward momentum. The price action itself, consistently pushing higher from support levels like $1.33512 and testing resistance around $1.33868, shows a clear upward bias. The fact that GBPUSD has managed to close higher for the day, currently at $1.33948, adds another layer of confirmation. This sustained price action, coupled with positive sentiment stemming from political stability and a weaker dollar, provides a solid foundation for the bullish argument.
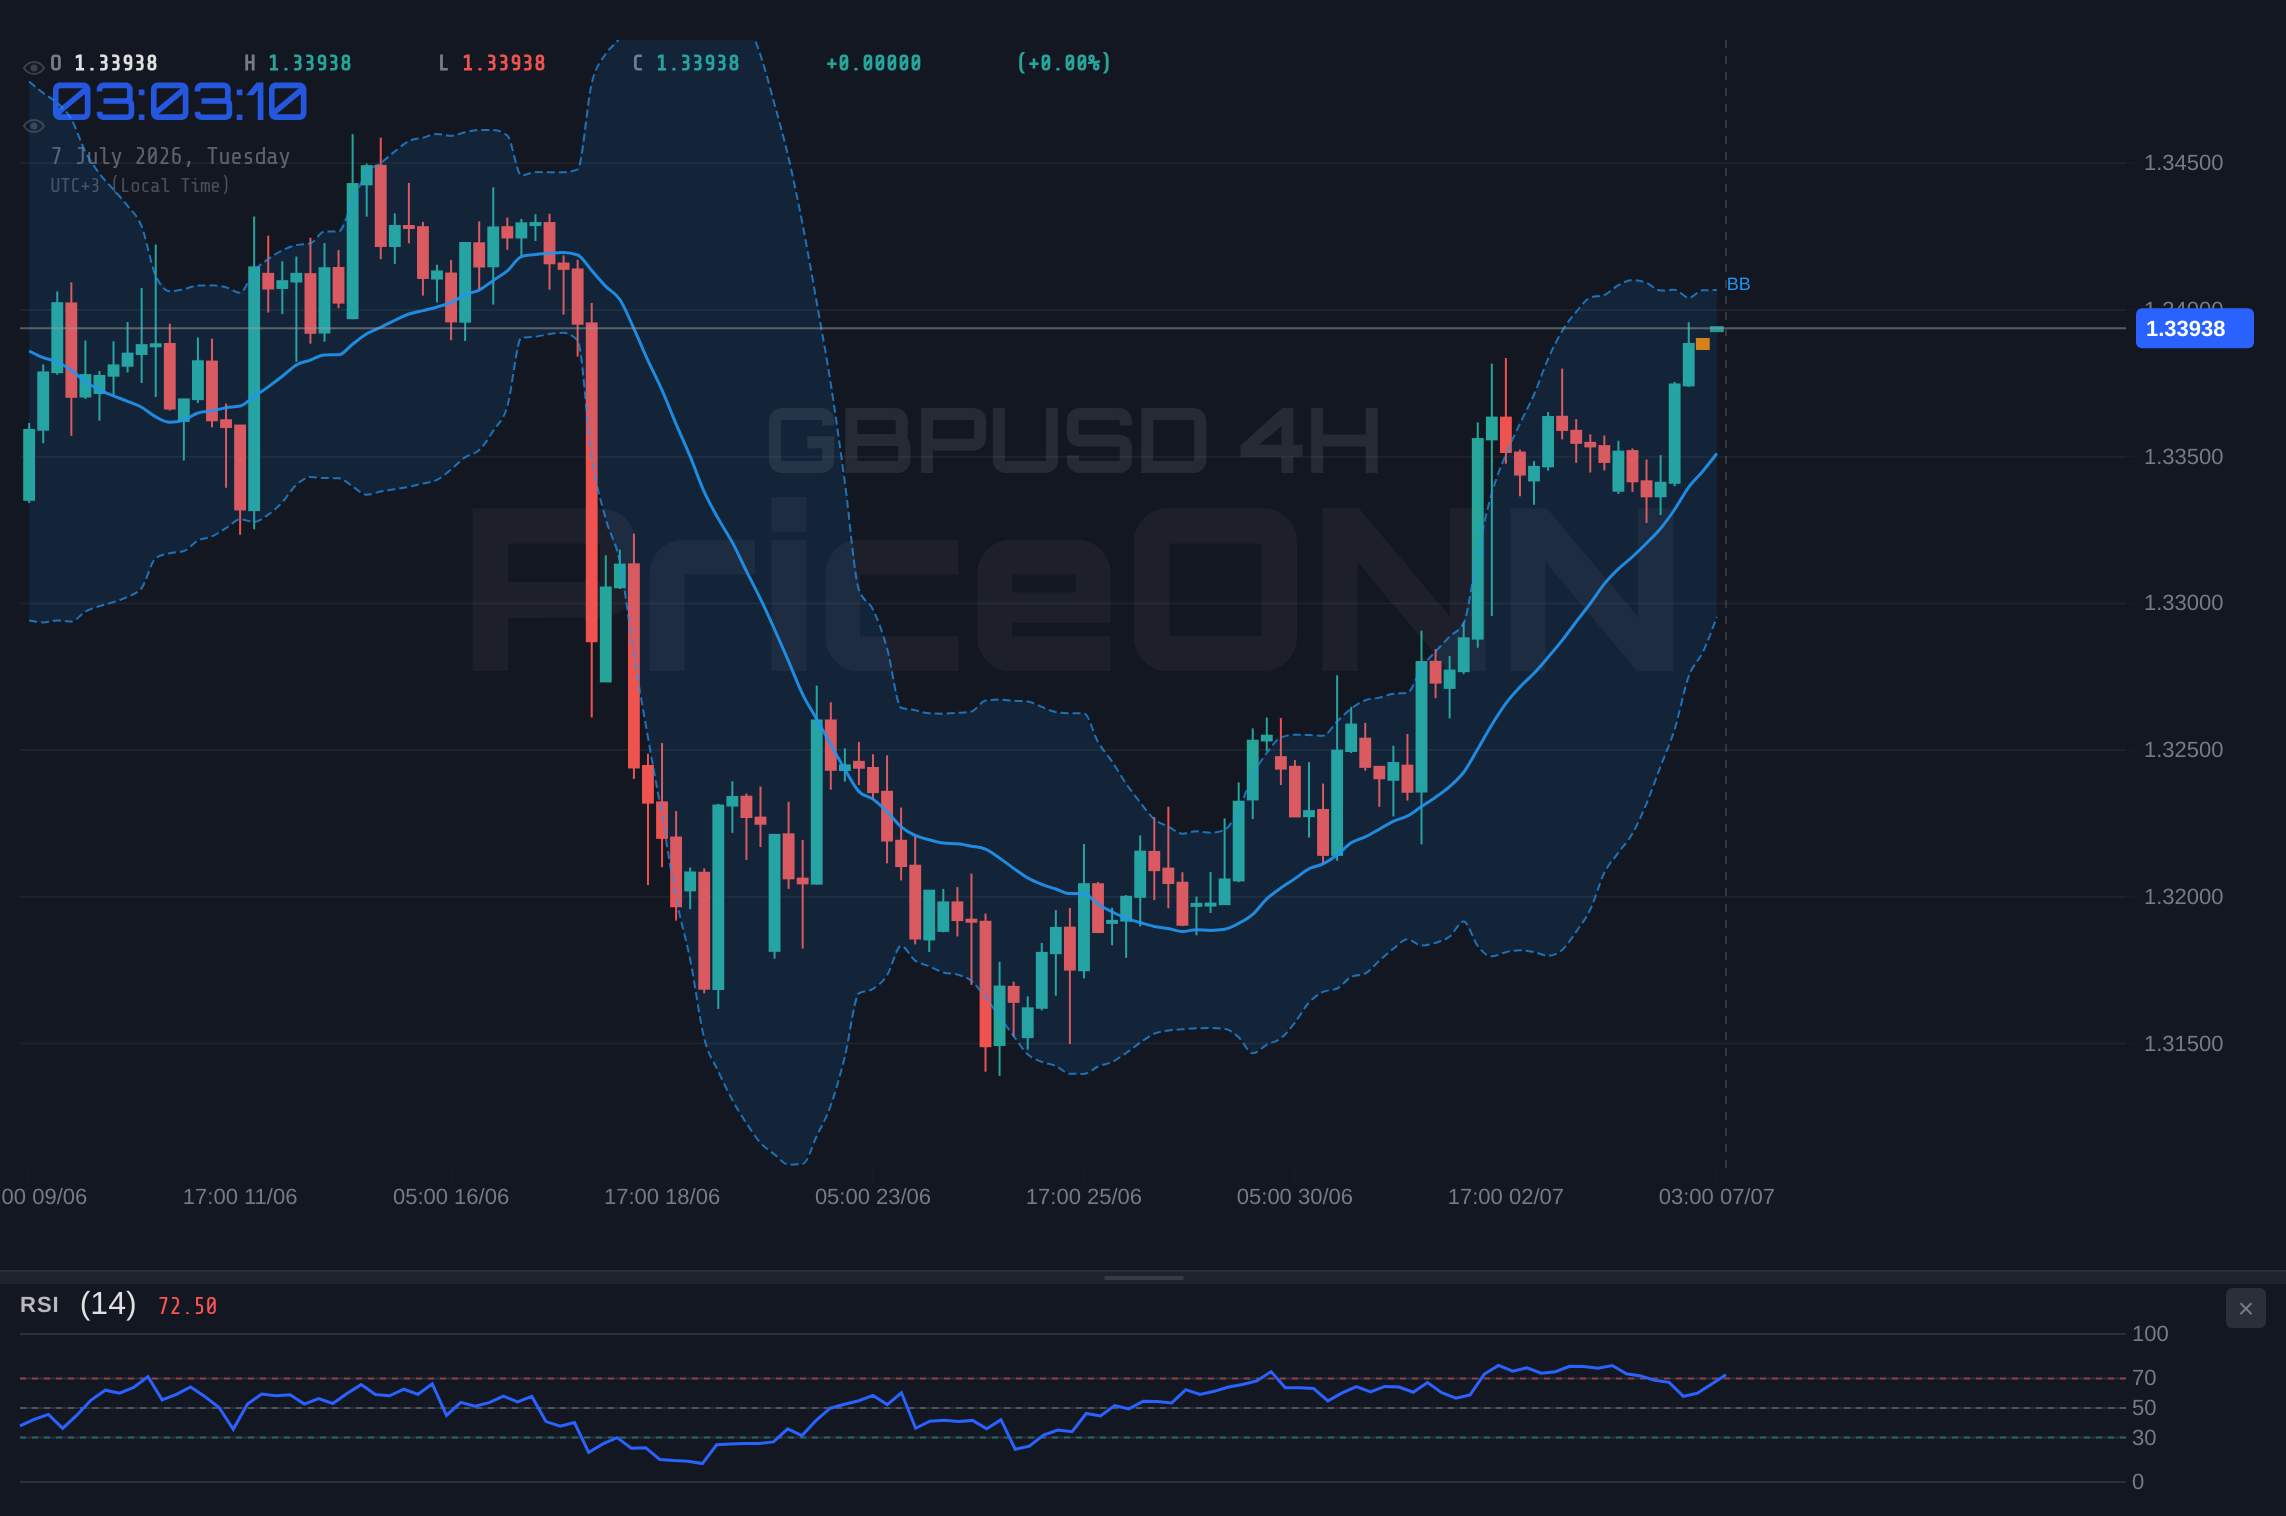
On the daily timeframe, the picture becomes slightly more nuanced, but the underlying bullish sentiment can still be argued. The RSI at 56.98 remains in neutral territory but shows an upward eğilimi, suggesting there's still room for growth before hitting extreme overbought levels. The MACD is positive, and while the Stochastic is showing a bullish crossover (%K > %D), it's also entering higher territory, which could signal a move towards overbought conditions soon. The ADX at 22.48 indicates a moderately strong uptrend. The key here is that the daily chart has not yet shown signs of a definitive reversal. Instead, it appears to be consolidating or building strength before potentially testing higher resistance levels. The current price of $1.33948 is pushing towards the daily resistance at $1.34003. A decisive break and hold above this level would be a significant victory for the bulls, potentially opening the door for further gains towards $1.34207 and beyond. The market's ability to absorb selling pressure and maintain higher lows is crucial for this bullish thesis to play out.
The Bear Case: Resistance Looms, Dangers Ahead
Despite the positive sentiment surrounding the Pound, the bears have compelling arguments rooted in technical overextension and the ever-present threat of macroeconomic shifts. The most immediate concern is the proximity to resistance levels. On the 1-hour chart, $1.34009 is a clear hurdle, and the Stochastic oscillator, with %K at 88.59 and %D at 91.26, is deep in overbought territory. This suggests that the recent rally might be running out of steam and a pullback is becoming increasingly likely. While the ADX at 31.61 indicates a strong trend, such strong trends can sometimes reverse sharply when momentum falters. The fact that the Bollinger Bands on the 1H chart are showing a slight downward pull from the upper band, despite the price being above the middle band, hints at potential consolidation or a reversal.
The daily chart, in particular, presents a more cautionary tale for the bulls. The RSI at 56.98 is still in neutral territory but has shown a slight downward eğilimi, indicating that the buying momentum might be waning. More importantly, the Stochastic oscillator on the daily chart is showing a significant divergence with %K (88.81) far exceeding %D (63.69), which is a strong bearish signal. This suggests that the recent surge may be unsustainable and a correction is due. The ADX at 22.48, while indicating a trend, is not as robust as on the shorter timeframes, leaving room for a potential trend exhaustion. Bears will be looking for a failure to break above the $1.34003 resistance on the daily chart, followed by a decisive move below the $1.33743 support. Such a breakdown would invalidate the current bullish narrative and could trigger a sharp sell-off, potentially targeting the $1.33279 support level.
Furthermore, the broader economic context cannot be ignored. While UK political news might be positive, global economic factors, particularly US monetary policy and economic data, play a significant role. The "Sunrise Market Commentary" also noted that "EUR/USD is trading around 1.1432 on Monday. At the end of last week, the main currency pair posted modest gains. Weaker-" US employment data and the potential for Fed rate hikes remain a constant backdrop. Should US economic data surprise to the upside, or if Fed commentary turns hawkish, it could rapidly strengthen the dollar, putting immediate pressure on GBPUSD. The inverse correlation with the DXY, while currently supporting GBPUSD, could quickly flip if the Federal Reserve signals a more aggressive stance on inflation. The bears' strategy would be to capitalize on any such macroeconomic shift or a technical failure at resistance to initiate short positions.
Weighing the Evidence: Technicals and Scenarios
The current market structure for GBPUSD presents a classic bull vs. bear scenario, where the outcome hinges on the price's ability to decisively break through key resistance or respect the established trendlines and indicators. On the 1-hour chart, the bullish signals are strong, with RSI at 68.57 and a clear uptrend indicated by ADX at 31.61. However, the Stochastic oscillator is flashing a warning, deep in overbought territory at 88.59. This divergence between momentum and overbought conditions creates a volatile mix. The 4-hour chart continues to show a strong uptrend (ADX 37.07) with RSI at 71.58, but again, the Stochastic is showing some caution. It's on the daily chart where the most conflicting signals emerge. The RSI is neutral but trending up, while the Stochastic is showing a strong bearish divergence (%K 88.81 vs %D 63.69), and the ADX at 22.48 suggests the trend might be losing steam.
This confluence of mixed signals necessitates a scenario-based approach. The market is at a critical inflection point. The bulls need to see a clean break above the $1.34003 daily resistance, supported by increasing volume and sustained price action above this level. If this occurs, the path towards the next resistance at $1.34207 and potentially higher becomes more probable. Conversely, the bears are waiting for a failure at the $1.34003 resistance, or a decisive break below the $1.33743 support on the daily chart. Such a move would invalidate the current bullish setup and likely trigger a cascade of stop-losses, accelerating a decline towards the $1.33279 support. The neutral scenario anticipates a period of consolidation, perhaps a range-bound market between the current price and the key resistance/support levels, as traders await clearer direction from upcoming economic data or geopolitical developments.
The recent news flow provides context for this tug-of-war. The "Politics Comes to the Rescue" headline suggests that the immediate political overhang has lifted, which is a clear positive for the Pound. However, the "S&P 500: Index Narrows Its Range as the Labour Market Cools" and "Silver Price Forecast: XAG/USD holds losses below $62.50 on Fed hike bets" articles highlight ongoing concerns about the US economy and the Federal Reserve's potential actions. These global macro factors are crucial. If upcoming US data, such as employment figures or inflation reports, suggest a stronger economy or a more hawkish Fed, it could quickly shift the sentiment against GBPUSD, regardless of UK political stability. The strength of the DXY at 100.87, despite some short-term weakness, remains a key factor to monitor. A resurgence in the dollar would put immediate downward pressure on GBPUSD.
Bearish Scenario: Resistance Holds, Dollar Rebounds
40% ProbabilityNeutral Scenario: Range-Bound Consolidation
30% ProbabilityBullish Scenario: Breakout Confirmation
30% ProbabilityThe Verdict: Cautious Optimism with a Watchful Eye
The data paints a picture of cautious optimism for GBPUSD. The immediate catalyst of political stabilization is a tangible positive, and the technicals on the shorter timeframes show strong bullish momentum, supported by a weakening DXY. The 1-hour and 4-hour charts are screaming 'buy,' with RSI and MACD readings favoring upside. However, the daily chart introduces a layer of caution. The bearish divergence on the Stochastic and the proximity to the $1.34003 resistance level cannot be ignored. This suggests that while the path of least resistance may currently be upwards, the upside could be limited in the short term, and a significant catalyst would be needed for a decisive breakout. The key takeaway is that while bulls have the immediate edge due to sentiment and short-term technicals, the long-term picture requires confirmation. A sustained break above $1.34003 is crucial for the bullish case to gain further traction, while a failure here could see a swift reversion towards the $1.33743 support. Traders should remain vigilant, manage risk tightly, and await clearer signals from upcoming economic data releases, particularly from the US, which could easily sway the DXY and, consequently, GBPUSD.
The current environment demands a strategic approach. For those leaning bullish, waiting for a confirmed breakout above $1.34003 on the daily chart, ideally with increased volume, would offer a higher probability entry. The targets would then be the next resistance levels. Conversely, bears might look for a rejection at resistance, coupled with a breakdown of the $1.33743 support, to initiate short positions, targeting the lower support levels. A neutral stance, waiting for a clear break of either the near-term resistance or support, might be the most prudent approach for traders who prefer to let the market dictate direction. The market is at a crossroads, and patience will likely be rewarded as clearer directional signals emerge from the interplay of UK political sentiment, US economic data, and the ongoing global risk appetite.
Frequently Asked Questions: GBPUSD Analysis
What happens if GBPUSD breaks above the $1.34003 daily resistance level?
A sustained break above $1.34003, confirmed by strong volume and price action on the daily chart, would validate the bullish scenario. This could trigger further upside momentum, potentially targeting the next resistance at $1.34207, and even the psychological level around $1.34500.
Should I buy GBPUSD at current levels around $1.33948, given the RSI at 68.57 on the 1H chart?
Buying at current levels carries risk due to the overbought Stochastic on the 1H and 4H charts, and proximity to daily resistance. A more prudent approach for bulls would be to wait for a confirmed breakout above $1.34003 or a pullback to a strong support level like $1.33743, with a probability estimate of around 30% for a sustained breakout in the immediate short term.
Is the RSI at 56.98 on the daily chart a sell signal for GBPUSD?
An RSI of 56.98 on the daily chart is considered neutral territory, indicating a slight upward eğilimi but not yet overbought. While it doesn't signal a direct sell, it suggests that the upward momentum might be moderating, especially when considered alongside the bearish divergence on the daily Stochastic oscillator.
How will upcoming US economic data, like employment figures, affect GBPUSD this week?
Stronger-than-expected US employment data could lead to a strengthening of the US Dollar Index (DXY), which would likely put downward pressure on GBPUSD. Conversely, weaker data could further weaken the DXY, supporting a potential rally in GBPUSD, especially if UK political stability continues.
Track markets in real-time
AI-powered analysis, technical indicators and real-time price data.
Join Our Telegram Channel
Breaking market news, AI analysis and trading signals instantly.
Join Channel